Hail in Mayer · Aug 29, 2026
NEXRAD logged 0 hail signatures up to 0"; the estimated-size surface reached 0.5" aloft. Open it on the live map to see the swath over the streets.

7-day free trial in the iPhone app. No card required to start.
For iPhone. Android coming soon.
Web trial: 7 days free. Card required. $150/month after the trial unless cancelled.
Convective day · Aug 29, 2026 · noon–noon UTC
Severity
The 10th most severe storm Mayer has seen in the last 12 months
Overview's storm severity score weighs hailstone size, homes in the footprint, and ground-truth reports.
- Peak hail signal
- 13 /100
- Homes exposed
- 0 /100
- Ground truth
- 0 /100
Largest radar-indicated size — a signal of damage potential, not confirmation.
How many homes sit inside the storm's footprint.
Independent storm reports filed with the NWS.
Evidence / storm surfaces
How Mayer saw the hail — from two instruments
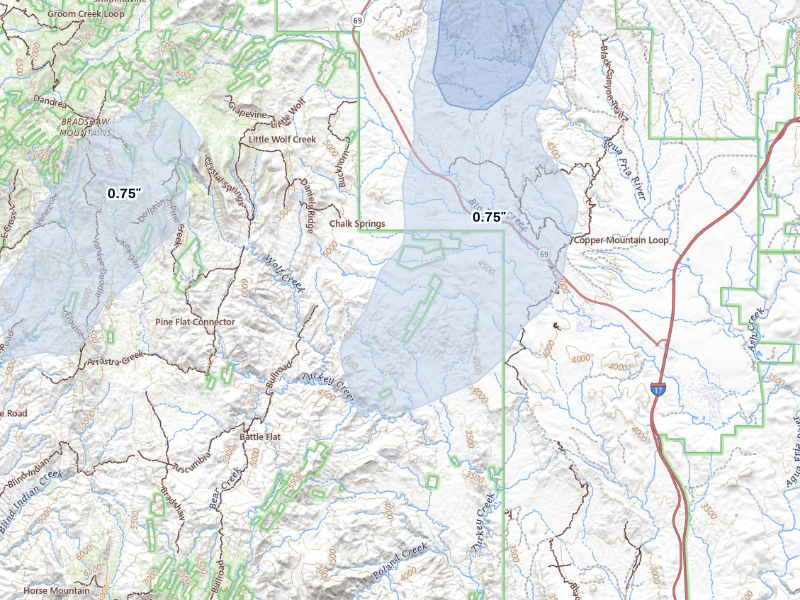
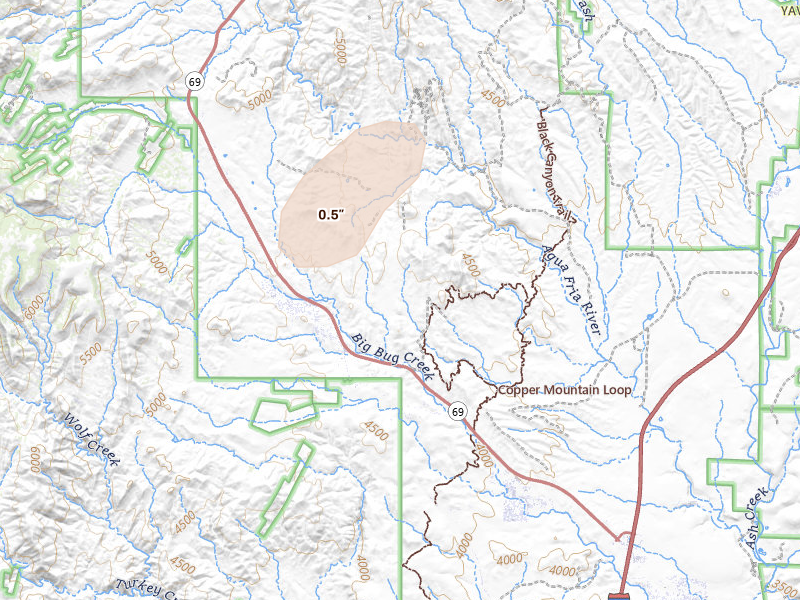
Two instruments, one storm: NEXRAD logs the point signatures it detected overhead, while the estimated-size surface models how large the hail aloft could have grown. Agreement between them is not guaranteed — the gaps are where the model ran ahead of, or behind, the detections.
 Radar signature field
NEXRAD's hail signatures for this storm: the spots the radar detected from above. A detection overhead is not the same thing as a confirmed stone below.
 Estimated size field
Radar-estimated maximum hail size across the swath, modeled from radar aloft. It reflects the biggest stone the storm could support, which may differ from what actually fell.
The storm in context
Where Aug 29, 2026 sits in Mayer's hail record.
This was Mayer's 9th recorded hail day, arriving 10 days after the Aug 19, 2026 storm. By severity it ranks 10th of the 11 storms we have logged here. Radar put the day's largest stone over Mayer at 0.5" — radar-estimated size aloft.
The Aug 29, 2026 convective day was bigger than Mayer: the same system put hail over 113 other tracked cities, 15 of them in Arizona. Nearest: Dewey (11 miles north, up to 0.5"); Prescott (26 miles northwest, up to 0.5"); Clarkdale (32 miles north, up to 1.25").
These maps are stills. In the app this date is one of 11 Mayer storm dates on a live map — both surfaces, the reports, and a replay — and the same map is where you draw the swath. This page rebuilds nightly.
Ground reports
What people on the ground reported
These are storm reports filed with the National Weather Service and released through the NOAA Storm Prediction Center — public-domain observations from spotters, the public, and NWS surveys. We quote each one exactly as filed.
The National Weather Service logged no spotter reports for this storm over Mayer. That absence is ordinary — filing a report takes a person on the spot who saw the hail and phoned it in. What stands as the record for this date is the radar above, which caught the storm regardless.
Below the severe threshold
What 0.5" hail means for Mayer roofs.
Radar signals under three-quarters of an inch stay below the National Weather Service severe threshold and generally indicate lower roof risk. Older or already-worn materials can still show effects, but radar alone cannot determine whether a specific roof was damaged.
Radar reading · not confirmed damage
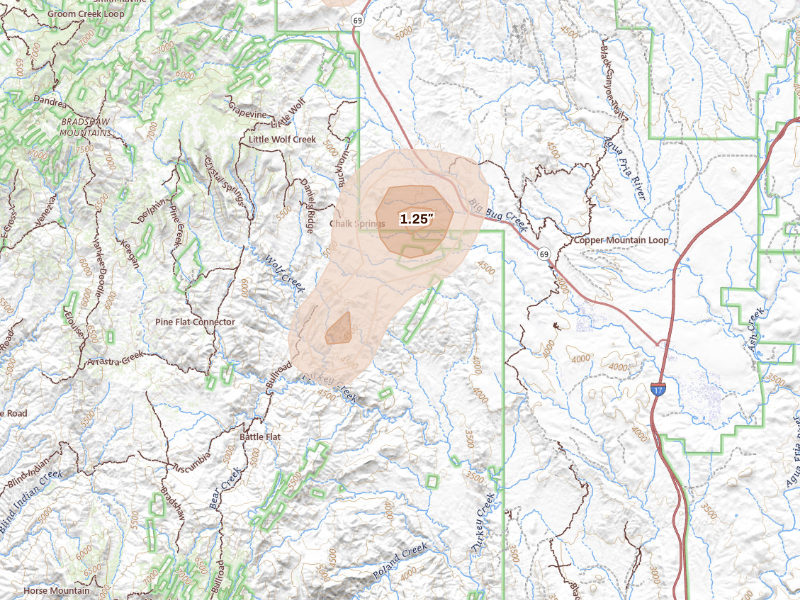 Estimated-size surface
Sep 13, 2026
1.25"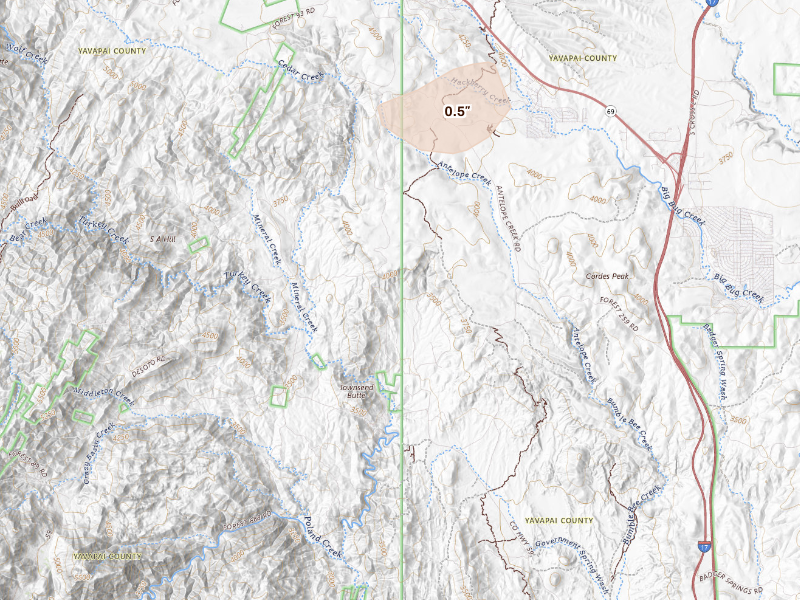 Estimated-size surface
Sep 12, 2026
0.5"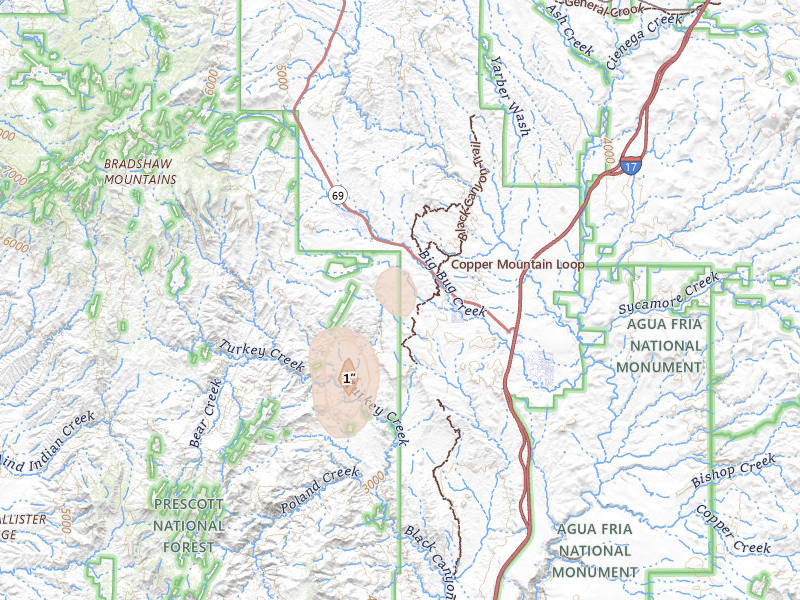 Estimated-size surface
Aug 19, 2026
1"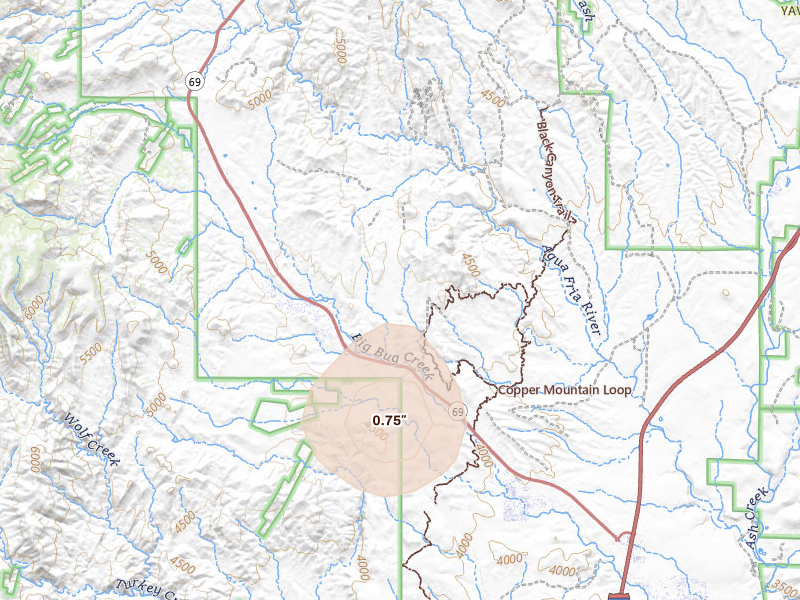 Estimated-size surface
Aug 10, 2026
0.75"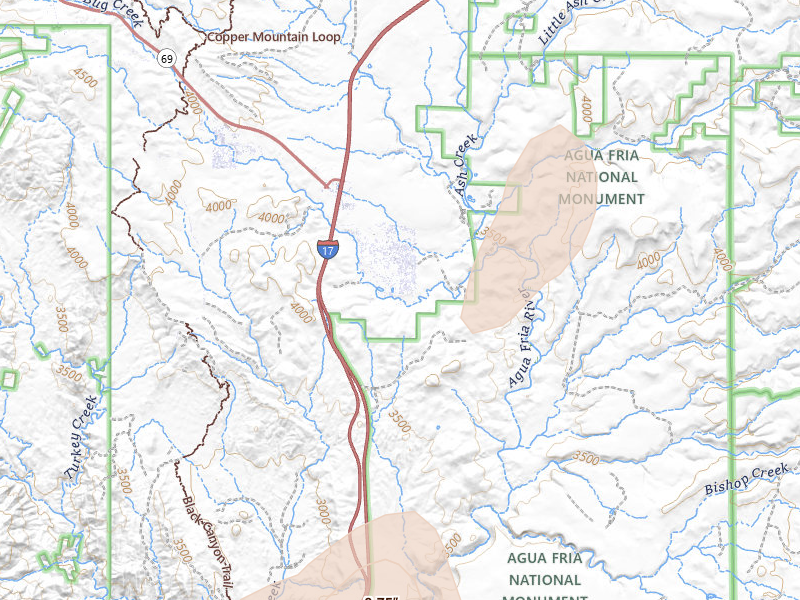 Estimated-size surface
Aug 8, 2026
0.5"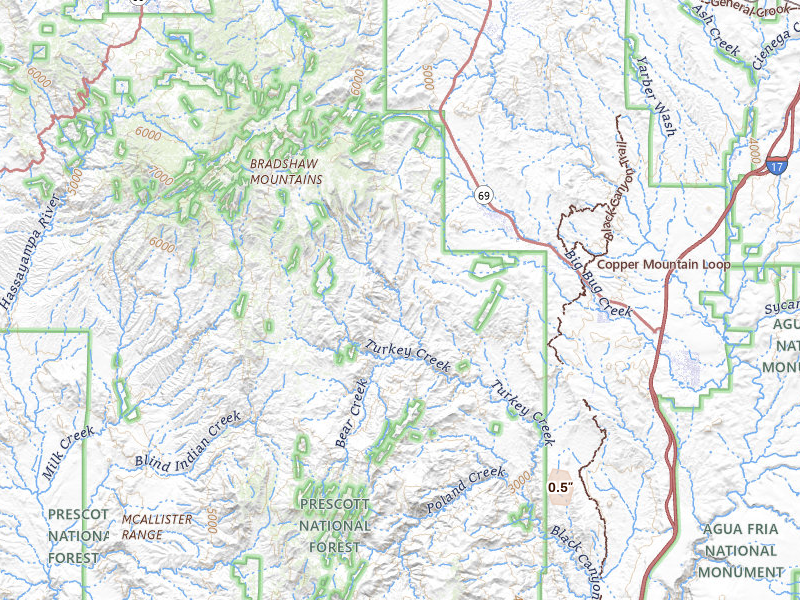 Estimated-size surface
Jul 26, 2026
1"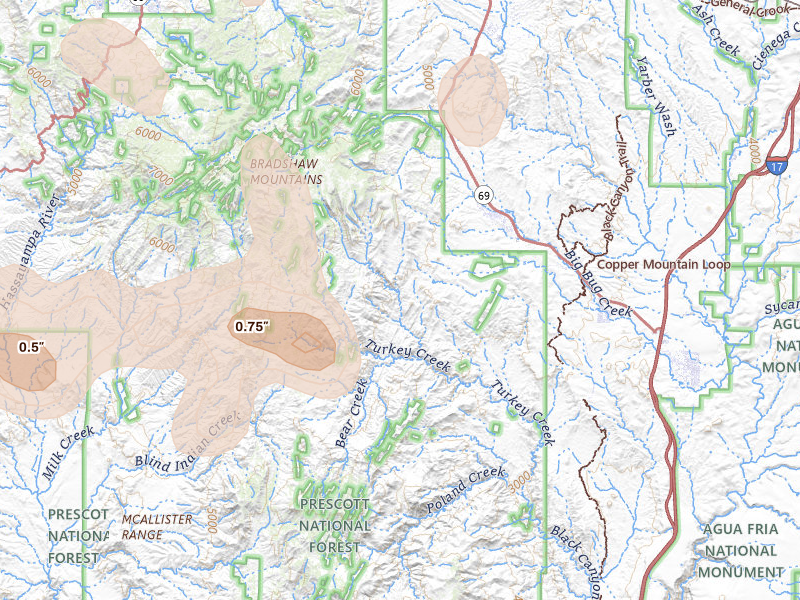 Estimated-size surface
Jul 12, 2026
2.5"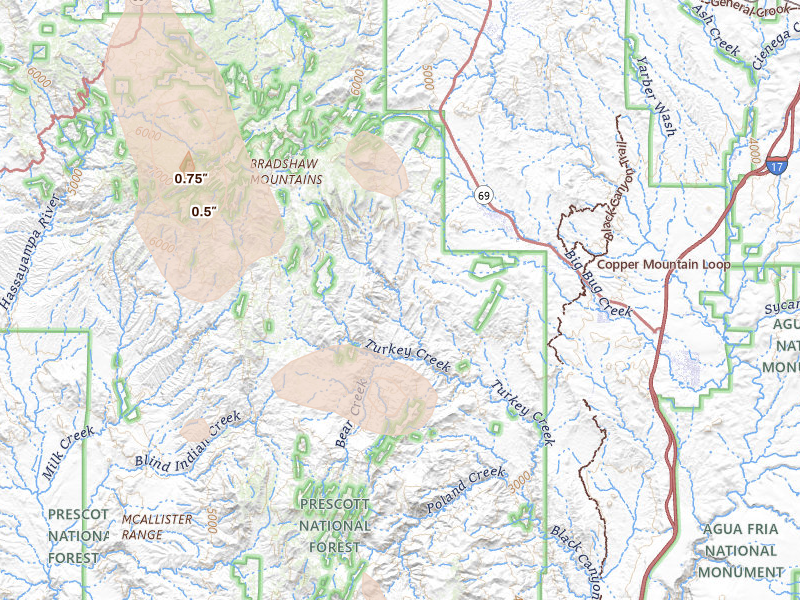 Estimated-size surface
Jun 15, 2026
0.75"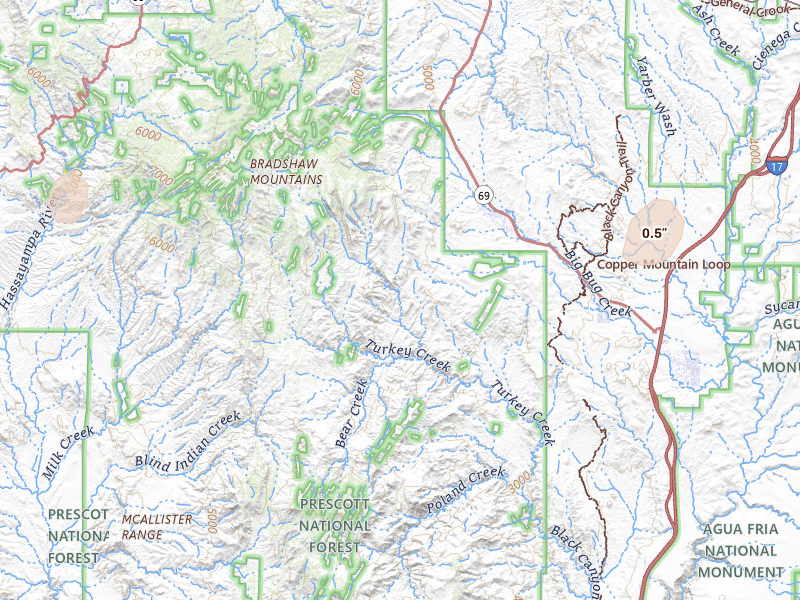 Estimated-size surface
Jun 14, 2026
0.5"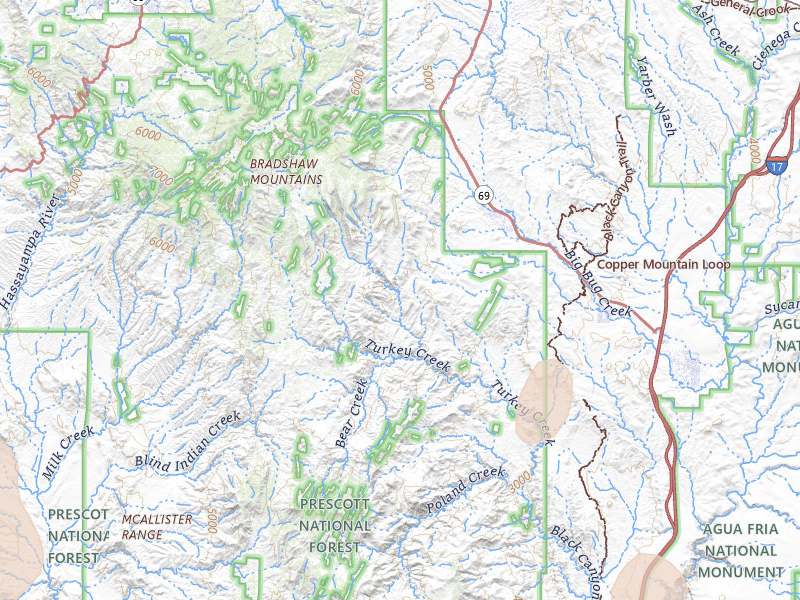 Estimated-size surface
May 25, 2026
0.5"The next storm won’t wait for you.
Set your territory and alerts today. When hail hits, use Overview to choose your streets and get moving.

7-day free trial in the iPhone app. No card required to start.
For iPhone. Android coming soon.
Web trial: 7 days free. Card required. $150/month after the trial unless cancelled.