Tornado Rating unknown
2 SE Brems Starke County
“Barn debris found on route 8 northwest of Knox. Location relayed by storm chaser. Time estimated via radar. Delayed report. (IWX)”
— NOAA / SPC storm report
The estimated-size surface reached 1" aloft; NEXRAD logged no point detections over Knox that day. Open it on the live map to see the swath over the streets.
A tornado was also reported to the National Weather Service during this storm. The ground reports below show where it was filed.

7-day free trial in the iPhone app. No card required to start.
For iPhone. Android coming soon.

Web trial: 7 days free. Card required. $150/month after the trial unless cancelled.
Convective day · Mar 10, 2026 · noon–noon UTC
Severity
Overview's storm severity score weighs hailstone size, homes in the footprint, and ground-truth reports.
Largest radar-indicated size — a signal of damage potential, not confirmation.
How many homes sit inside the storm's footprint.
Independent storm reports filed with the NWS.
Evidence / storm surfaces
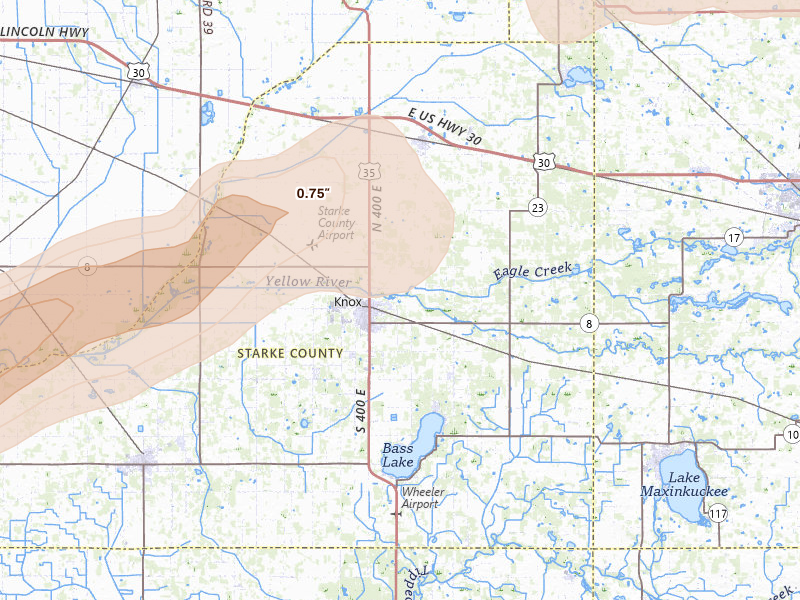
The maps here read the same storm from two angles — point detections from NEXRAD, and modeled hail size aloft. Where the two disagree is informative: it marks where estimated size outran the signatures, or trailed them.
 Estimated size field
 The modeled maximum hail size across the swath, derived from radar aloft — the largest stone the storm could have supported, which is not necessarily what reached the ground.
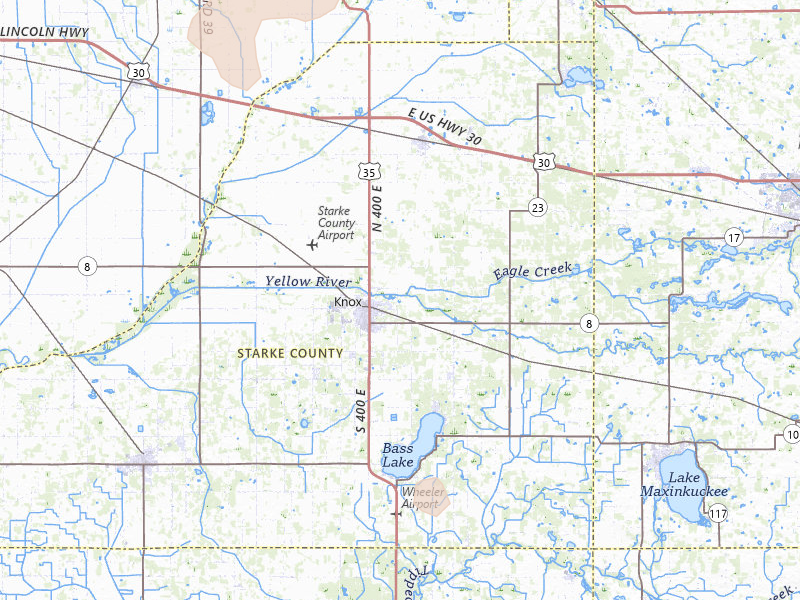
Only the radar-estimated size surface resolved for Mar 10, 2026 — this storm produced no NEXRAD point detections over Knox, so there is one map to show, not two.
The storm in context
This was Knox's 1st recorded hail day — the first hail day in our records for the city. By severity it ranks 2nd of the 5 storms we have logged here. Radar put the day's largest stone over Knox at 1" — radar-estimated size aloft.
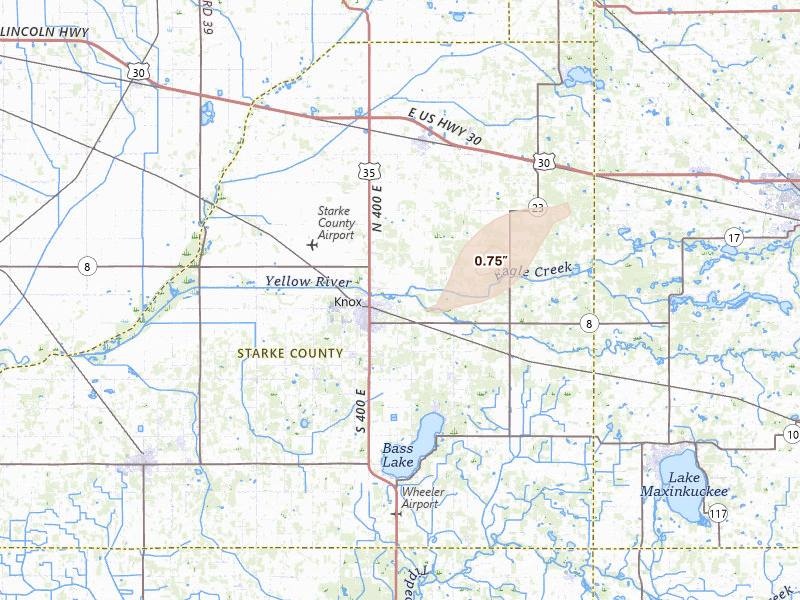
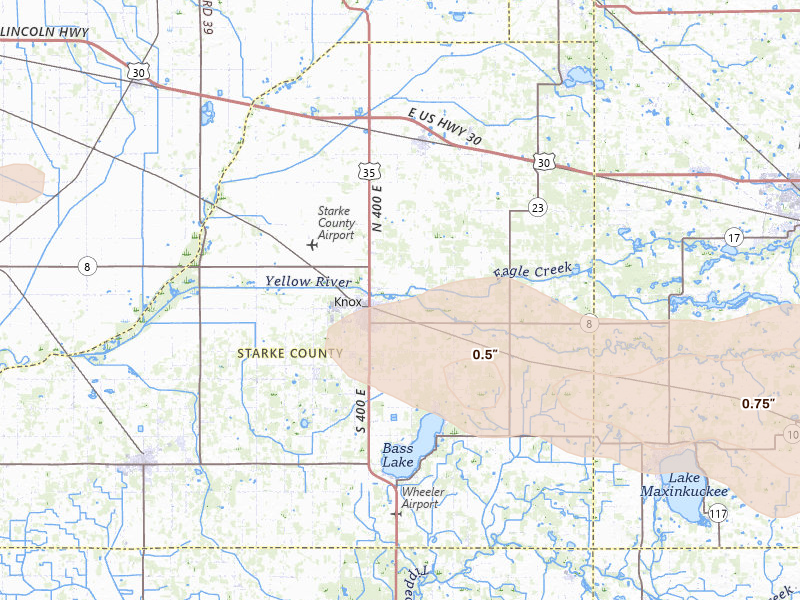
The Mar 10, 2026 convective day was bigger than Knox: the same system put hail over 470 other tracked cities, 21 of them in Indiana. Nearest: Walkerton (9 miles northeast, up to 0.75"); La Crosse (13 miles west, up to 1.5"); Union Mills (17 miles northwest, up to 0.75").
These maps are stills. In the app this date is one of 5 Knox storm dates on a live map — both surfaces, the reports, and a replay — and the same map is where you draw the swath. This page rebuilds nightly.
Ground reports
These are storm reports filed with the National Weather Service and released through the NOAA Storm Prediction Center — public-domain observations from spotters, the public, and NWS surveys. We quote each one exactly as filed.
“Barn debris found on route 8 northwest of Knox. Location relayed by storm chaser. Time estimated via radar. Delayed report. (IWX)”
— NOAA / SPC storm report
“Powerlines down on Route 8. 10 to 20 power flashes seen in the distance. Location relayed by storm chaser. Time estimated via radar. Delayed report. (IWX)”
— NOAA / SPC storm report
“Tornado picture from spotter sent in looking to the west-northwest. Lat/lon is spotter location. Delayed report. (IWX)”
— NOAA / SPC storm report
“Healthy 1ft diameter trees uprooted. Some snapped at the top. (IWX)”
— NOAA / SPC storm report
“Video obtained from storm chasers claiming to be on the south-southeast side of the parent mesocyclone clearly show two distinct tornadoes occurring at the same time. O (IWX)”
— NOAA / SPC storm report
“Spotter said there is damage to numerous trees in this area near W County Road 200 S on IN-39. (IWX)”
— NOAA / SPC storm report
“Corrects previous tstm wnd dmg report to tornado from 2 SW Brems. Report of a barn destroyed with debris on Route 8 just west of the Starke County airport. Time estimat (IWX)”
— NOAA / SPC storm report
“Tornado observed. Damage between East 200 South and East 50 south. Large diameter trees downed. (IWX)”
— NOAA / SPC storm report
Storm forensics
Read from the arrival times and locations of the NOAA ground reports, not a radar-measured storm track.
Reports came from Brems and Toto — beyond Knox itself.
Damage-capable hail signal
Quarter-size and larger hail can bruise asphalt mats, remove granules, and dent exposed soft metal. The mapped footprint identifies an inspection priority area — it does not identify which individual roofs, if any, sustained damage.
Radar reading · not confirmed damage
Roofing exposure
Potential roof exposure
$7.5M
Potential roof exposure — 627 homes × the ~$12,000 industry-average hail roof claim. Exposure, not confirmed damage.
Close just 0.5% of the 627 homes in this footprint at the average $15,000 roof job. Illustrative math, not a projection — your results depend on your outreach and how the market responds.
Claim window
March 2028
Claims from this storm can typically be filed until around March 2028 — the window to reach these homeowners while it's still open. Deadlines vary by policy and state.
Names and phones for every home in the footprint: at most $132 on top of the $150 plan.
 Estimated-size surface
  Estimated-size surface
  Estimated-size surface
 Set your territory and alerts today. When hail hits, use Overview to choose your streets and get moving.
7-day free trial in the iPhone app. No card required to start.
For iPhone. Android coming soon.
Web trial: 7 days free. Card required. $150/month after the trial unless cancelled.