Hail in Panaca · Oct 21, 2026
The estimated-size surface reached 0.5" aloft; NEXRAD logged no point detections over Panaca that day. Open it on the live map to see the swath over the streets.

7-day free trial in the iPhone app. No card required to start.
For iPhone. Android coming soon.
Web trial: 7 days free. Card required. $150/month after the trial unless cancelled.
Convective day · Oct 21, 2026 · noon–noon UTC
Severity
The most severe storm Panaca has seen in the last 12 months
Overview's storm severity score weighs hailstone size, homes in the footprint, and ground-truth reports.
- Peak hail signal
- 13 /100
- Homes exposed
- 6 /100
- Ground truth
- 0 /100
Largest radar-indicated size — a signal of damage potential, not confirmation.
How many homes sit inside the storm's footprint.
Independent storm reports filed with the NWS.
Evidence / storm surfaces
How Panaca saw the hail — from two instruments
Each storm gets two readings: the radar signatures NEXRAD recorded as the cells passed overhead, and a modeled estimate of hail size in the air. They are independent surfaces, so a mismatch between them is expected — and worth reading.
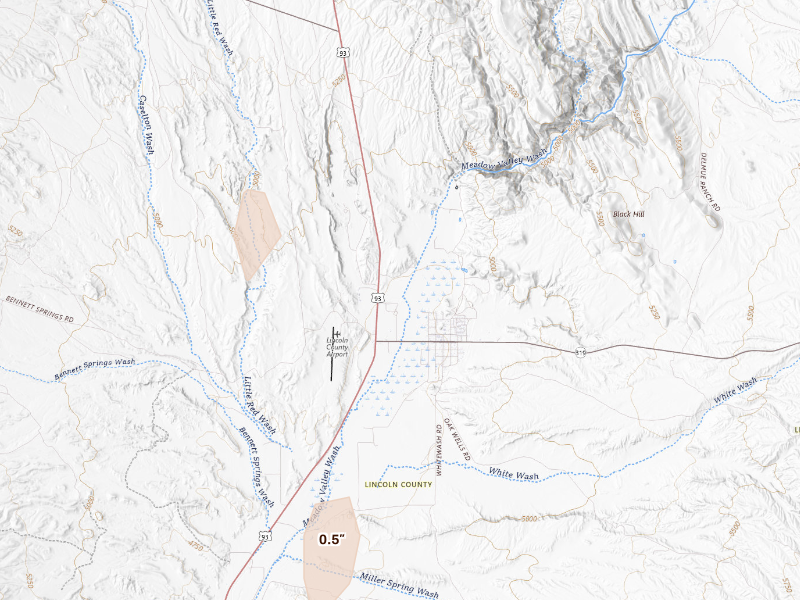 Estimated size field
Radar-estimated hail size over the swath. The model reports the biggest stone the storm could sustain in the air; what actually fell may have been smaller.
Only the radar-estimated size surface resolved for Oct 21, 2026 — this storm produced no NEXRAD point detections over Panaca, so there is one map to show, not two.
The storm in context
Where Oct 21, 2026 sits in Panaca's hail record.
This was Panaca's 3rd recorded hail day, arriving 51 days after the Aug 31, 2026 storm. By severity it ranks 1st of the 3 storms we have logged here. Radar put the day's largest stone over Panaca at 0.5" — radar-estimated size aloft.
The Oct 21, 2026 convective day was bigger than Panaca: the same system put hail over 77 other tracked cities, 2 of them in Nevada. Nearest: Pioche (15 miles north, up to 0.5"); Enterprise (40 miles southeast, up to 0.75"); Dammeron Valley (52 miles southeast, up to 1.25").
These maps are stills. In the app this date is one of 3 Panaca storm dates on a live map — both surfaces, the reports, and a replay — and the same map is where you draw the swath. This page rebuilds nightly.
Ground reports
What people on the ground reported
These are storm reports filed with the National Weather Service and released through the NOAA Storm Prediction Center — public-domain observations from spotters, the public, and NWS surveys. We quote each one exactly as filed.
For this storm over Panaca, the NWS report log is empty — a common outcome, since ground reports only happen when someone witnesses the hail and takes the time to call it in. The detection record for the date lives in the radar maps above.
Below the severe threshold
What 0.5" hail means for Panaca roofs.
Radar signals under three-quarters of an inch stay below the National Weather Service severe threshold and generally indicate lower roof risk. Older or already-worn materials can still show effects, but radar alone cannot determine whether a specific roof was damaged.
Radar reading · not confirmed damage
Roofing exposure
What this storm is worth to a roofer.
Potential roof exposure
$12K
Potential roof exposure — 1 homes × the ~$12,000 industry-average hail roof claim. Exposure, not confirmed damage.
Claim window
October 2028
Claims from this storm can typically be filed until around October 2028 — the window to reach these homeowners while it's still open. Deadlines vary by policy and state.
Names and phones for every home in the footprint: at most $0 on top of the $150 plan.
Panaca hail history
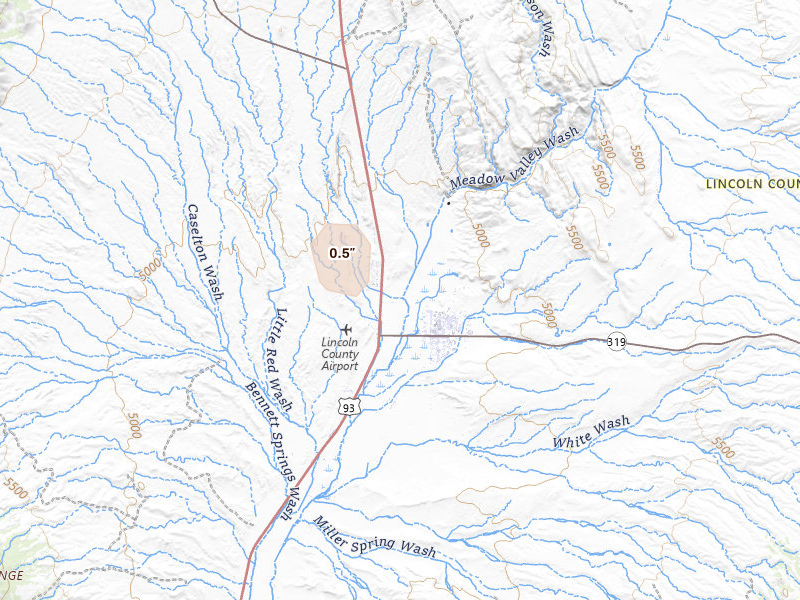
Other storms in Panaca.
The next storm won’t wait for you.
Set your territory and alerts today. When hail hits, use Overview to choose your streets and get moving.

7-day free trial in the iPhone app. No card required to start.
For iPhone. Android coming soon.
Web trial: 7 days free. Card required. $150/month after the trial unless cancelled.