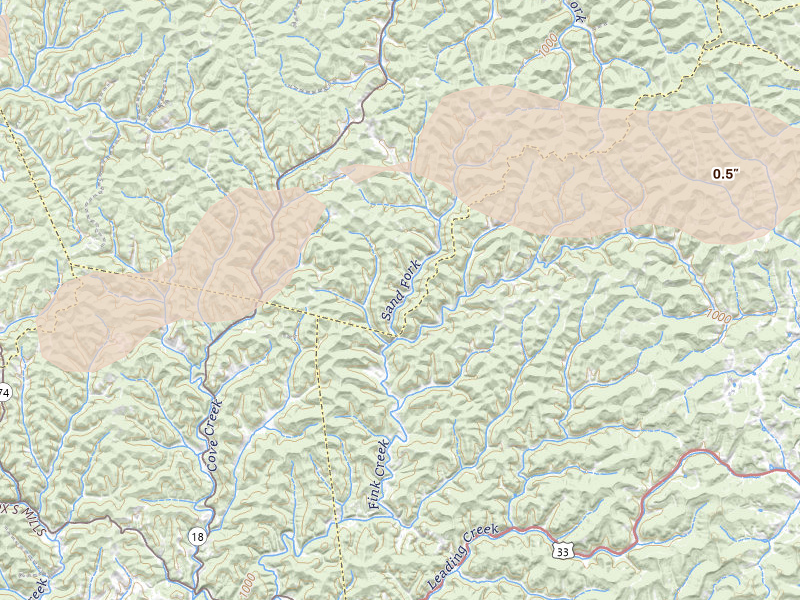
Hail storms on May 13, 2026

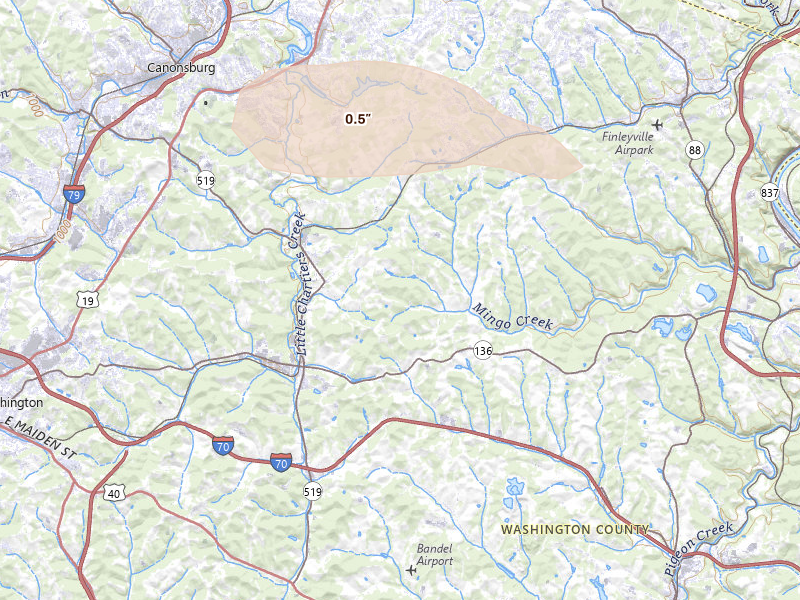
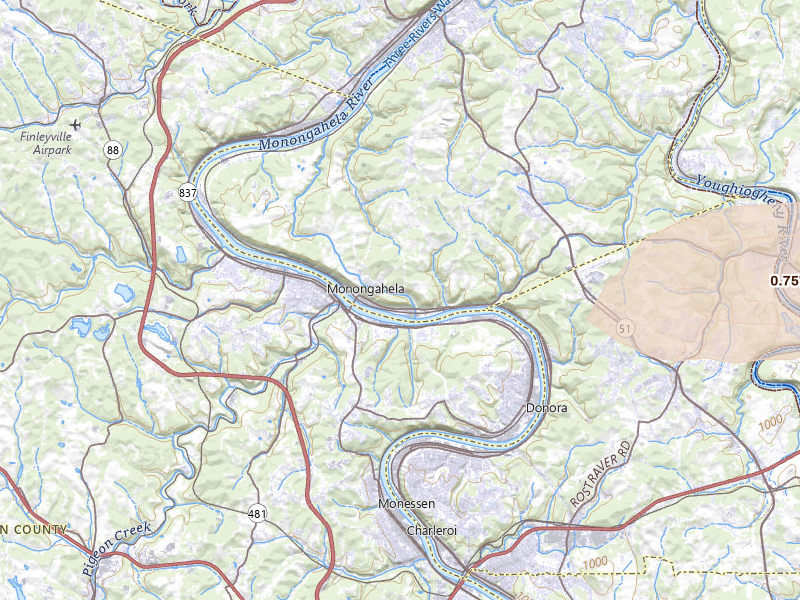
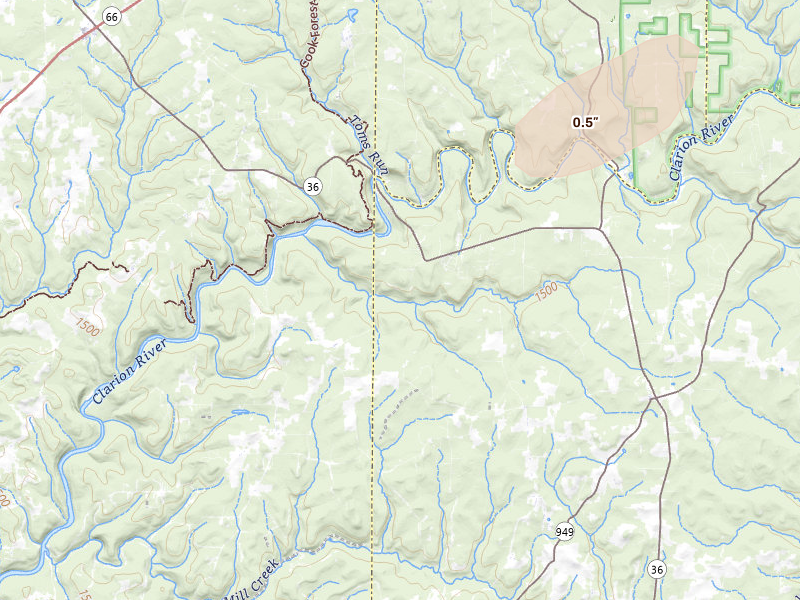
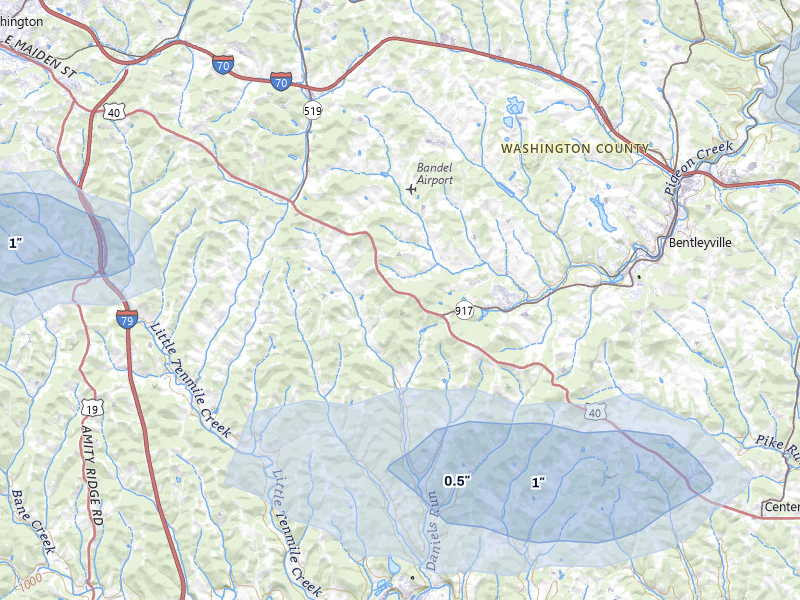
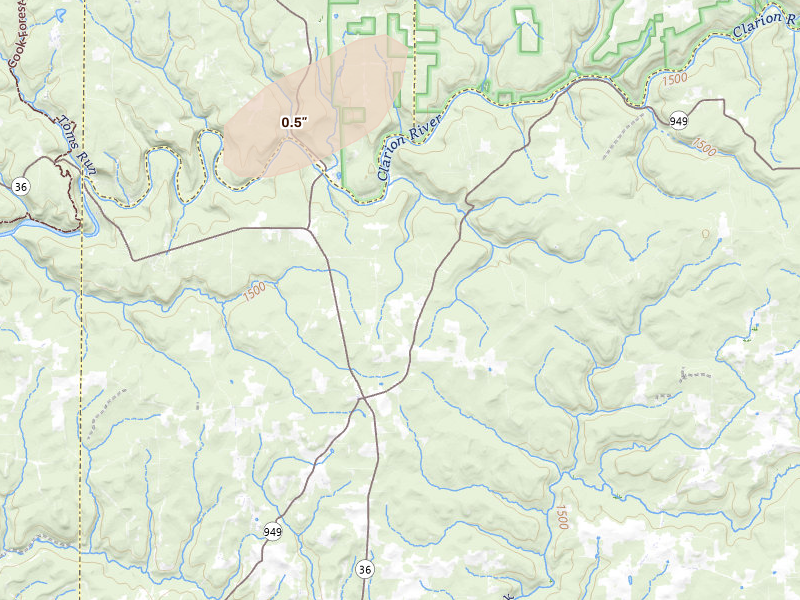
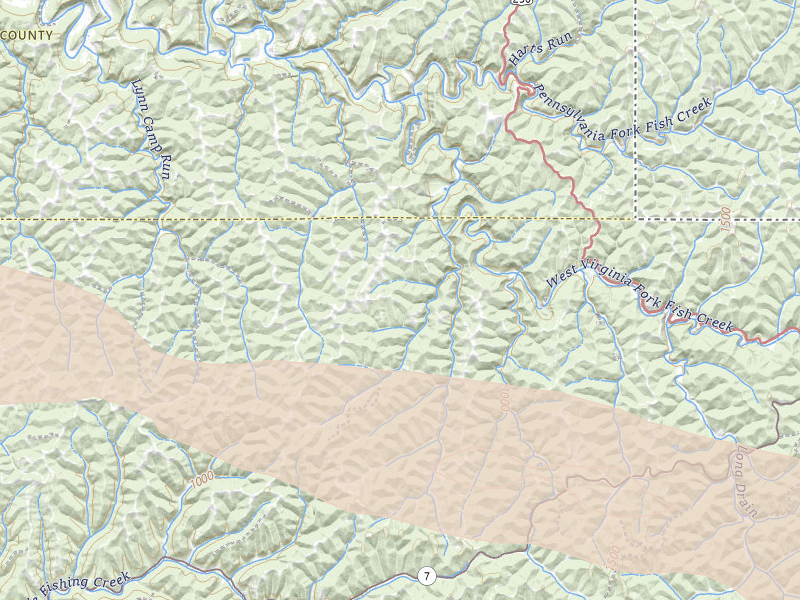
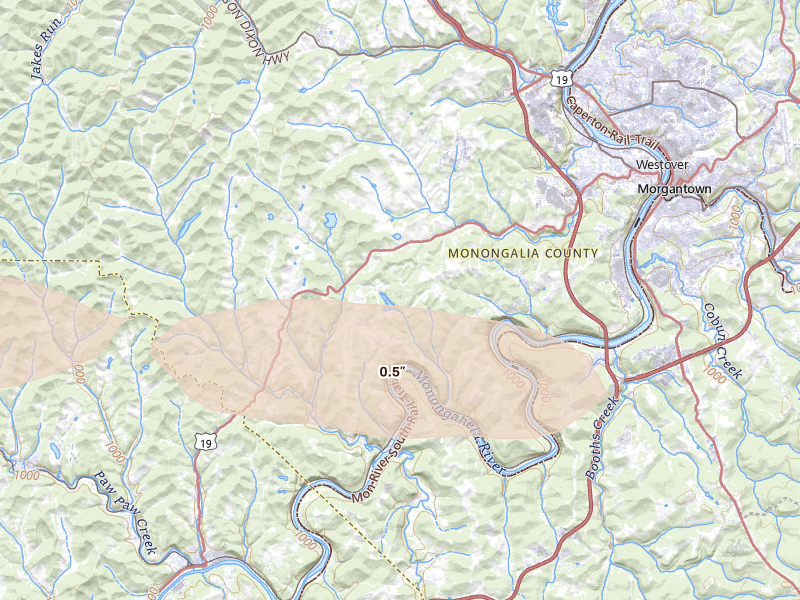
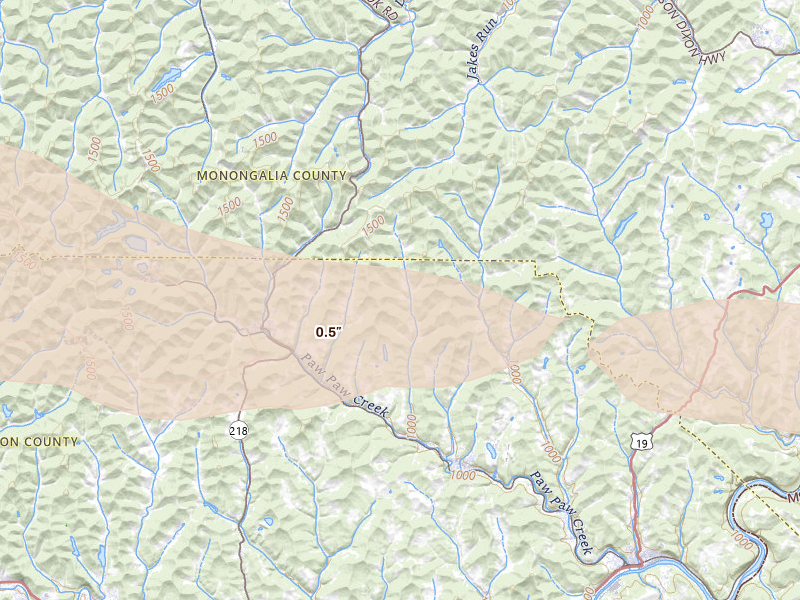
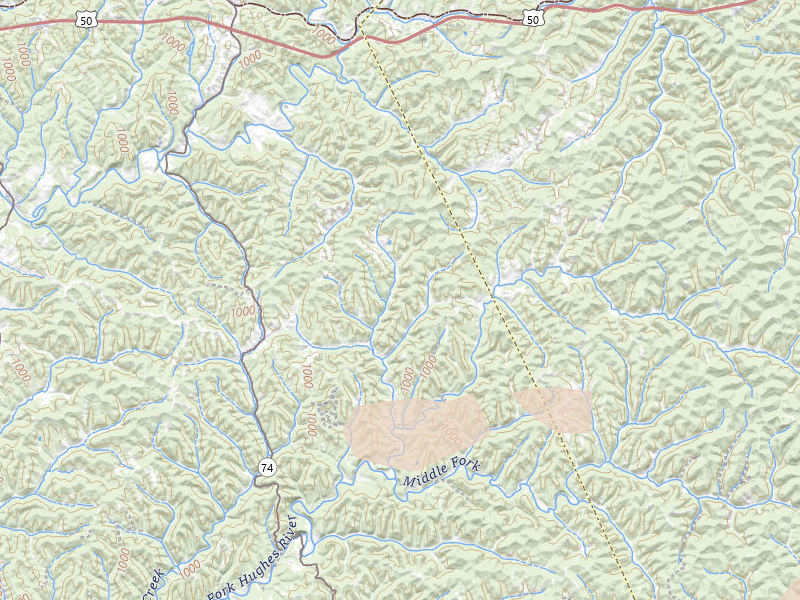
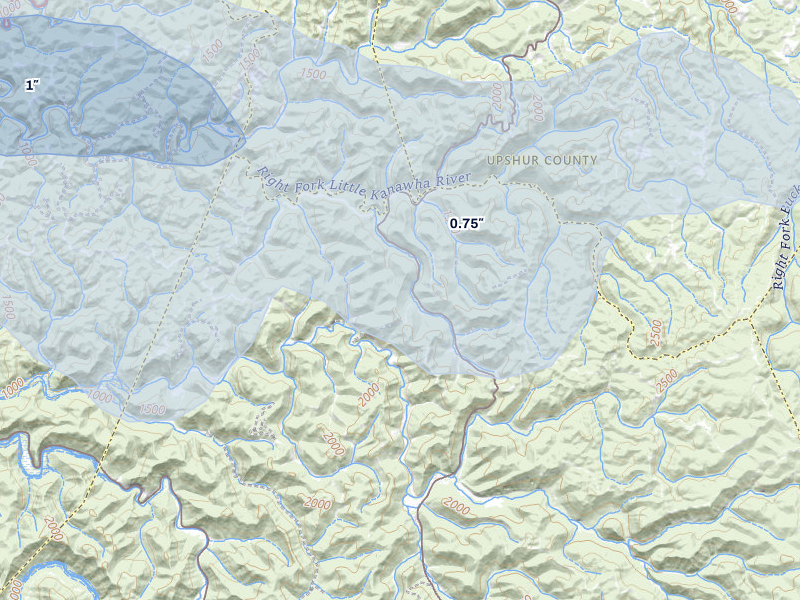
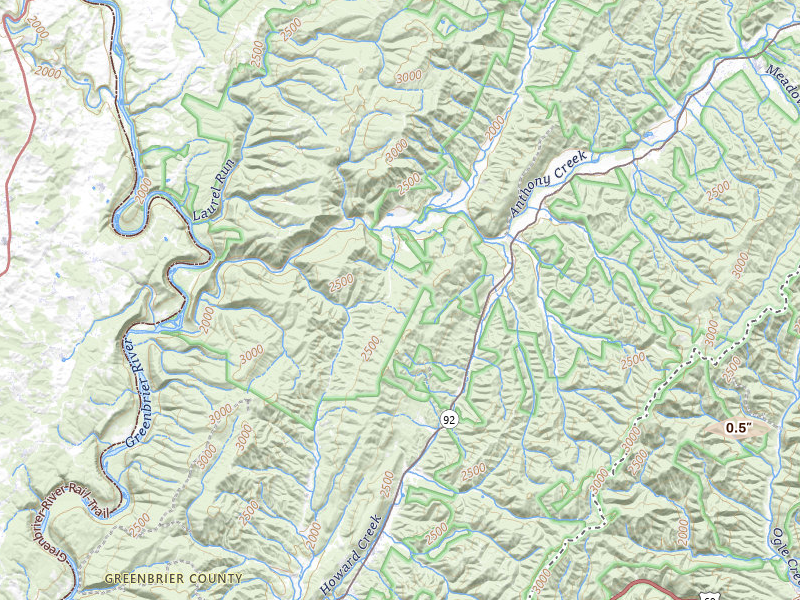
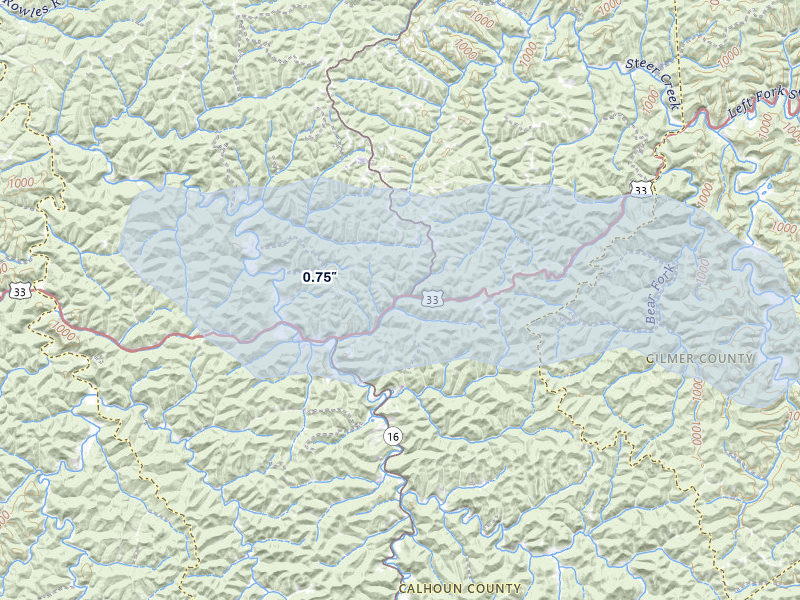
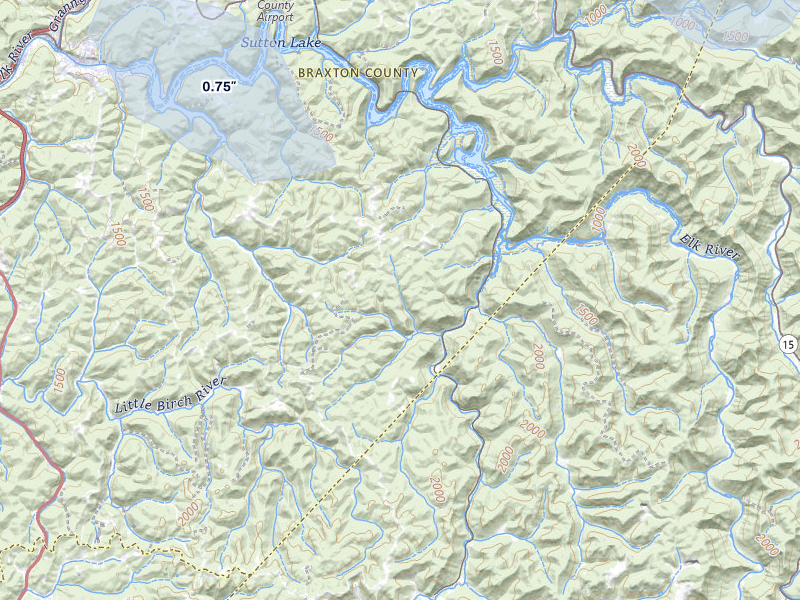
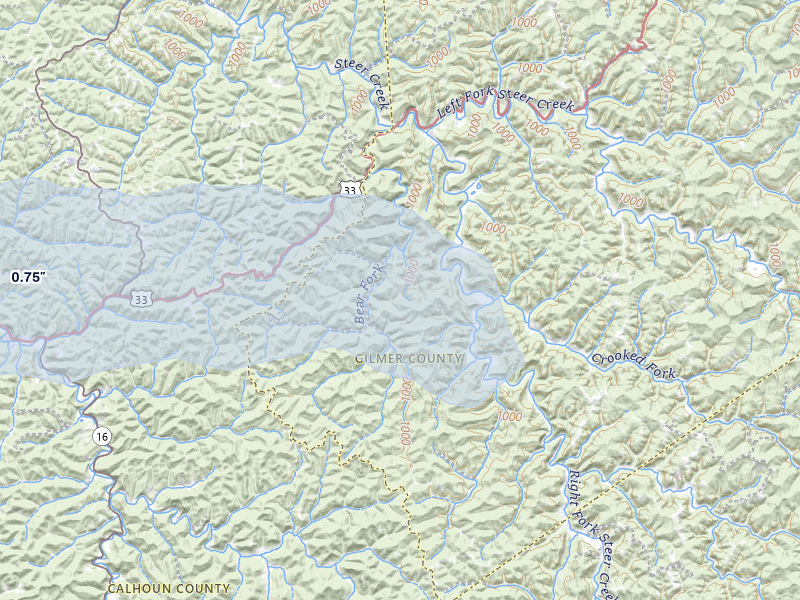
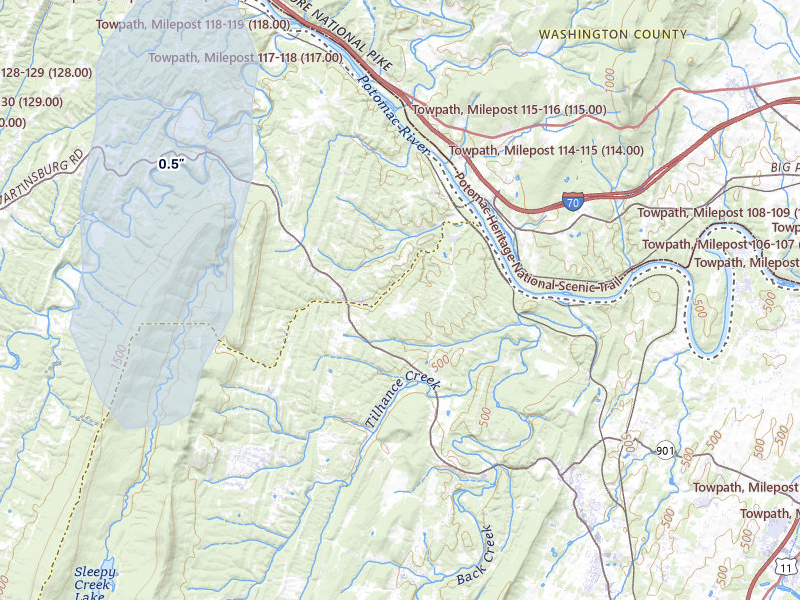
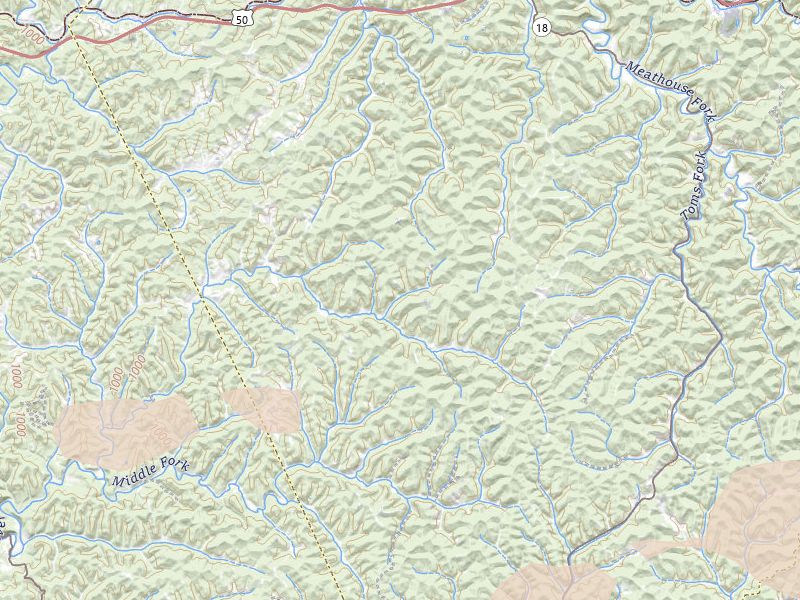
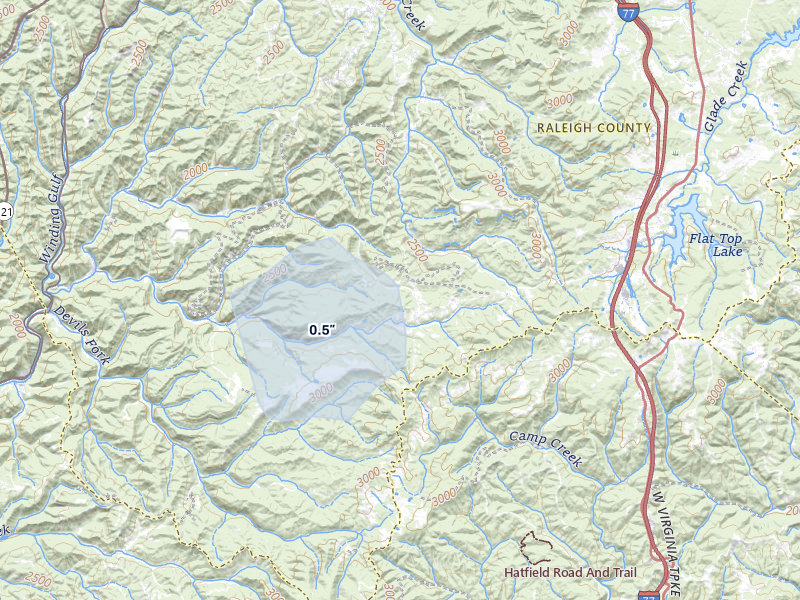
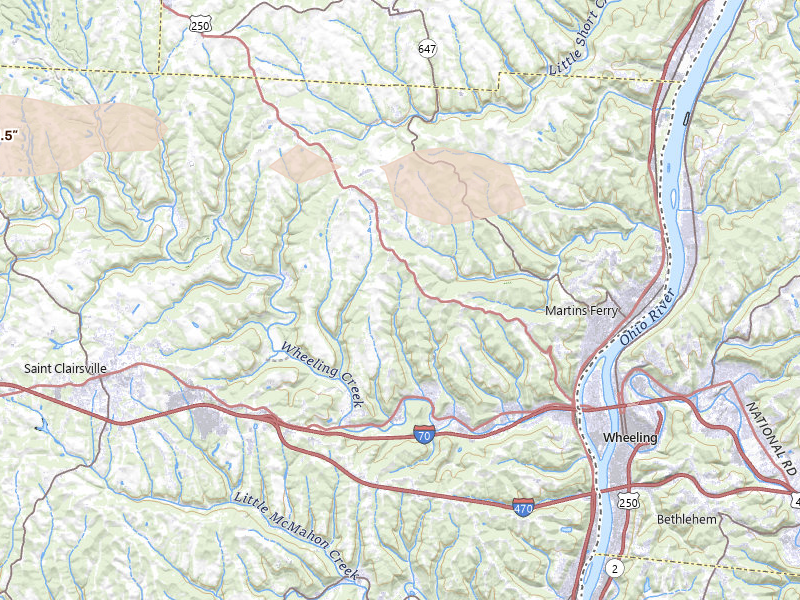
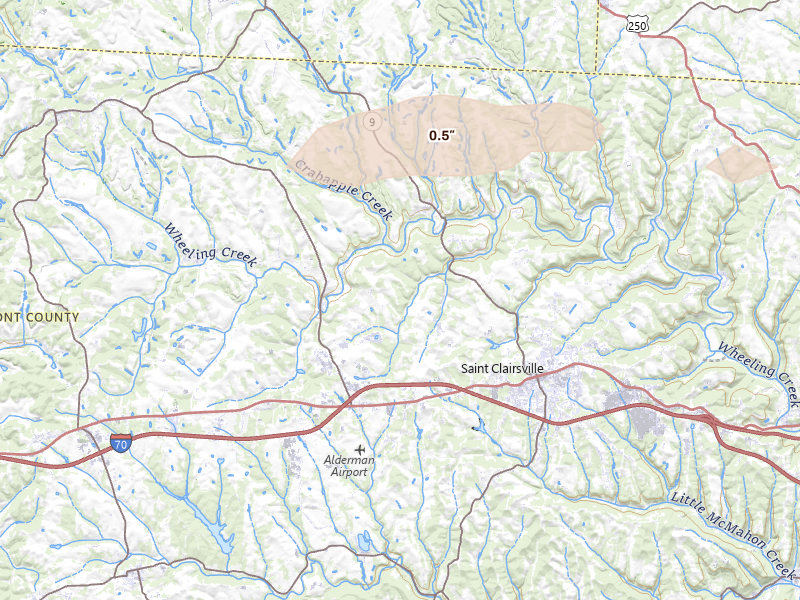
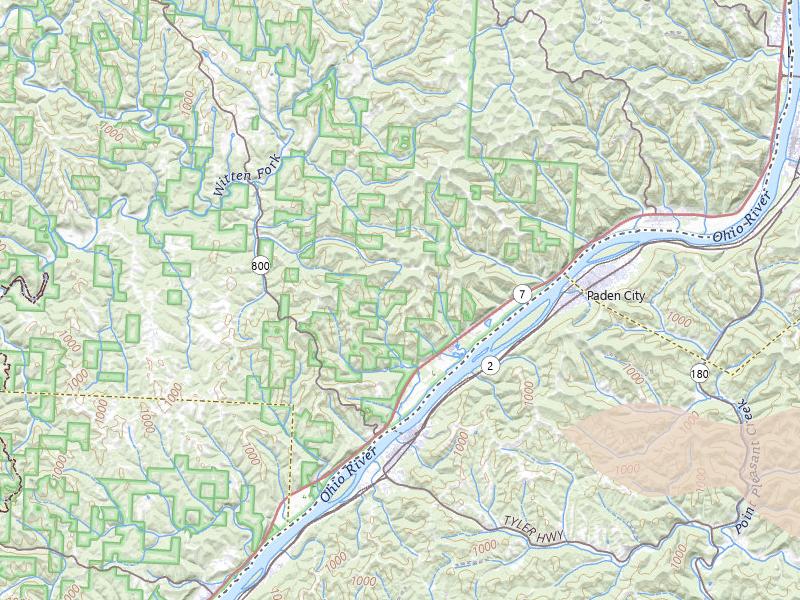
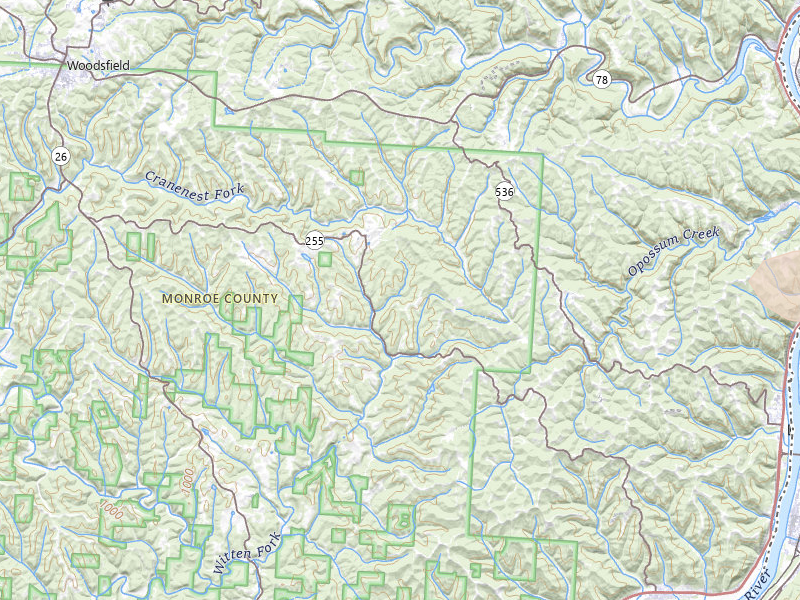
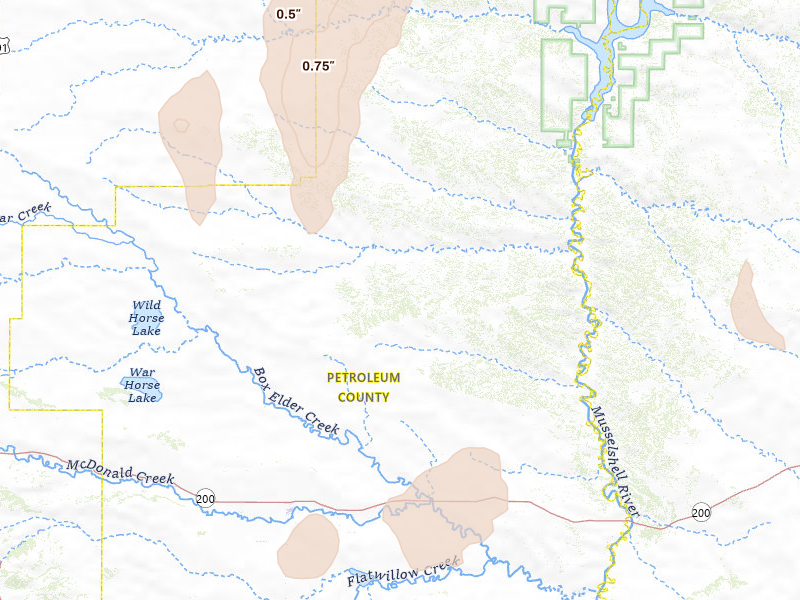
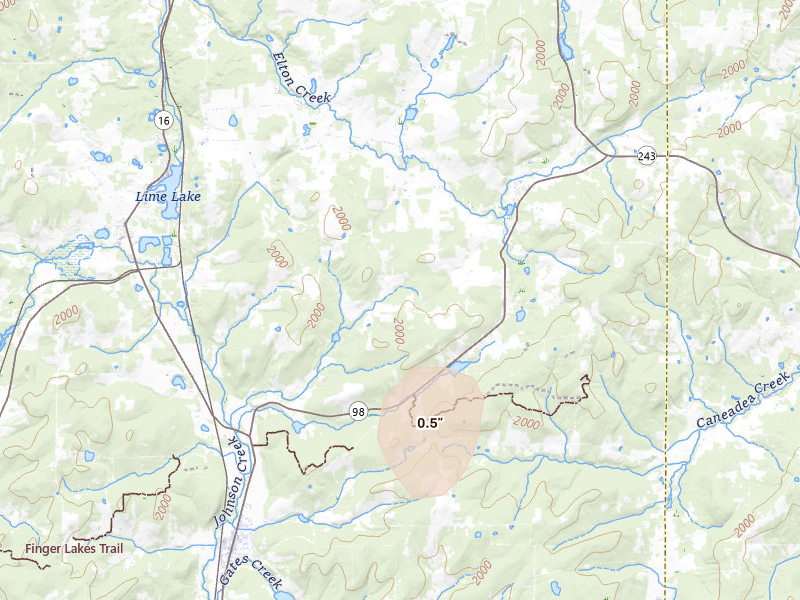
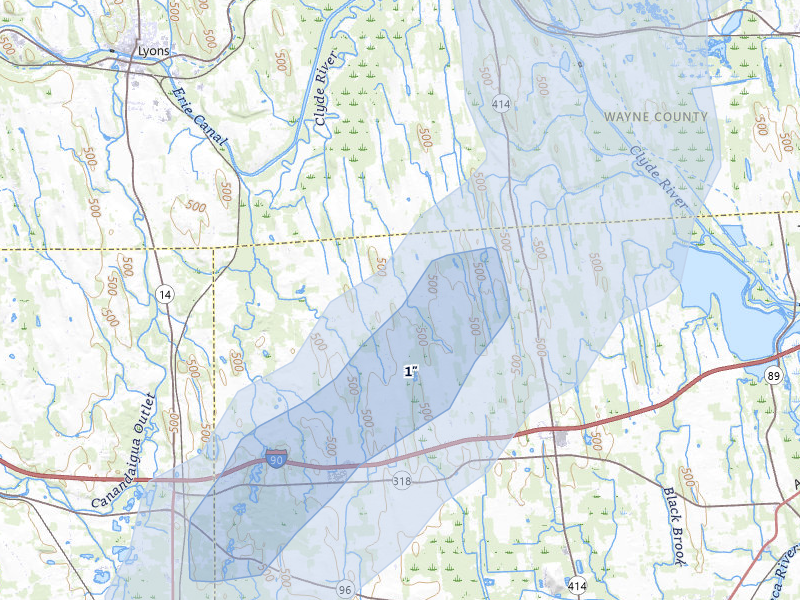
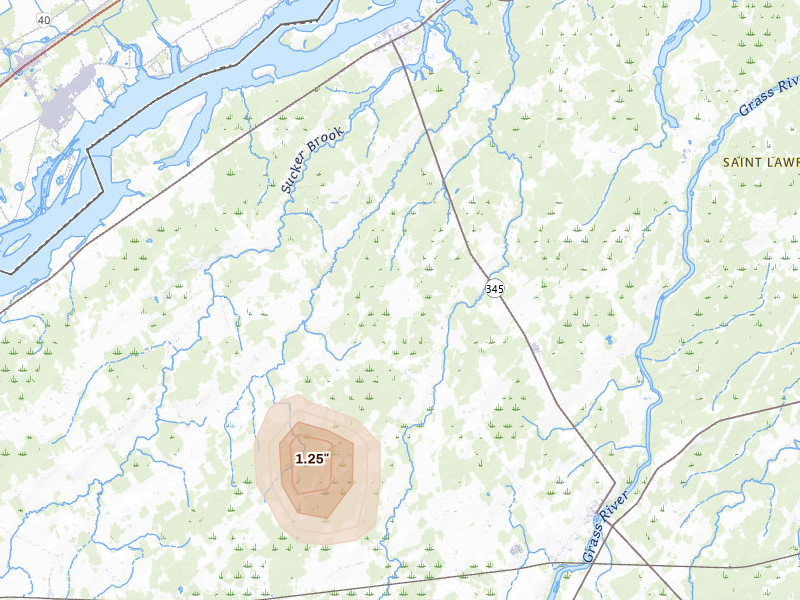
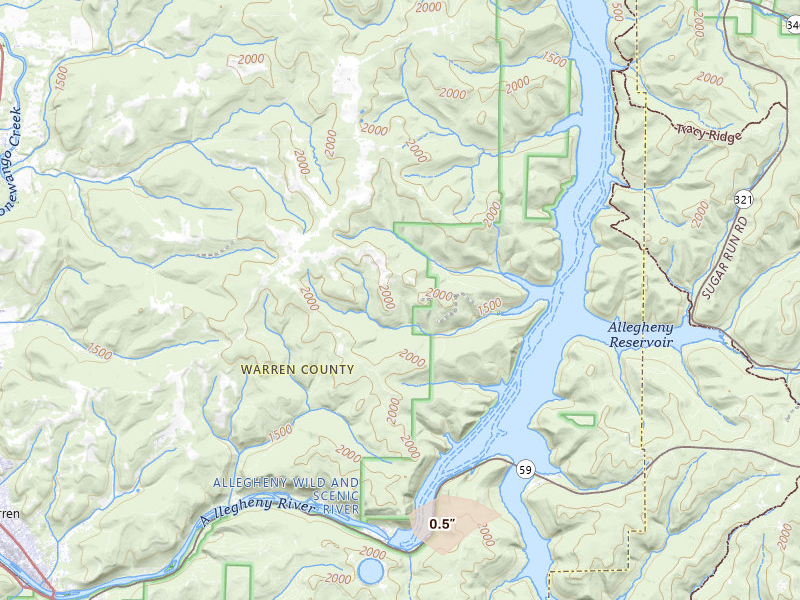
123 cities across 9 states recorded hail on May 13, 2026 — a multi-state outbreak. The peak radar-indicated size reached 1.75" over Wyano, about golf ball.

Download on the App Store

7-day free trial in the iPhone app. No card required to start.

For iPhone. Android coming soon.

Web trial: 7 days free. Card required. $150/month after the trial unless cancelled.

Cities hit 123 across 9 states
Peak hail signal 1.75" ≈ golf ball · Wyano
Homes in footprints 53,565
Ground reports 21

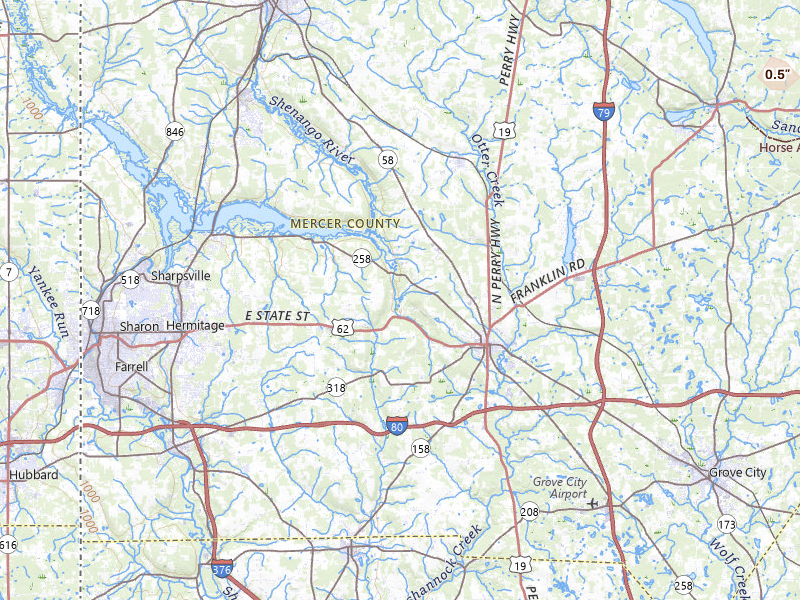
May 13, 2026 · Wyano, PA: 1.75" peak radar signal · NEXRAD + radar-estimated size maps

Mapped cities, by state

Every tracked city with a hail signal on May 13, 2026

123 cities · up to 1.75" · 53,565 mapped homes · noon-to-noon UTC

Every tracked city that recorded hail on this convective day, biggest signal first. Each row opens that city's full storm record.

How to read this day

A storm day on Overview is a convective day — it runs from noon to noon UTC, so late-night hail is grouped with the afternoon storm that spawned it rather than split across two calendar dates. Everything below happened inside the May 13, 2026 convective day. Across those footprints sit roughly 53,565 homes, and 21 ground reports were filed with the National Weather Service.

The cities are listed with the biggest storm first, measured by Overview's severity score. Each row links through to that city's own storm page, where you'll find the radar surfaces, every ground report filed, and the hail footprint drawn on the map.

The counts here are the size of the set of cities Overview tracks — never "every US city" — so read a quiet day as "quiet among the places we watch," not as proof nothing happened elsewhere.

Pennsylvania

50 cities · up to 1.75" · 31,926 mapped homes
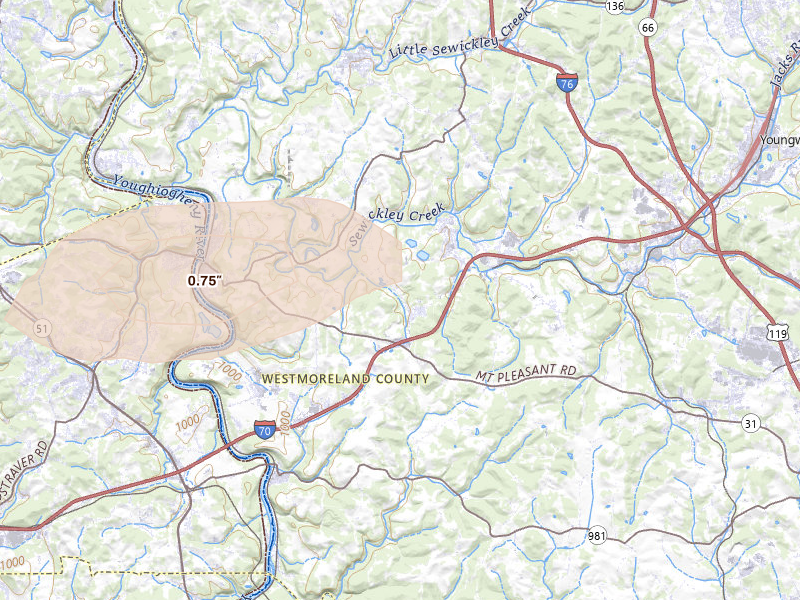
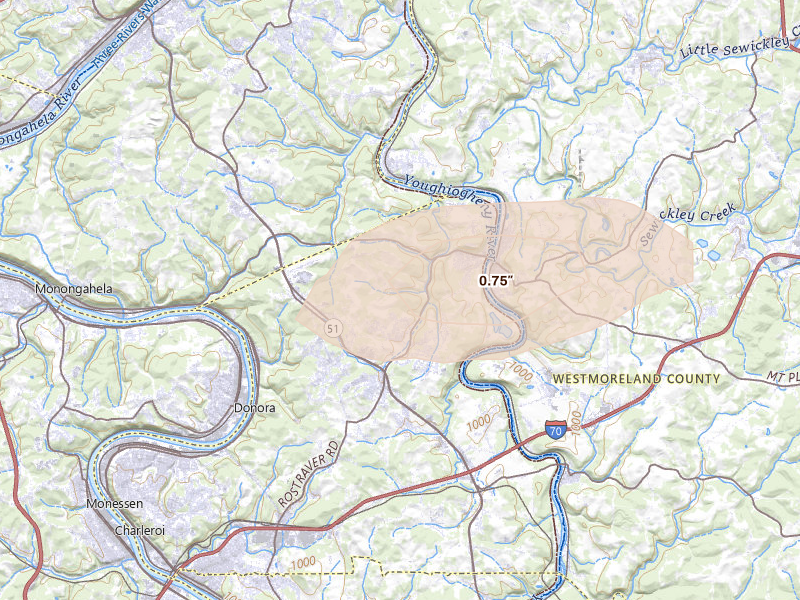
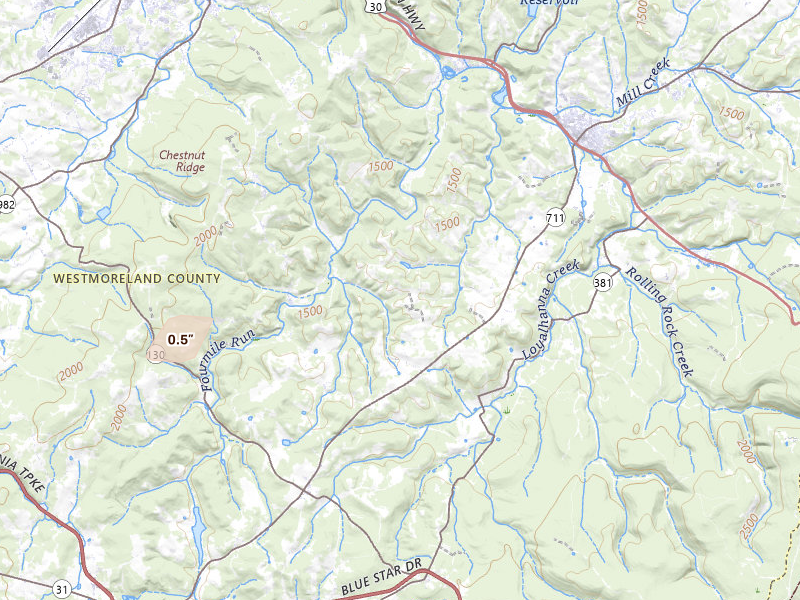
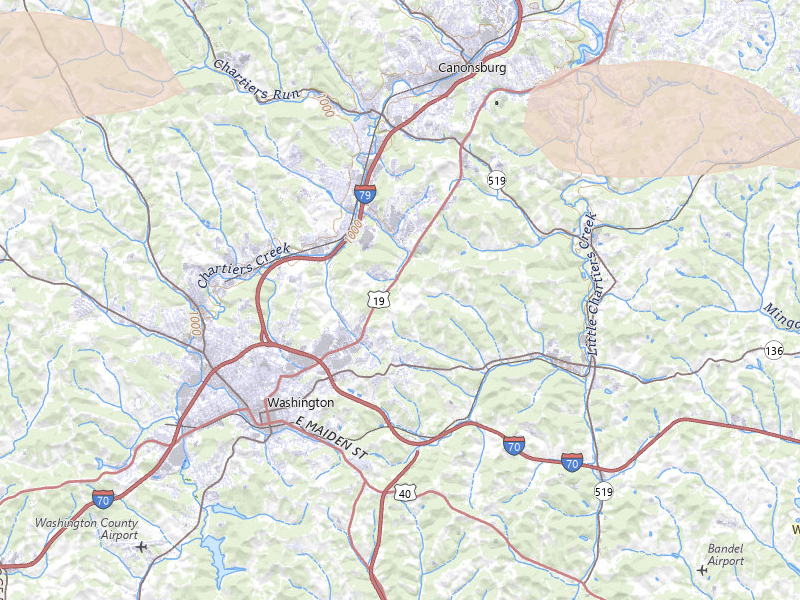
Wyano, PA 4.8 /10 severity
1.75" peak signal 2,774 mapped homes 2 ground reports
Belle Vernon, PA 4.7 /10 severity
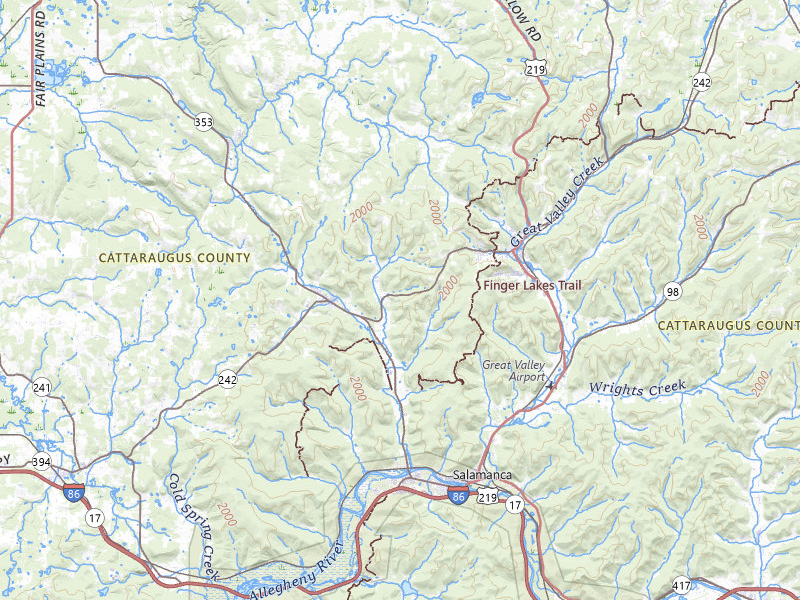
1.75" peak signal 4,646 mapped homes 1 ground report
Eighty Four, PA 4.1 /10 severity
1.5" peak signal 5,078 mapped homes No ground reports
Coal Center, PA 3.9 /10 severity
1.5" peak signal 2,241 mapped homes No ground reports
Acme, PA 3.7 /10 severity
1.5" peak signal 687 mapped homes No ground reports
Hunker, PA 3.6 /10 severity
1.25" peak signal 2,540 mapped homes No ground reports
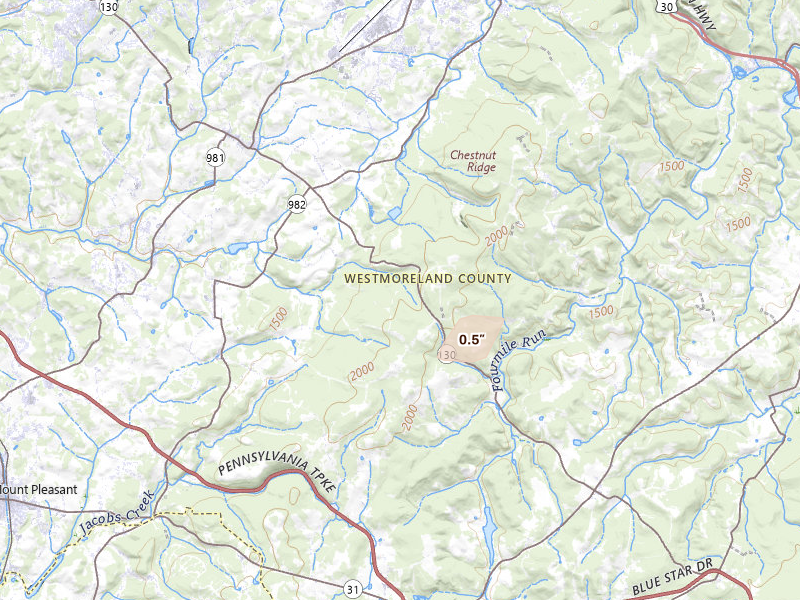
Ligonier, PA 3.6 /10 severity
1.5" peak signal 129 mapped homes 1 ground report
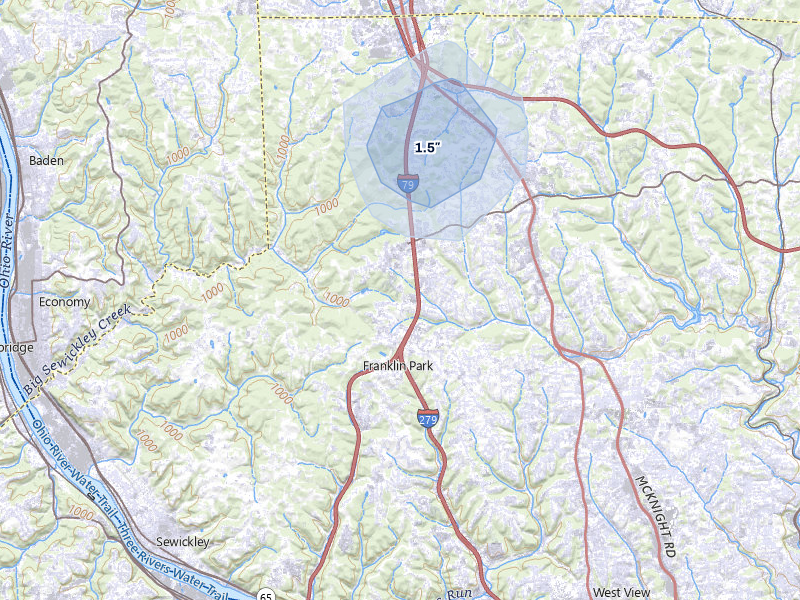
Sewickley, PA 3.6 /10 severity
1.5" peak signal 544 mapped homes No ground reports
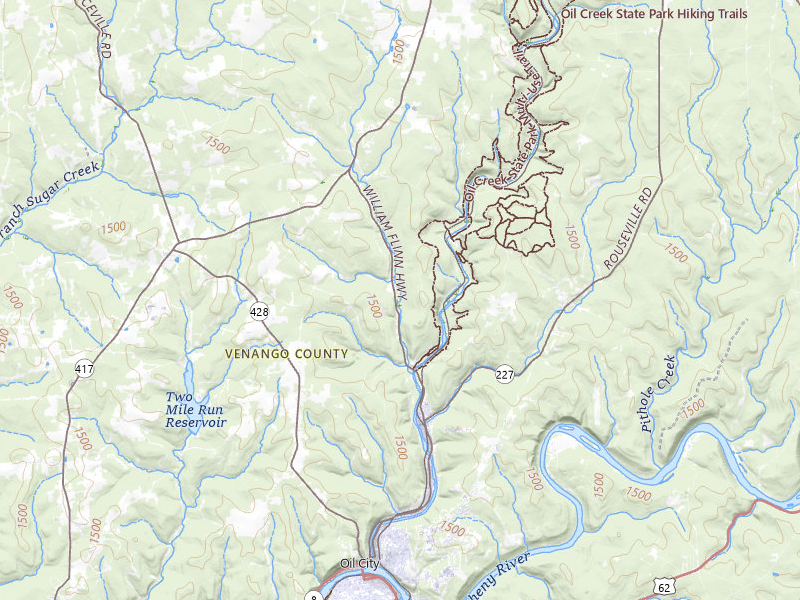
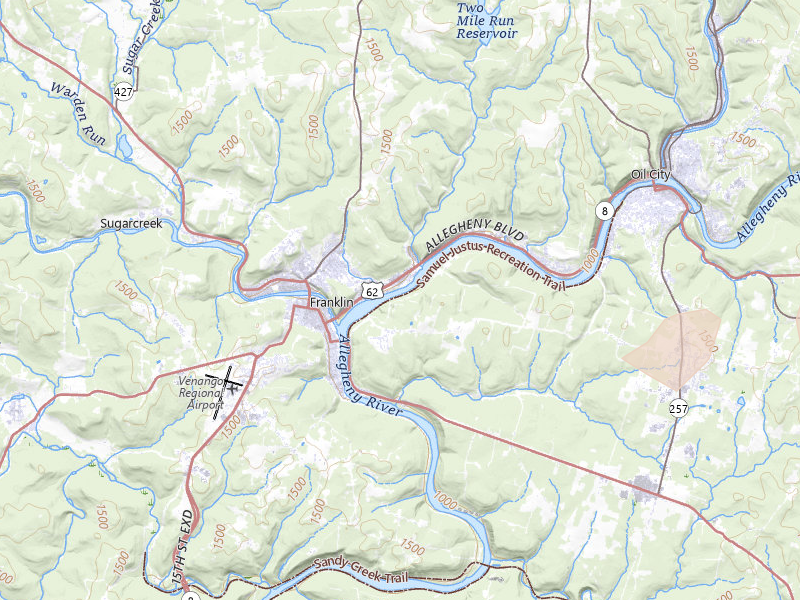
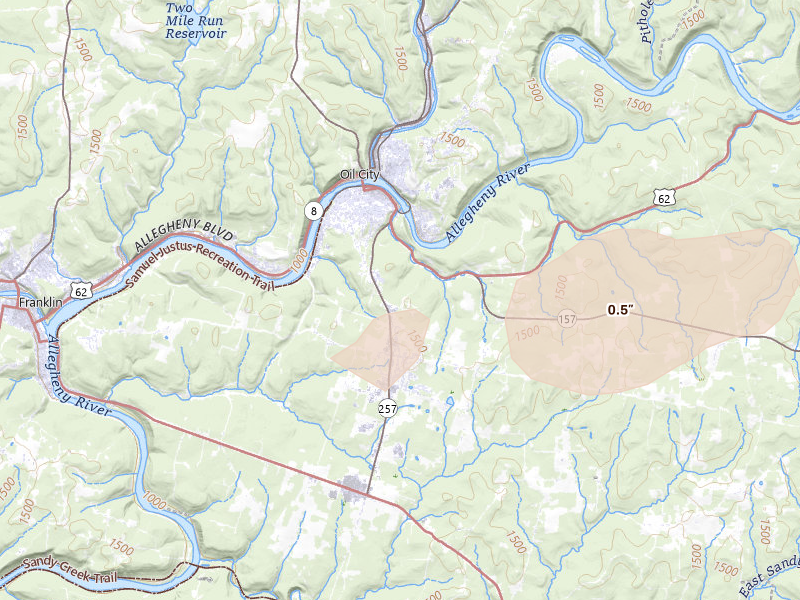
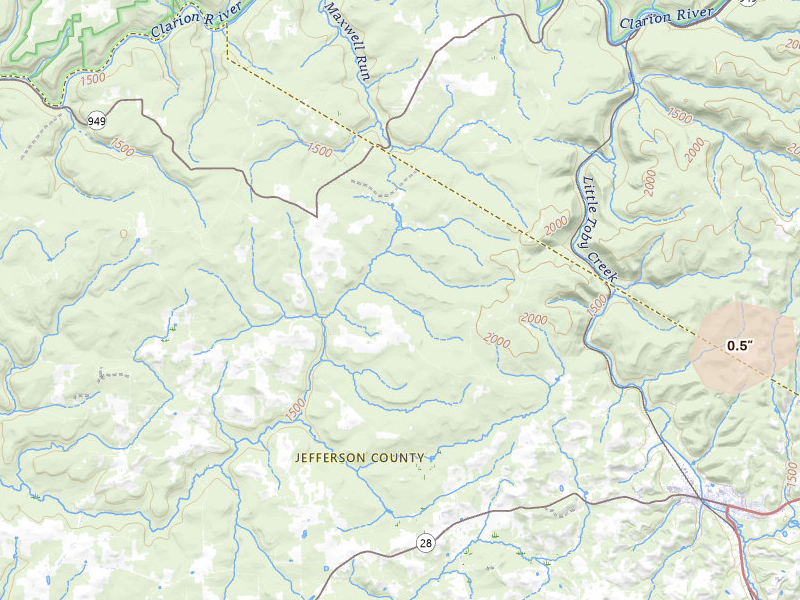
Oil City, PA 3.3 /10 severity
1.25" peak signal 778 mapped homes No ground reports
Avella, PA 3.2 /10 severity
1.25" peak signal 396 mapped homes No ground reports
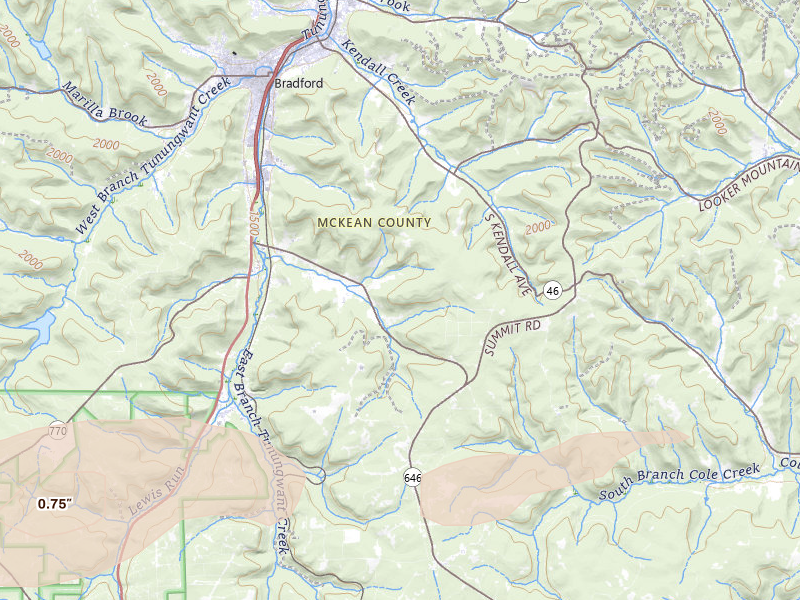
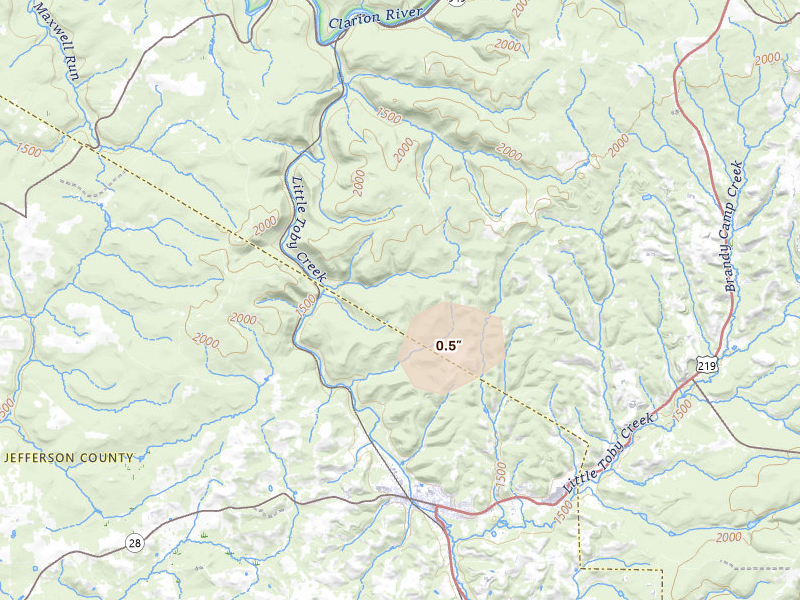
Bradford, PA 3.2 /10 severity
1.25" peak signal 462 mapped homes No ground reports
Franklin, PA 3.2 /10 severity
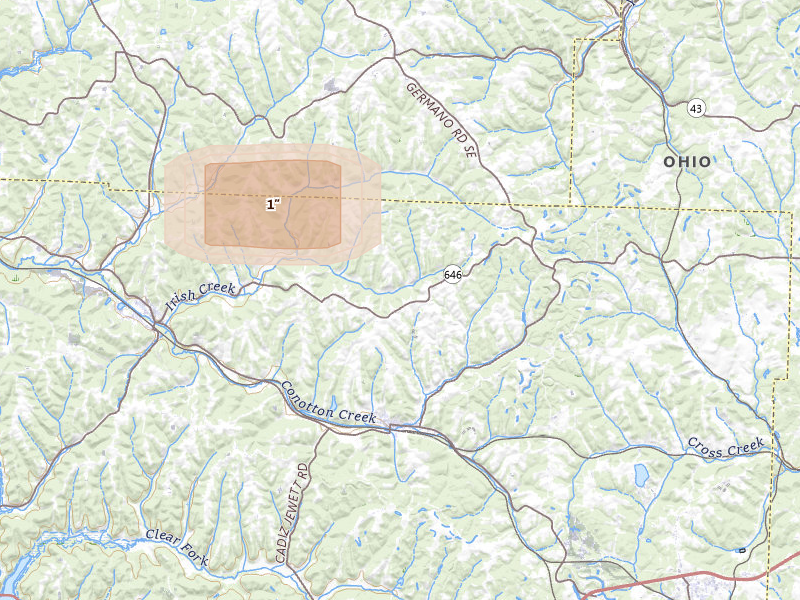
1" peak signal 753 mapped homes 1 ground report
Hickory, PA 3.2 /10 severity
1.25" peak signal 497 mapped homes No ground reports
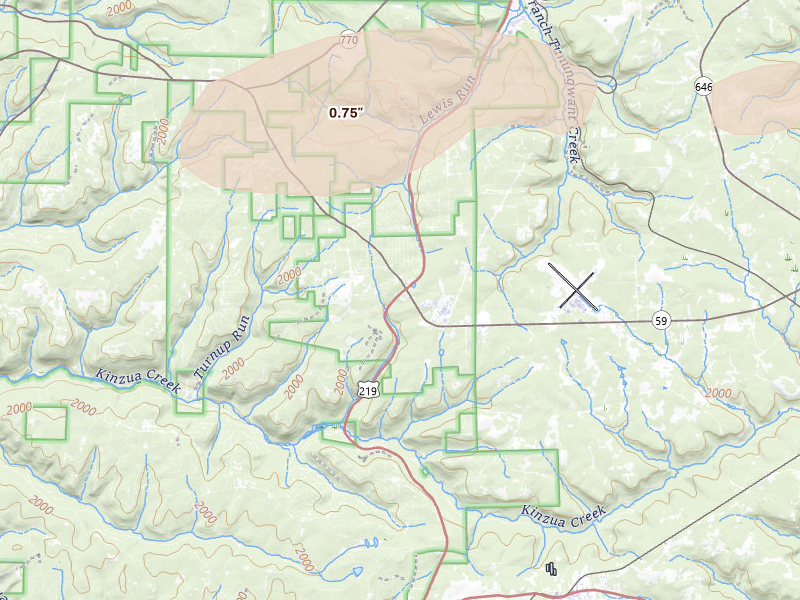
Lewis Run, PA 3.2 /10 severity
1.25" peak signal 357 mapped homes No ground reports
Monongahela, PA 3.2 /10 severity
1" peak signal 3,030 mapped homes No ground reports
Ridgway, PA 3.2 /10 severity
1.25" peak signal 403 mapped homes No ground reports
Seneca, PA 3.2 /10 severity
1.25" peak signal 525 mapped homes No ground reports
Austin, PA 3.1 /10 severity
1.25" peak signal 270 mapped homes No ground reports
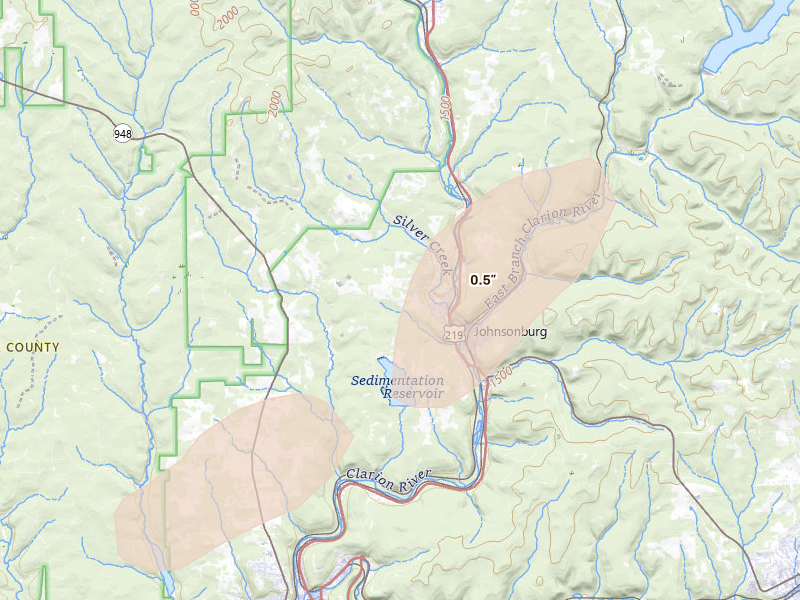
Johnsonburg, PA 3.1 /10 severity
1.25" peak signal 344 mapped homes No ground reports
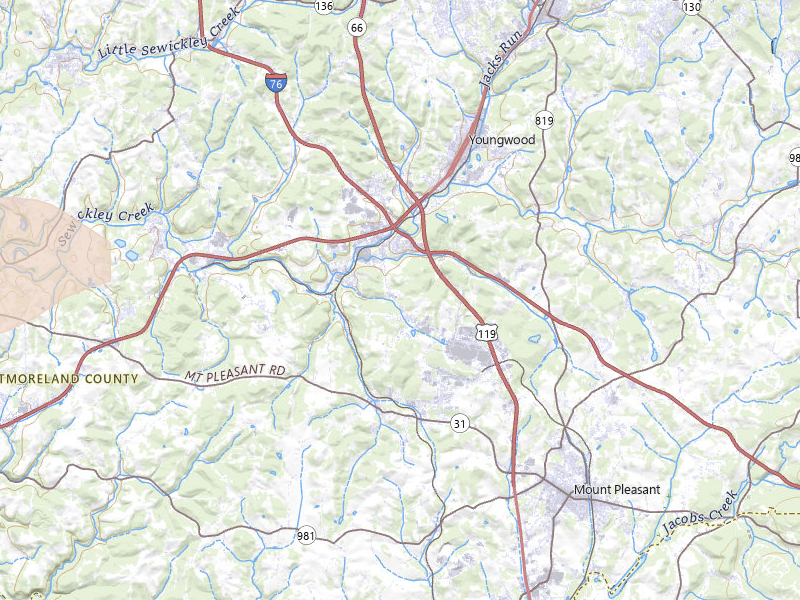
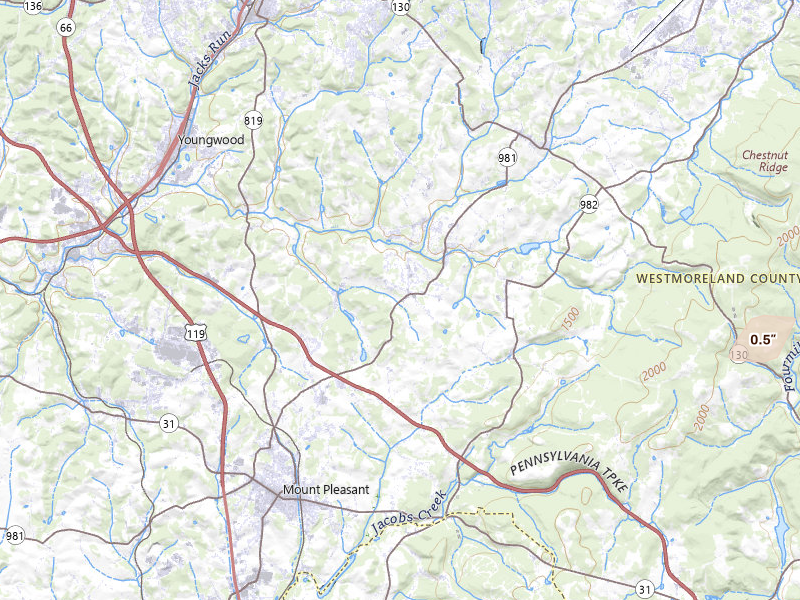
Mount Pleasant, PA 3.1 /10 severity
1.25" peak signal 346 mapped homes No ground reports
Claysville, PA 3.0 /10 severity
1.25" peak signal 210 mapped homes No ground reports
Cambridge Springs, PA 2.8 /10 severity
1" peak signal 454 mapped homes No ground reports
Clarington, PA 2.8 /10 severity
1" peak signal 340 mapped homes No ground reports
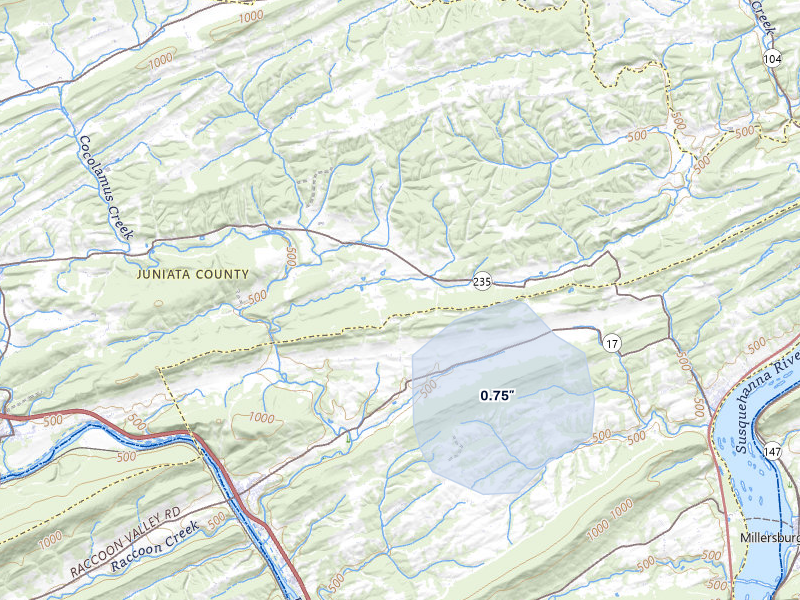
Mc Veytown, PA 2.7 /10 severity
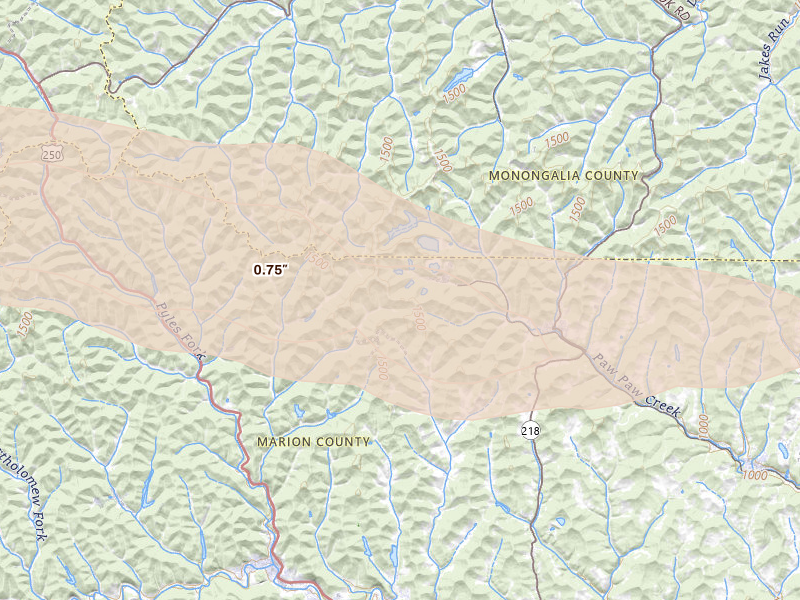
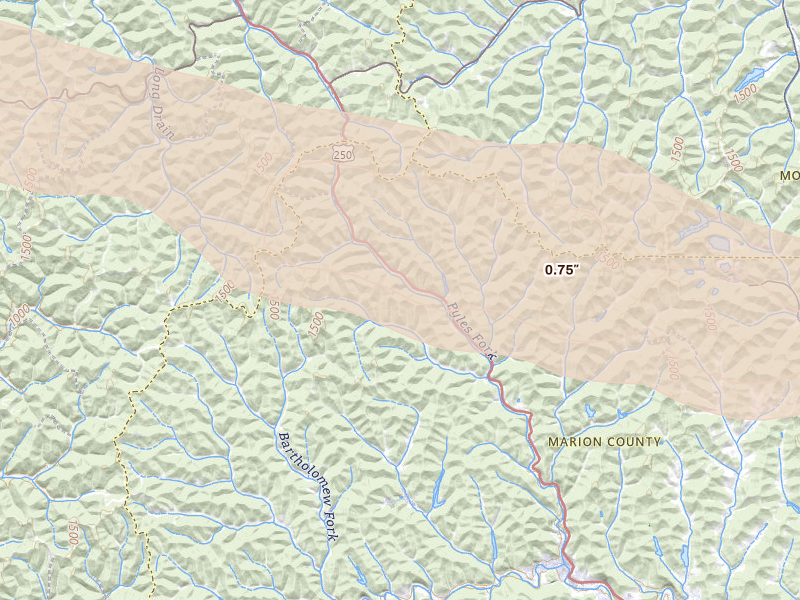
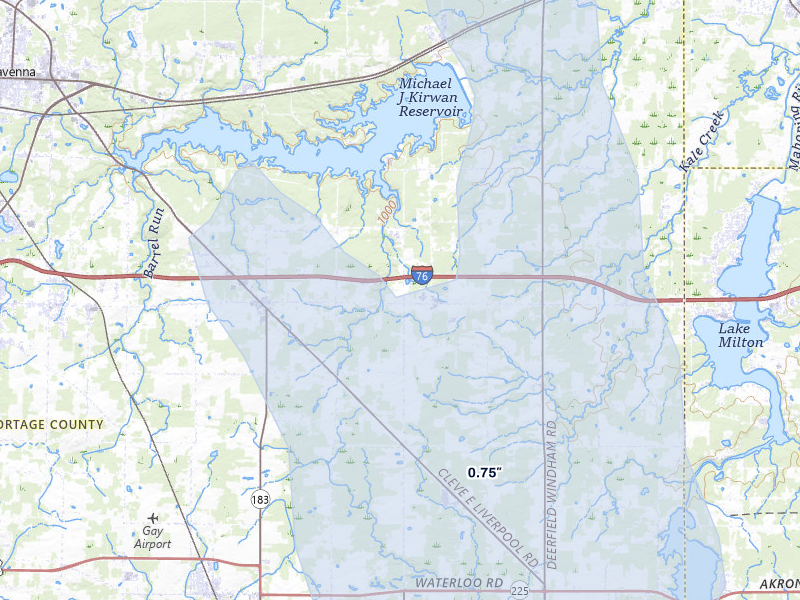
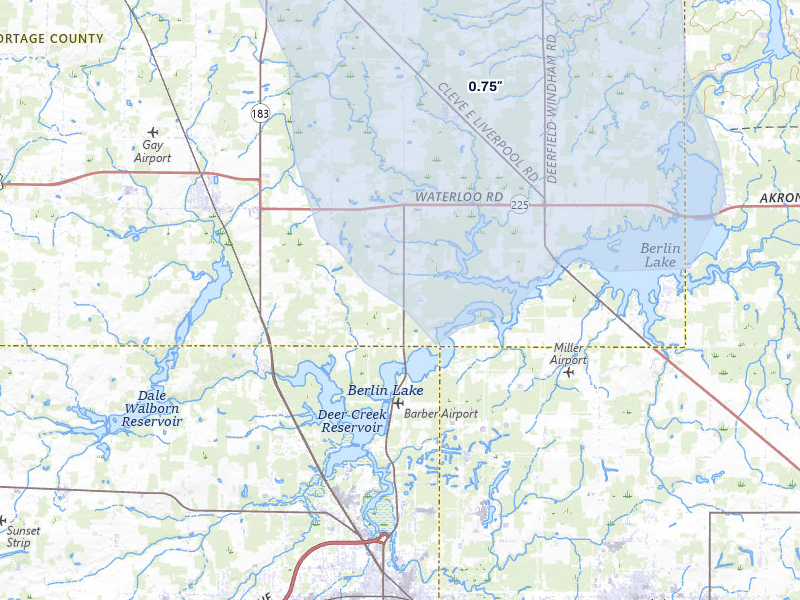
0.75" peak signal 1,322 mapped homes No ground reports
Scenery Hill, PA 2.7 /10 severity
1" peak signal 287 mapped homes No ground reports
Smethport, PA 2.7 /10 severity
1" peak signal 213 mapped homes No ground reports
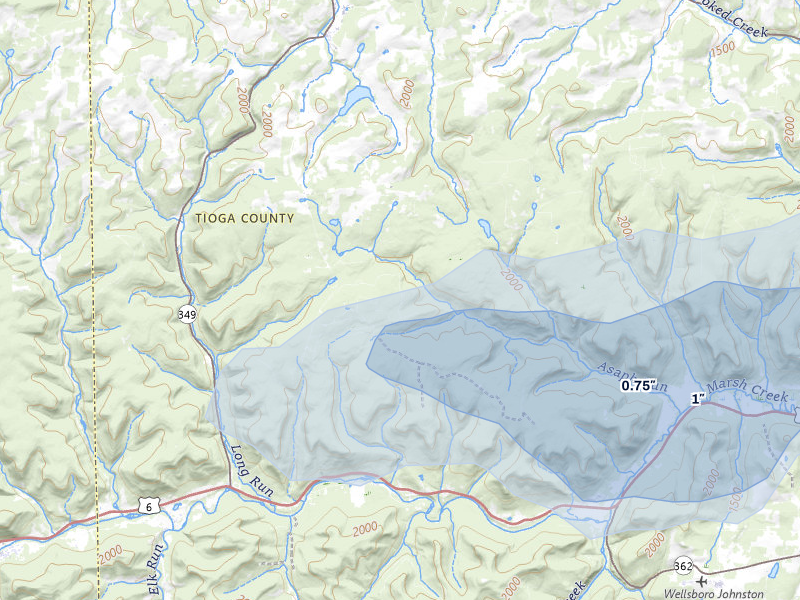
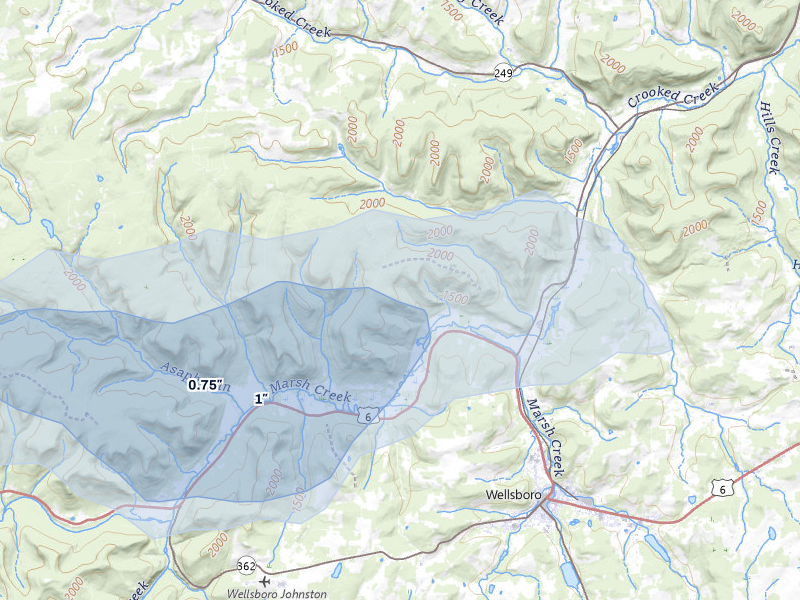
Wellsboro, PA 2.7 /10 severity
1" peak signal 259 mapped homes No ground reports
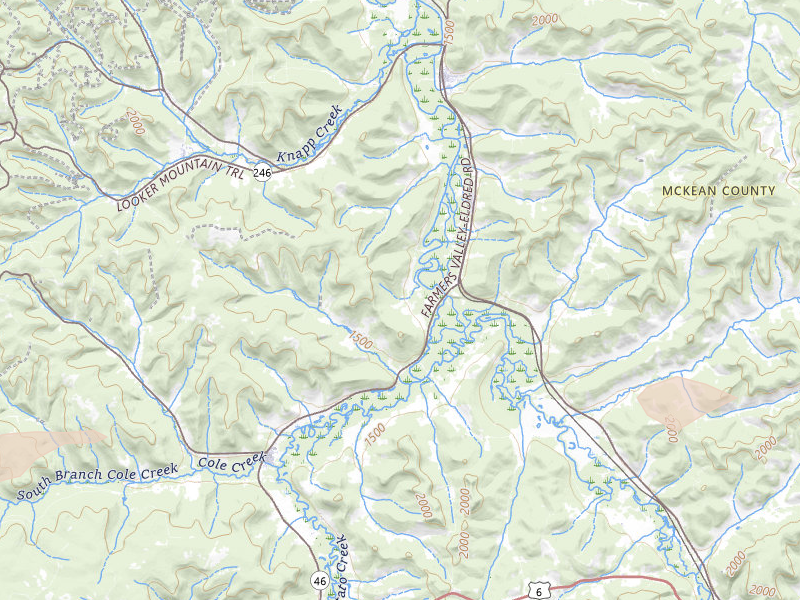
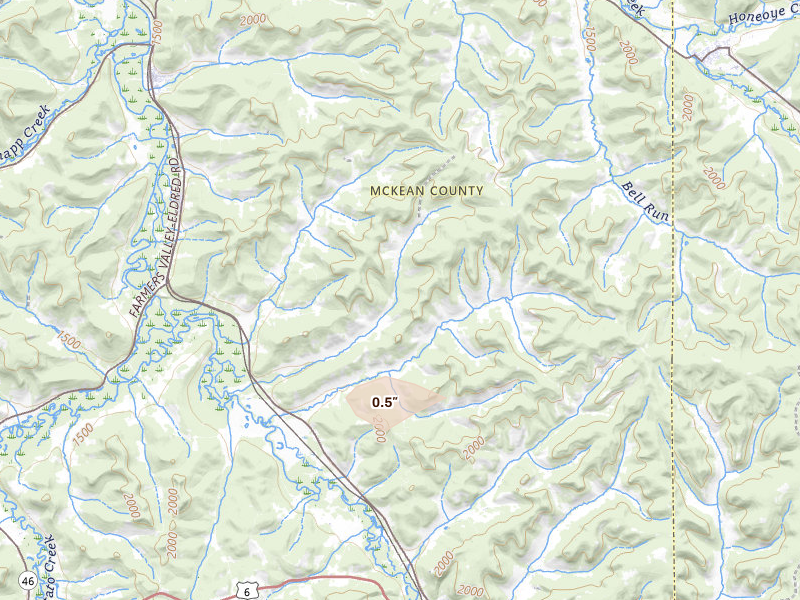
Eldred, PA 2.6 /10 severity
1" peak signal 141 mapped homes No ground reports
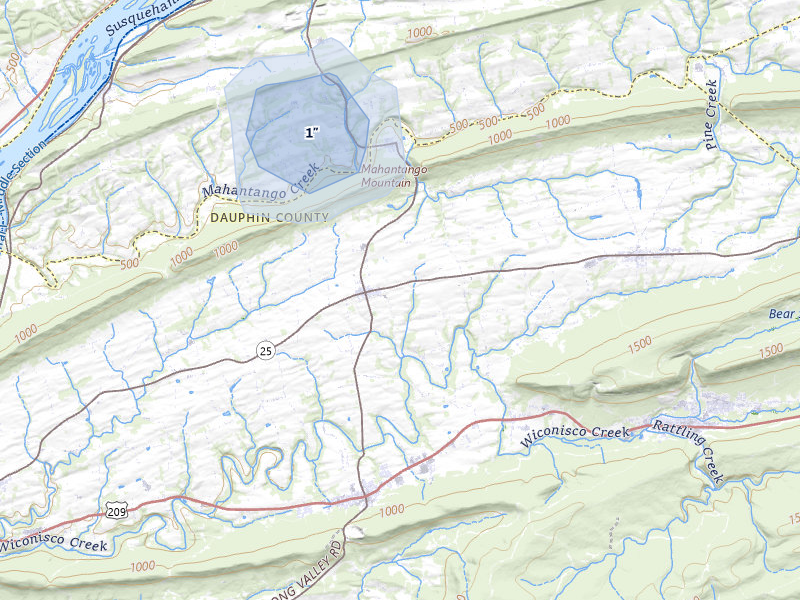
Elizabethville, PA 2.6 /10 severity
1" peak signal 125 mapped homes No ground reports
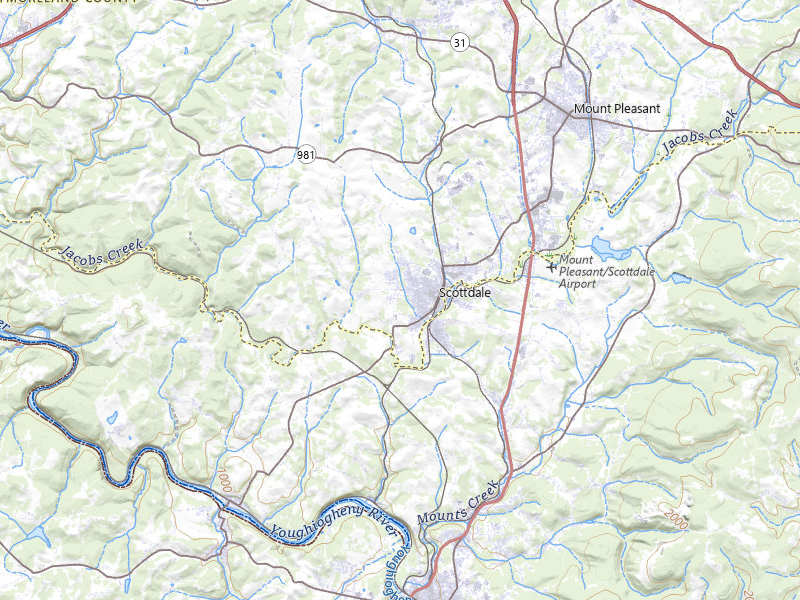
Scottdale, PA 2.6 /10 severity
1" peak signal 169 mapped homes No ground reports
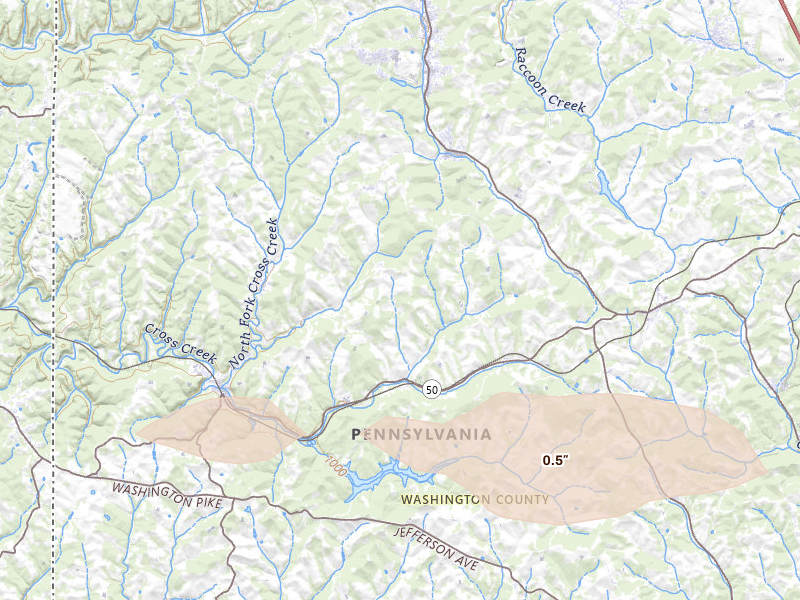
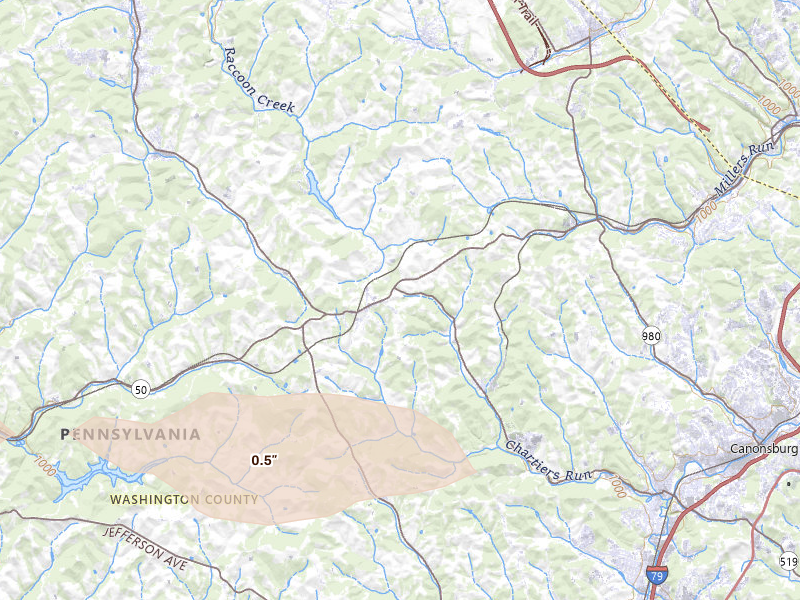
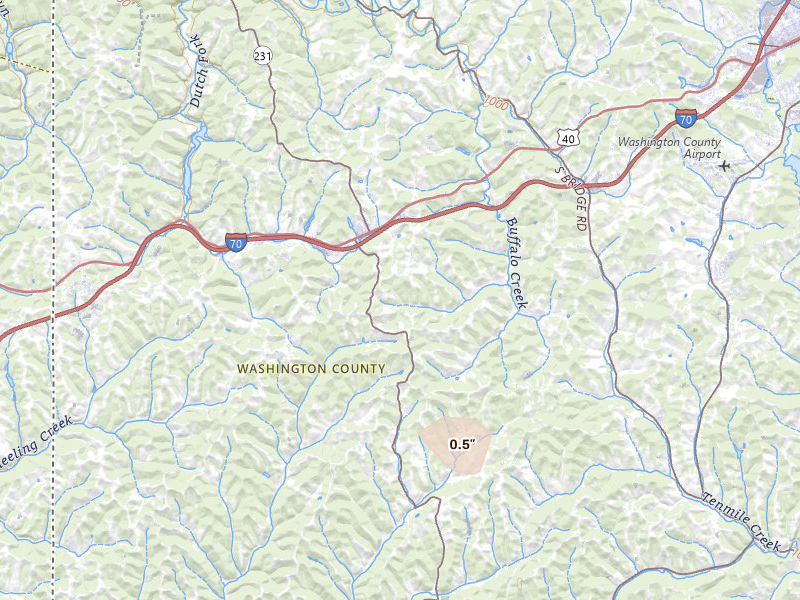
Washington, PA 2.6 /10 severity
1" peak signal 144 mapped homes No ground reports
Brockway, PA 2.5 /10 severity
1" peak signal 79 mapped homes No ground reports
Turtlepoint, PA 2.5 /10 severity
1" peak signal 117 mapped homes No ground reports
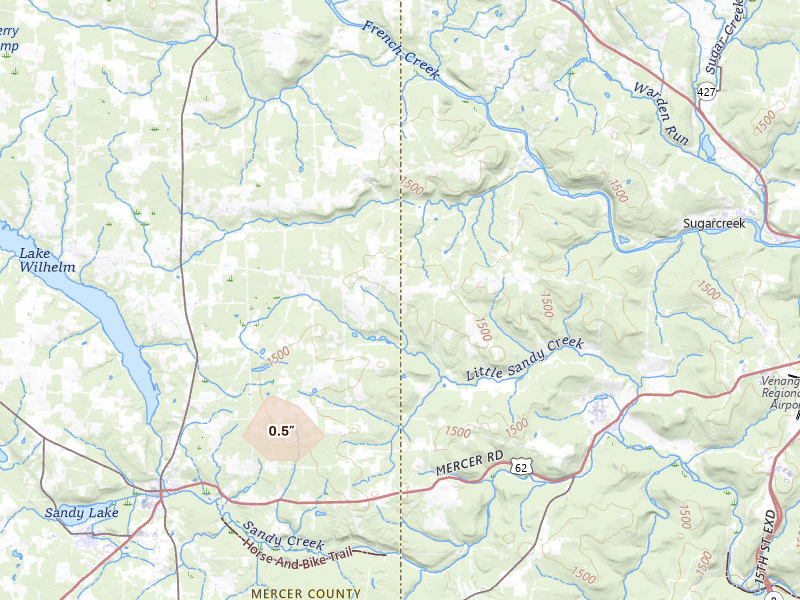
Mercer, PA 2.4 /10 severity
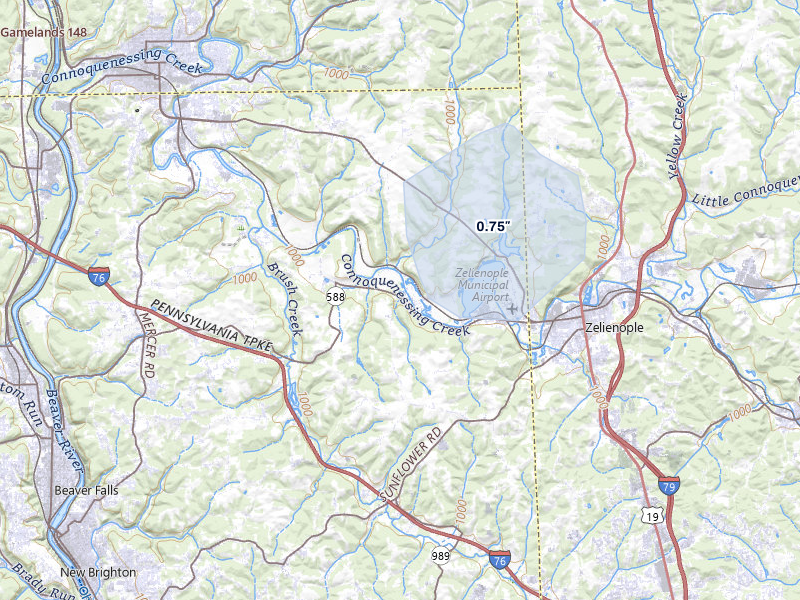
0.75" peak signal 412 mapped homes No ground reports
Sigel, PA 2.4 /10 severity
1" peak signal 53 mapped homes No ground reports
Fombell, PA 2.3 /10 severity
0.75" peak signal 242 mapped homes No ground reports
Clarendon, PA 2.1 /10 severity
1" peak signal 18 mapped homes No ground reports
Fairmount City, PA 2.1 /10 severity
0.75" peak signal 96 mapped homes No ground reports
Russell, PA 2.1 /10 severity
1" peak signal 18 mapped homes No ground reports
Summerville, PA 2.1 /10 severity
0.75" peak signal 78 mapped homes No ground reports
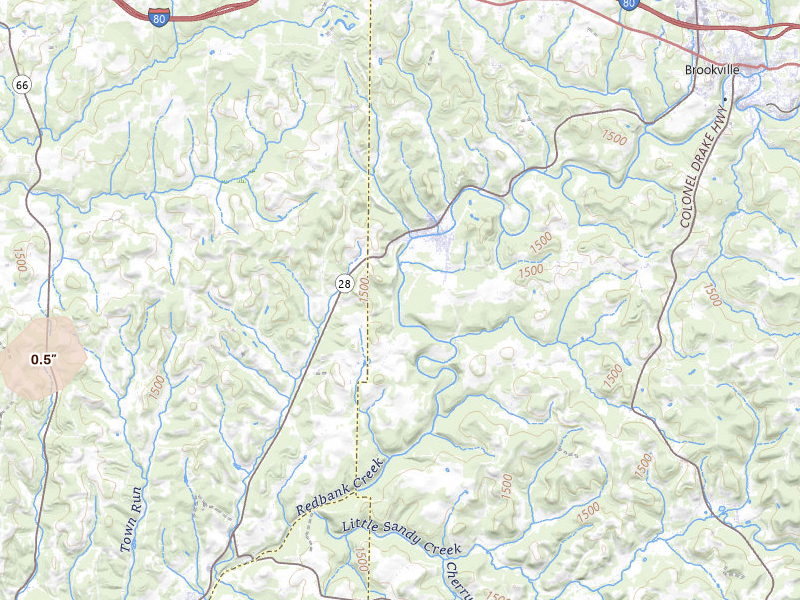
Brookville, PA 1.9 /10 severity
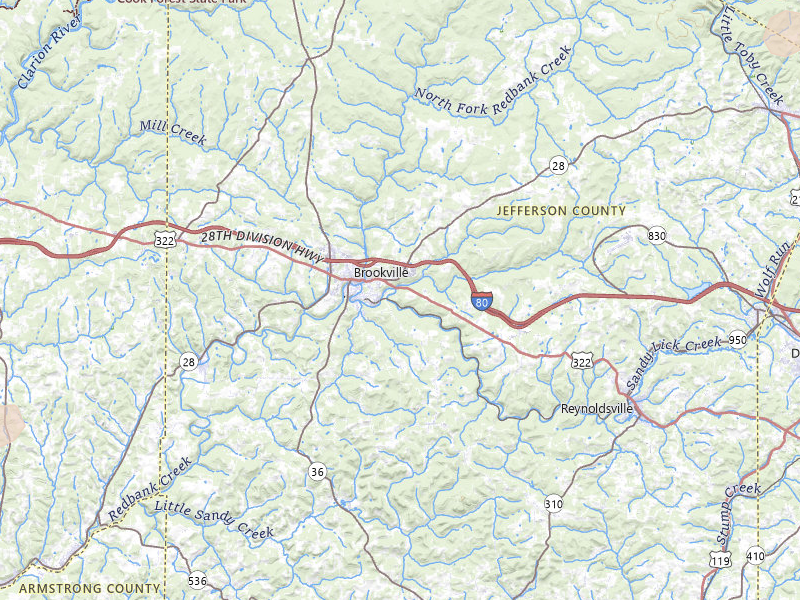
0.75" peak signal 33 mapped homes No ground reports
Emporium, PA 1.9 /10 severity
0.75" peak signal 31 mapped homes No ground reports
Millerstown, PA 1.9 /10 severity
0.75" peak signal 32 mapped homes No ground reports
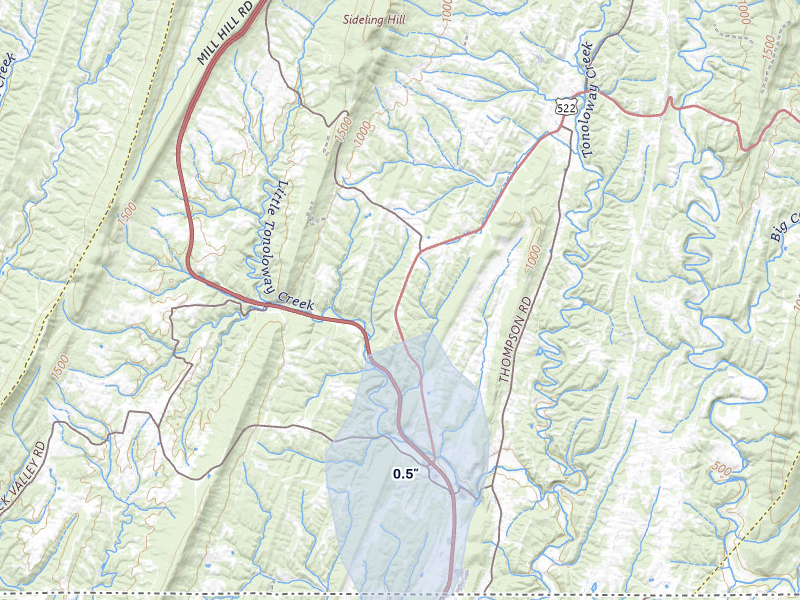
Warfordsburg, PA 1.8 /10 severity
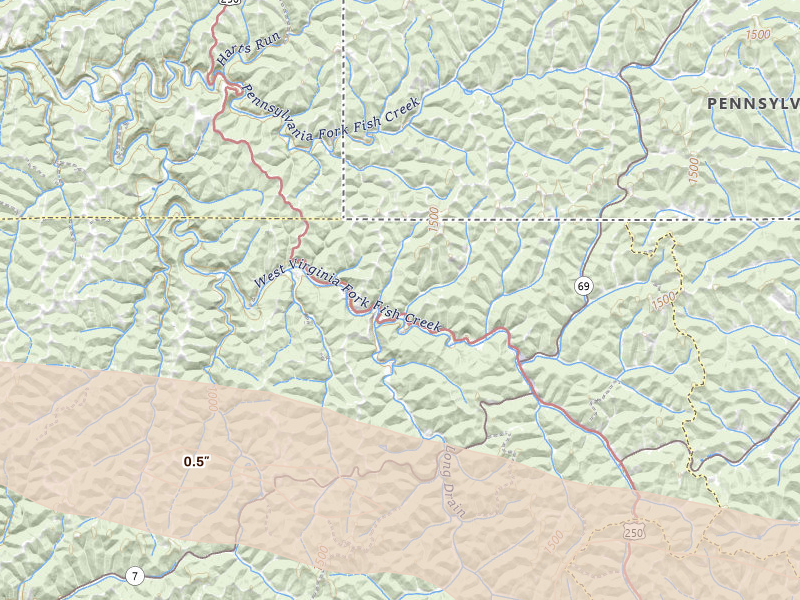
0.5" peak signal 115 mapped homes No ground reports
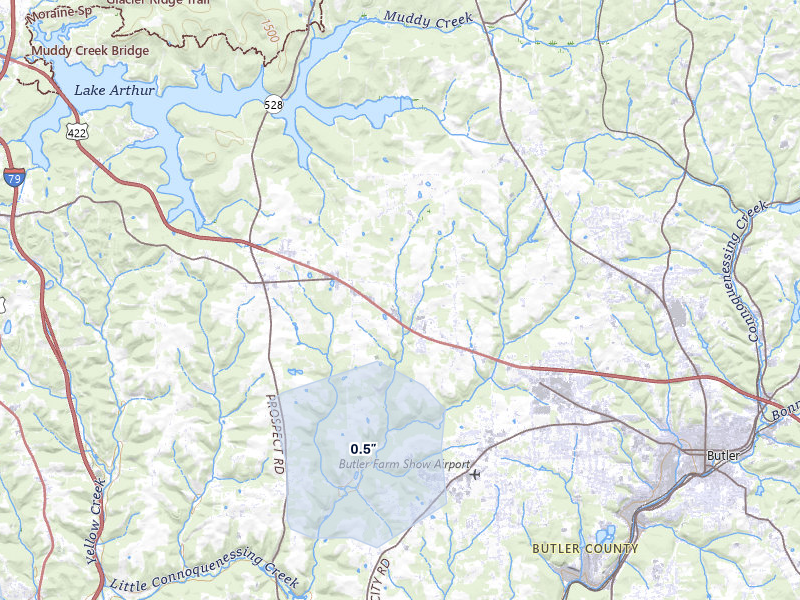
Butler, PA 1.7 /10 severity
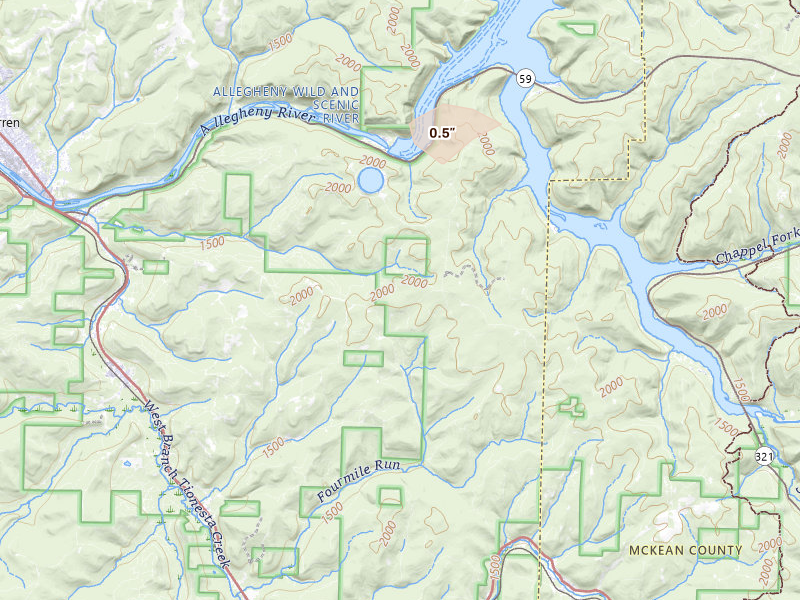
0.5" peak signal 92 mapped homes No ground reports
Westfield, PA 1.7 /10 severity
1" peak signal 2 mapped homes No ground reports
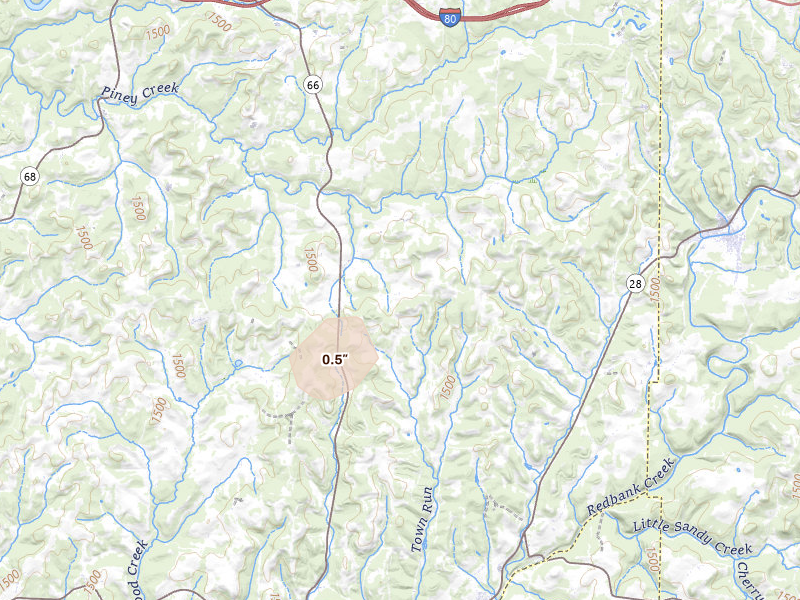
Utica, PA 1.5 /10 severity
0.5" peak signal 29 mapped homes No ground reports
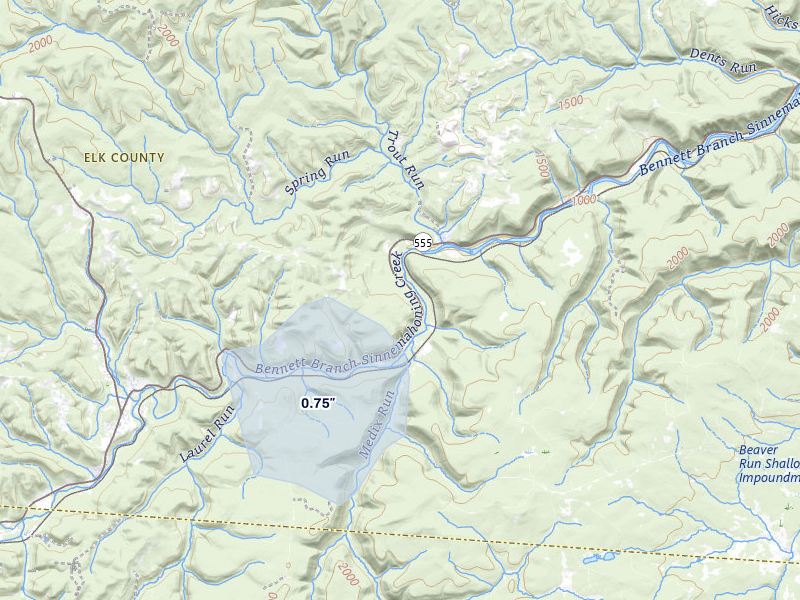
Weedville, PA 1.4 /10 severity
0.75" peak signal 2 mapped homes No ground reports
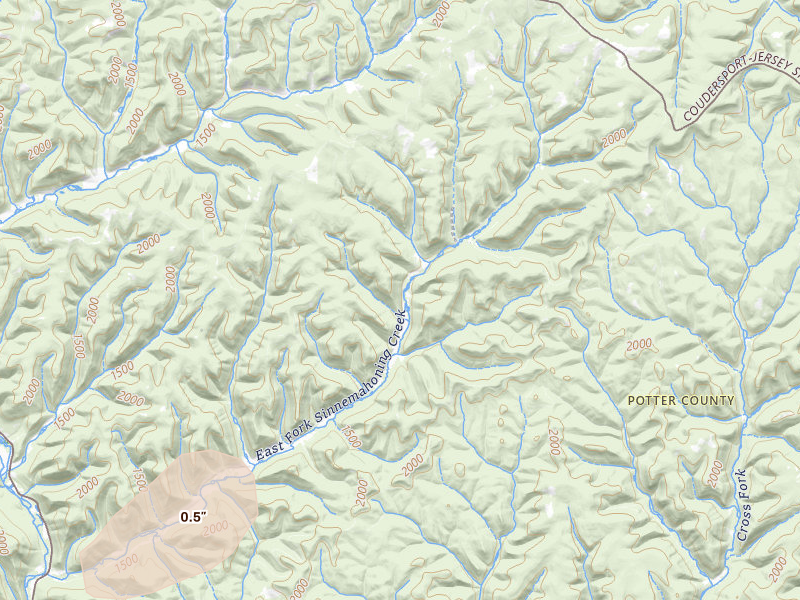
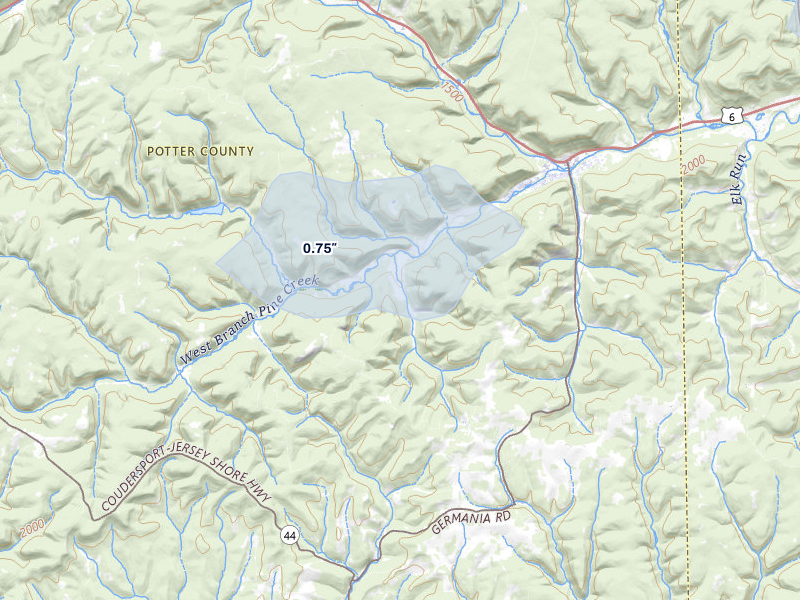
Galeton, PA 1.3 /10 severity
0.75" peak signal 1 mapped homes No ground reports
North Bend, PA 1.3 /10 severity
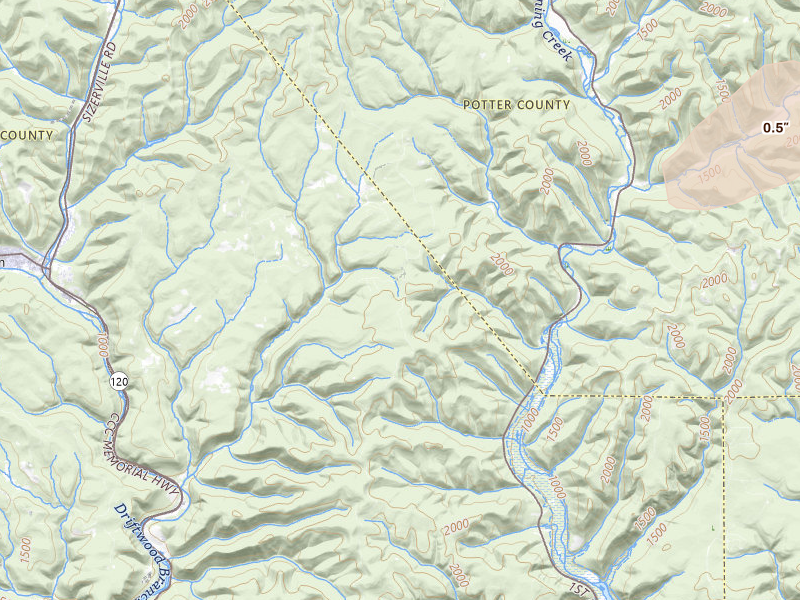
0.5" peak signal 12 mapped homes No ground reports

West Virginia

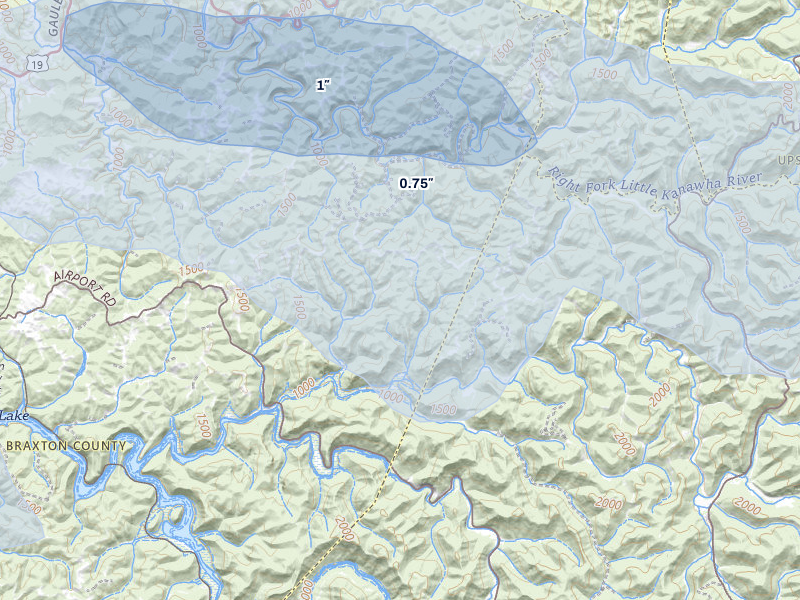
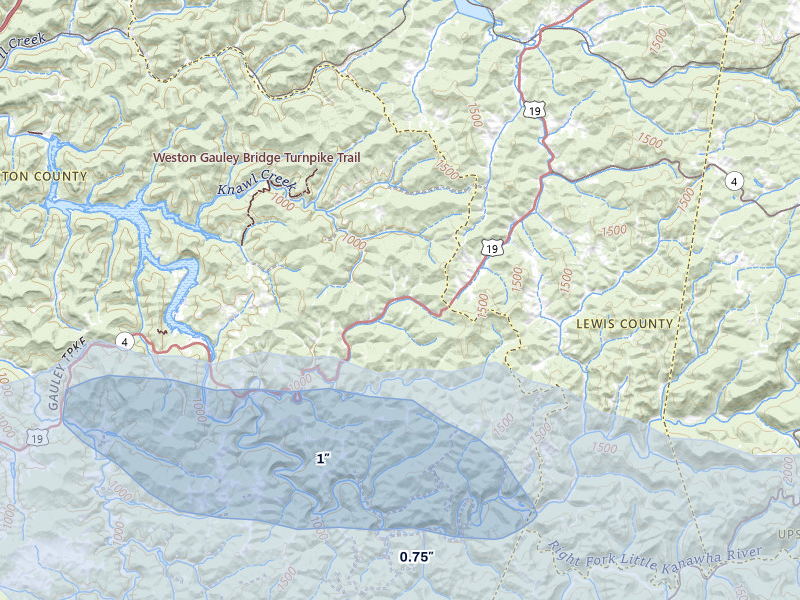
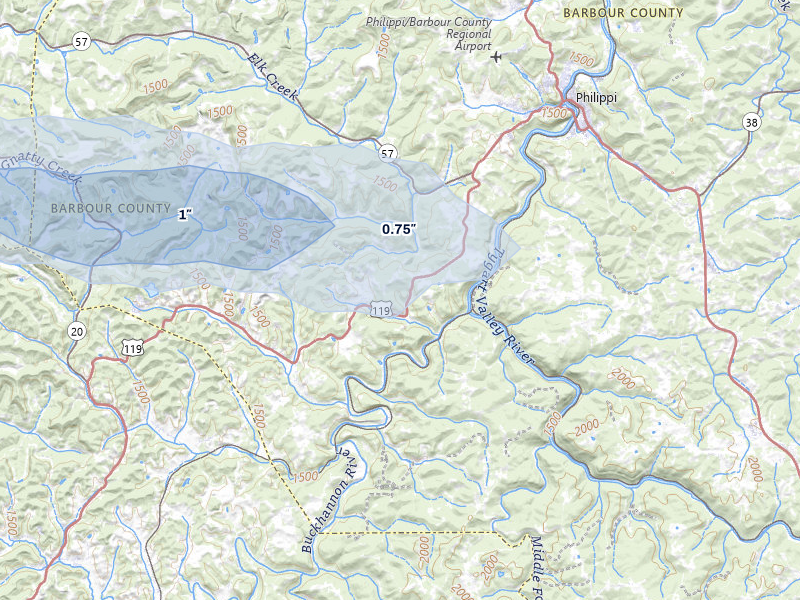
30 cities · up to 1.5" · 12,534 mapped homes
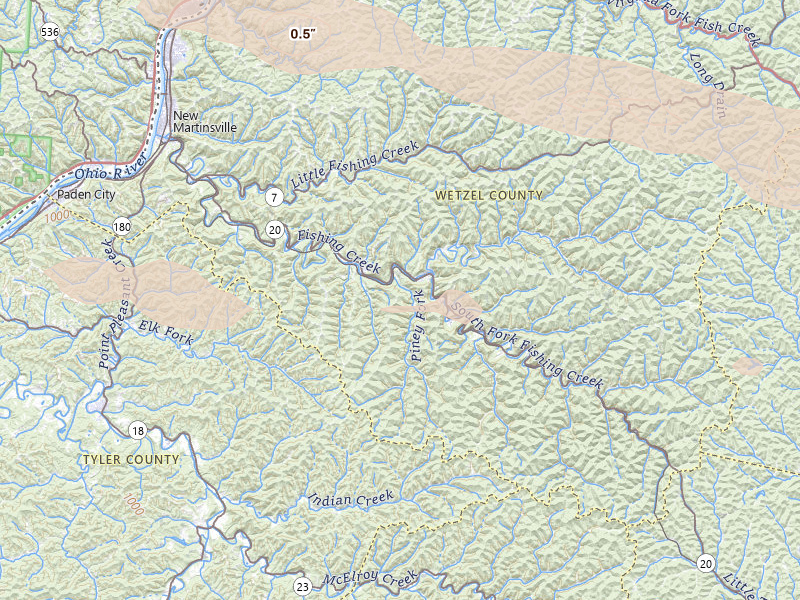
New Martinsville, WV 4.0 /10 severity
1.5" peak signal 2,895 mapped homes No ground reports
Morgantown, WV 3.9 /10 severity
1.25" peak signal 1,355 mapped homes 2 ground reports
Proctor, WV 3.9 /10 severity
1.5" peak signal 1,799 mapped homes No ground reports
Rivesville, WV 3.4 /10 severity
1.5" peak signal 210 mapped homes No ground reports
Fairview, WV 3.3 /10 severity
1.5" peak signal 127 mapped homes No ground reports
Metz, WV 3.3 /10 severity
1.5" peak signal 113 mapped homes No ground reports
Wheeling, WV 3.3 /10 severity
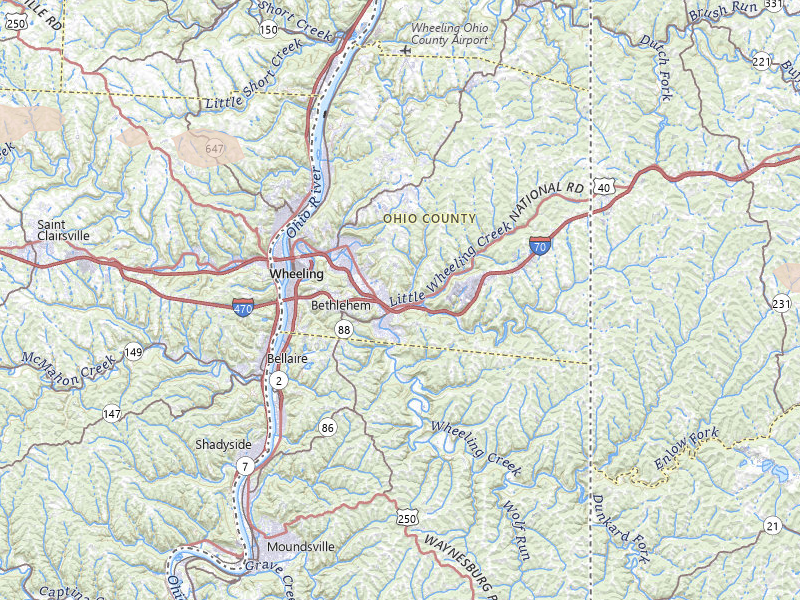
1" peak signal 3,926 mapped homes No ground reports
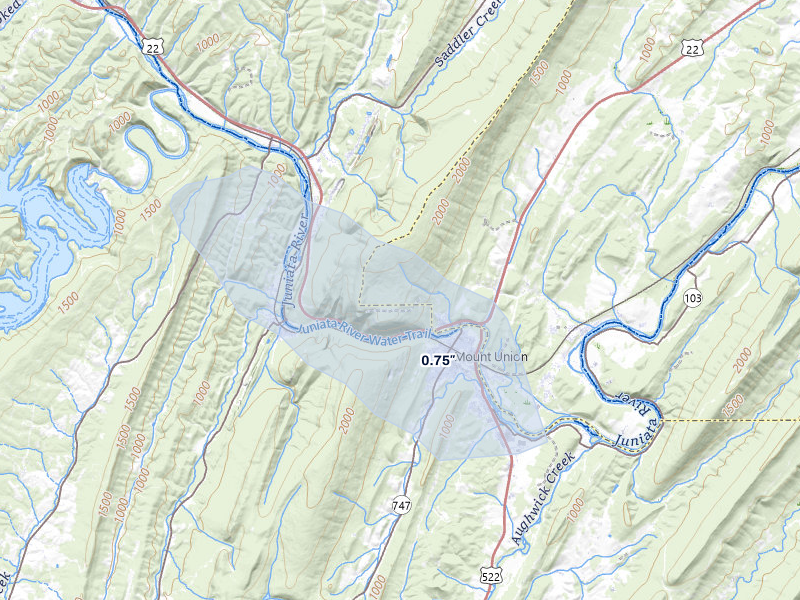
Littleton, WV 3.0 /10 severity
1.25" peak signal 195 mapped homes No ground reports
Alum Bridge, WV 2.8 /10 severity
1.25" peak signal 68 mapped homes No ground reports
Auburn, WV 2.8 /10 severity
1.25" peak signal 85 mapped homes No ground reports
Camden, WV 2.8 /10 severity
1.25" peak signal 67 mapped homes No ground reports
New Milton, WV 2.8 /10 severity
1.25" peak signal 83 mapped homes No ground reports
Reader, WV 2.8 /10 severity
1" peak signal 402 mapped homes No ground reports
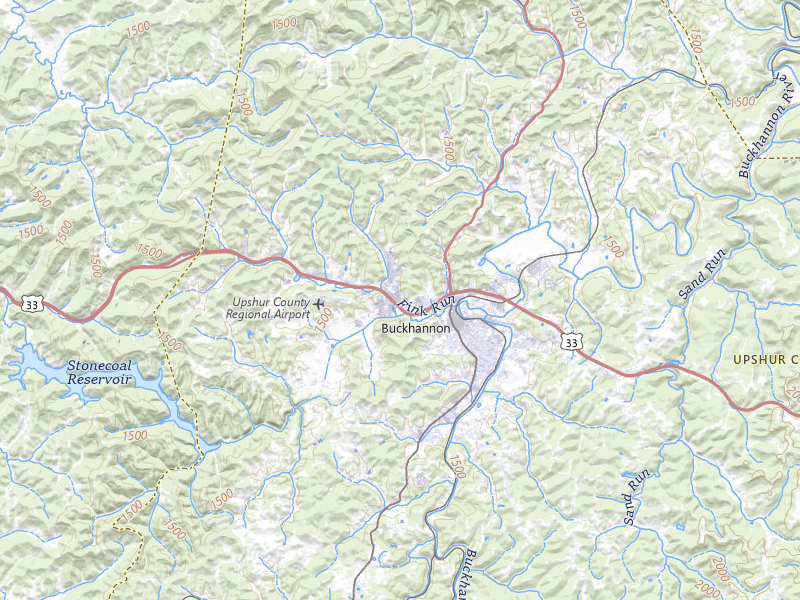
Buckhannon, WV 2.6 /10 severity
1" peak signal 162 mapped homes No ground reports
Hensley, WV 2.6 /10 severity
1" peak signal 169 mapped homes No ground reports
Mannington, WV 2.6 /10 severity
1" peak signal 143 mapped homes No ground reports
Pullman, WV 2.6 /10 severity
1.25" peak signal 26 mapped homes No ground reports
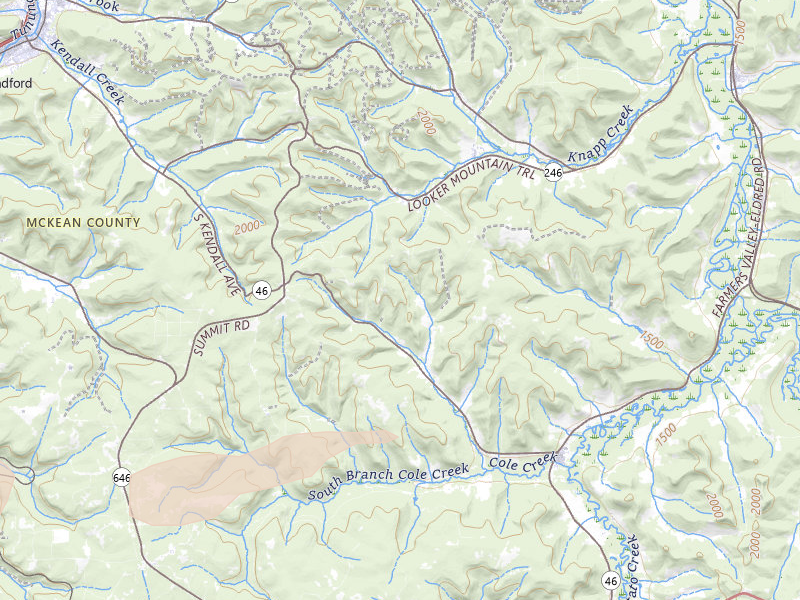
Hacker Valley, WV 2.5 /10 severity
1" peak signal 83 mapped homes No ground reports
White Sulphur Springs, WV 2.5 /10 severity
1" peak signal 99 mapped homes No ground reports
Arnoldsburg, WV 2.4 /10 severity
0.75" peak signal 120 mapped homes 1 ground report
Flatwoods, WV 2.3 /10 severity
1" peak signal 47 mapped homes No ground reports
Ireland, WV 2.3 /10 severity
1" peak signal 45 mapped homes No ground reports
Volga, WV 2.3 /10 severity
1" peak signal 47 mapped homes No ground reports
Smithfield, WV 2.2 /10 severity
1" peak signal 28 mapped homes No ground reports
Sutton, WV 2.0 /10 severity
0.75" peak signal 50 mapped homes No ground reports
Shock, WV 1.9 /10 severity
0.75" peak signal 32 mapped homes No ground reports
Danese, WV 1.8 /10 severity
0.75" peak signal 17 mapped homes No ground reports
Hedgesville, WV 1.8 /10 severity
0.5" peak signal 132 mapped homes No ground reports
West Union, WV 1.5 /10 severity
1" peak signal 0 mapped homes No ground reports
Odd, WV 1.2 /10 severity
0.5" peak signal 9 mapped homes No ground reports

Ohio

8 cities · up to 1.25" · 5,216 mapped homes
Montana

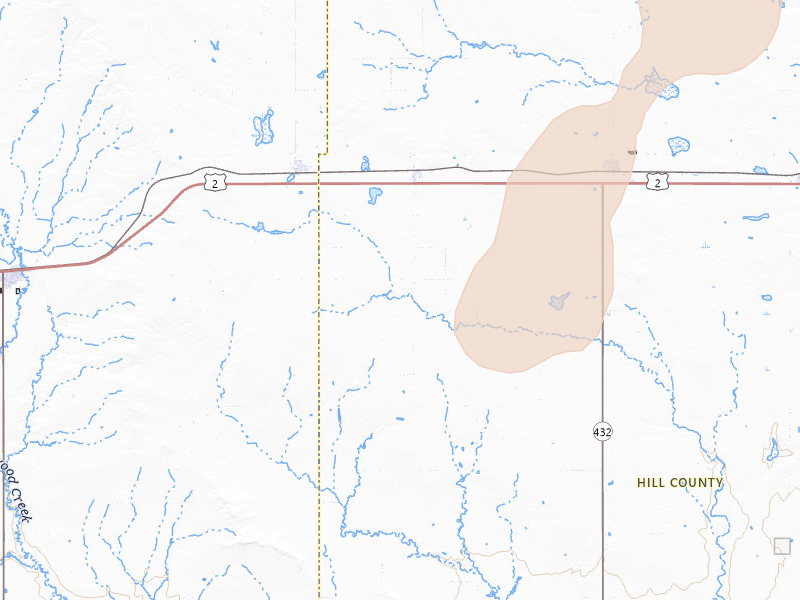
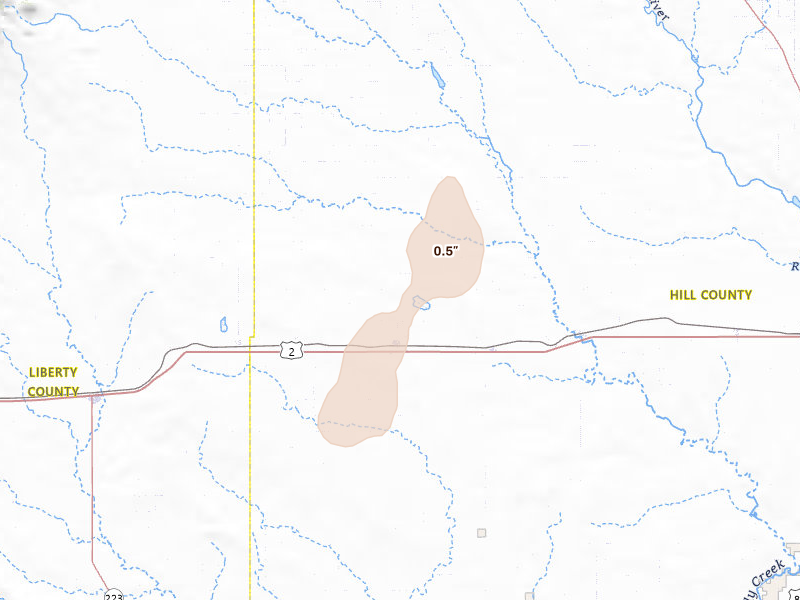
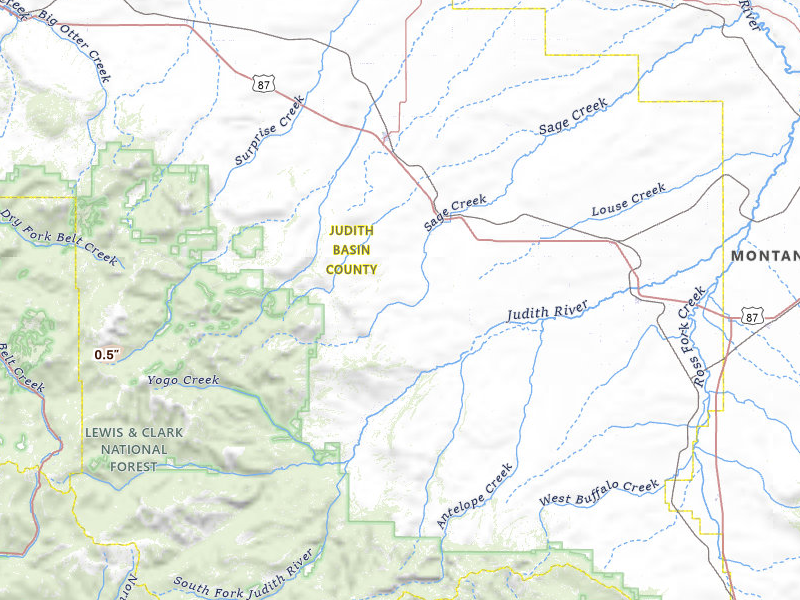
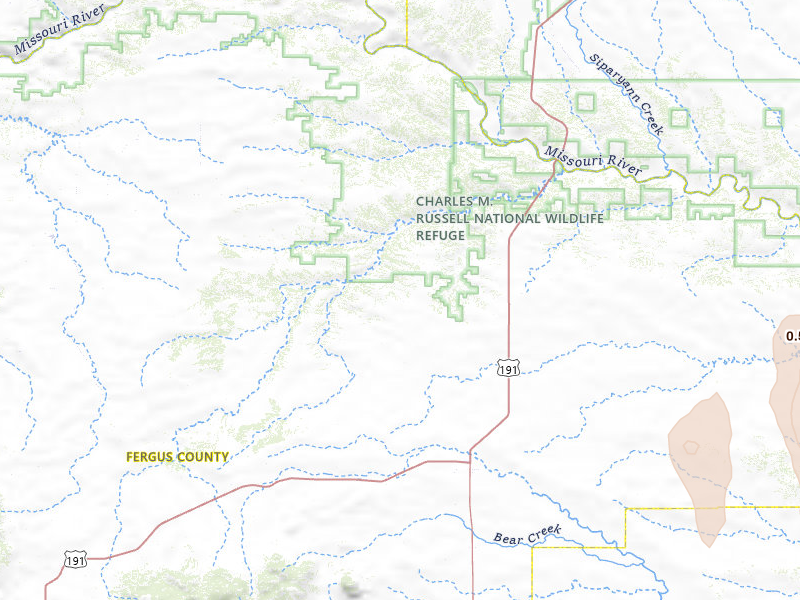
11 cities · up to 1.25" · 223 mapped homes
New York

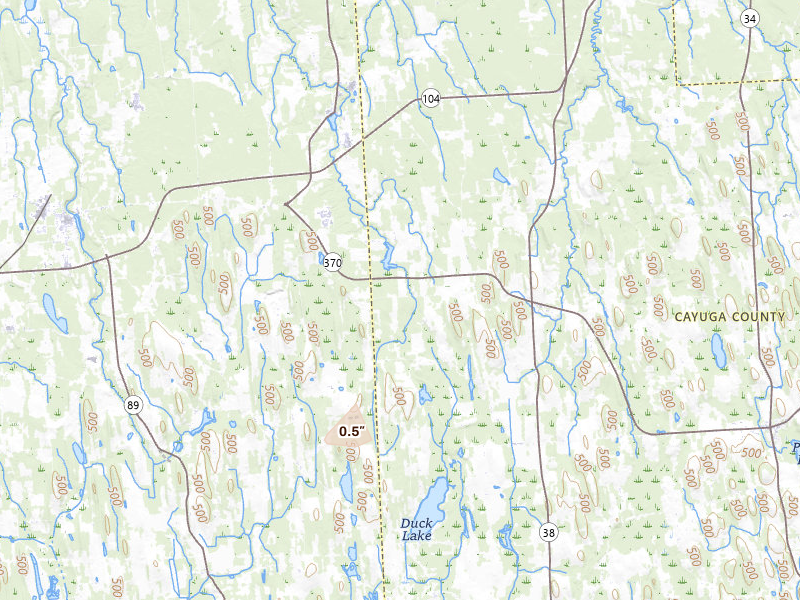
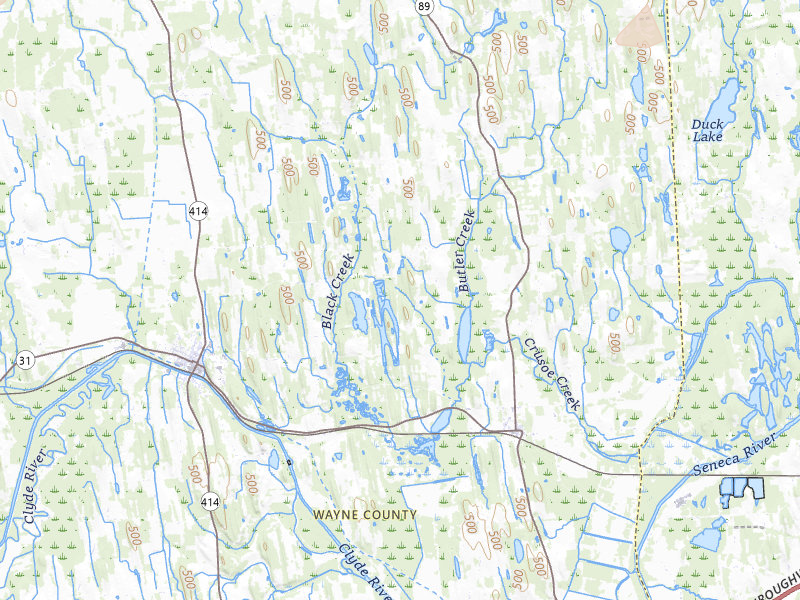
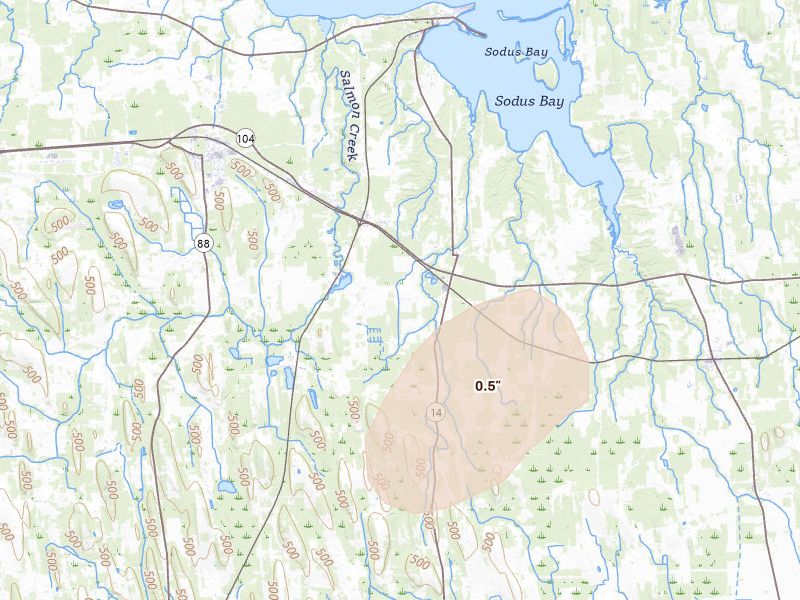
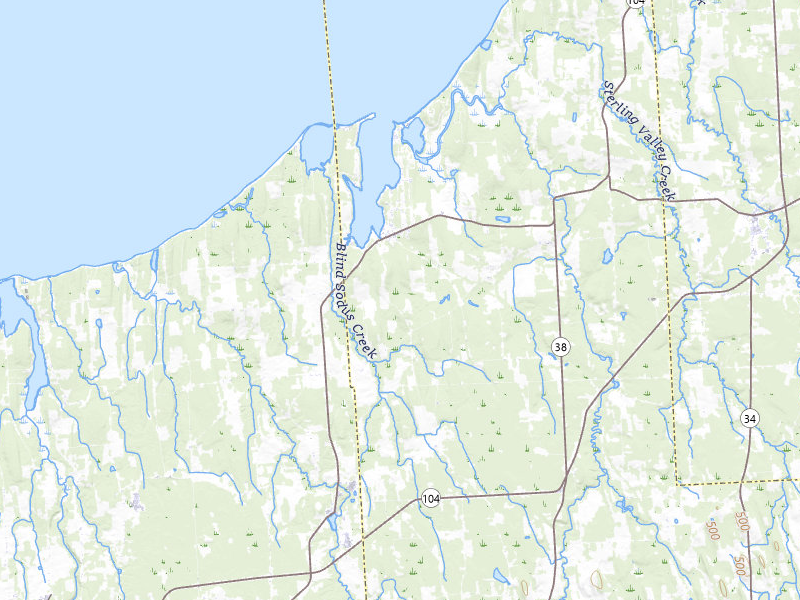
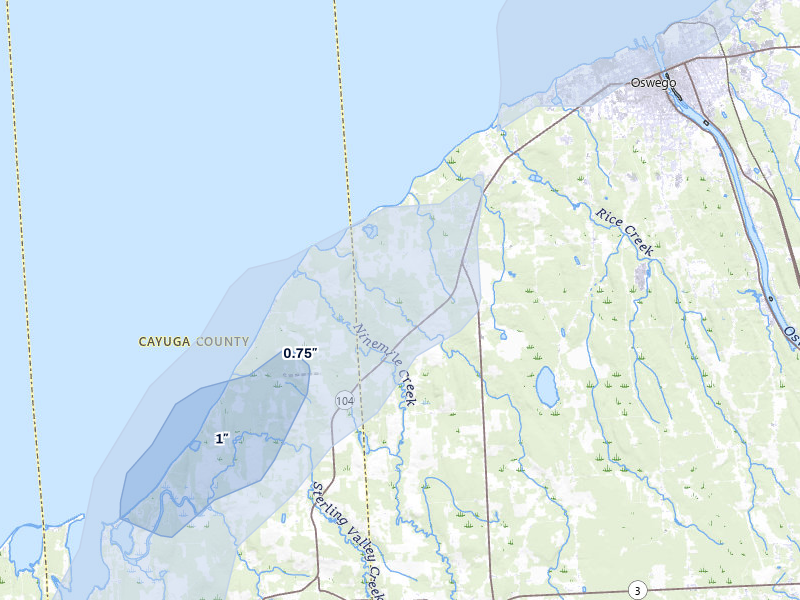
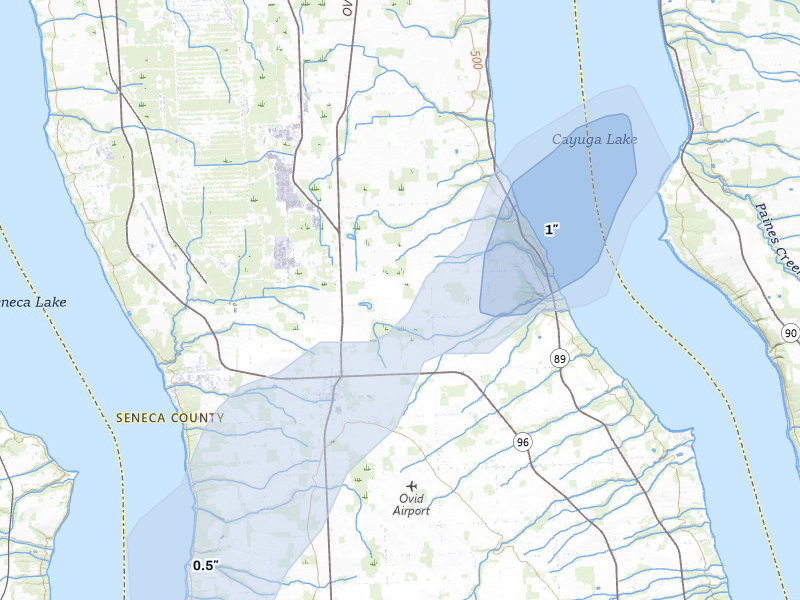
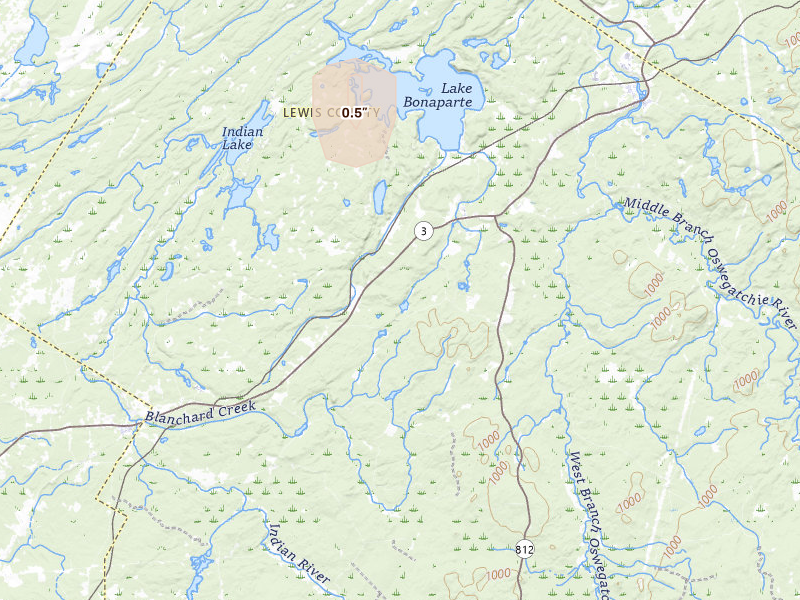
14 cities · up to 1.25" · 3,317 mapped homes
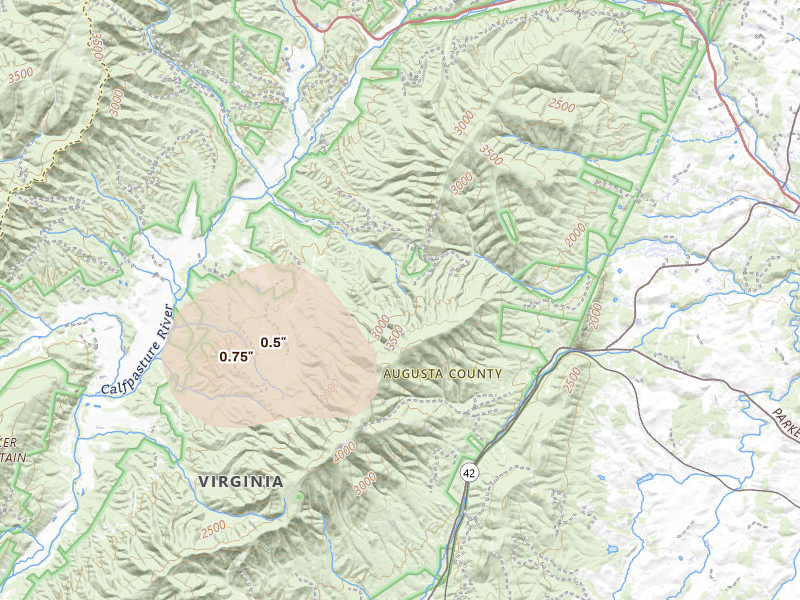
Virginia

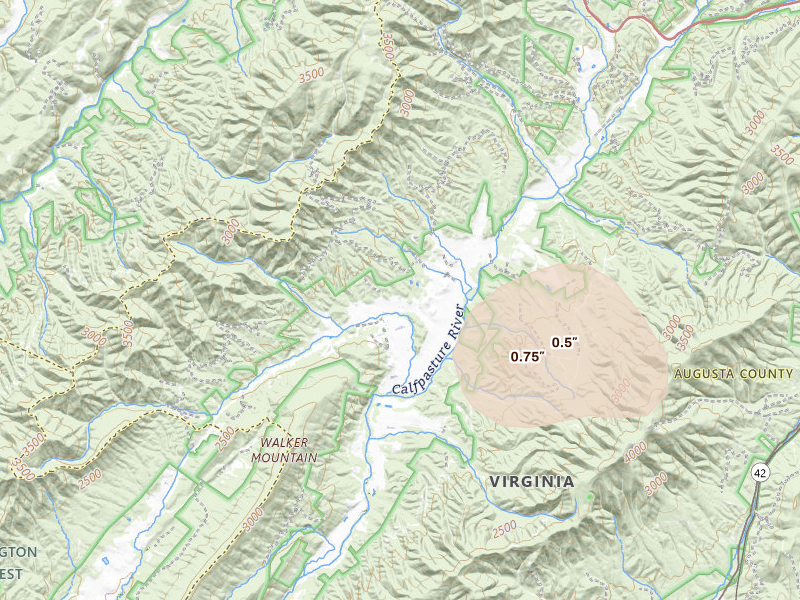
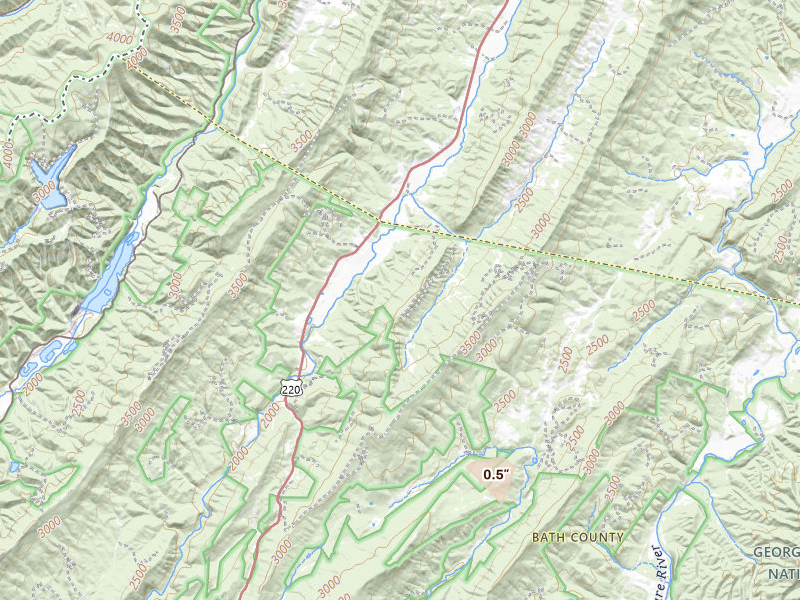
6 cities · up to 1.25" · 293 mapped homes
Wyoming

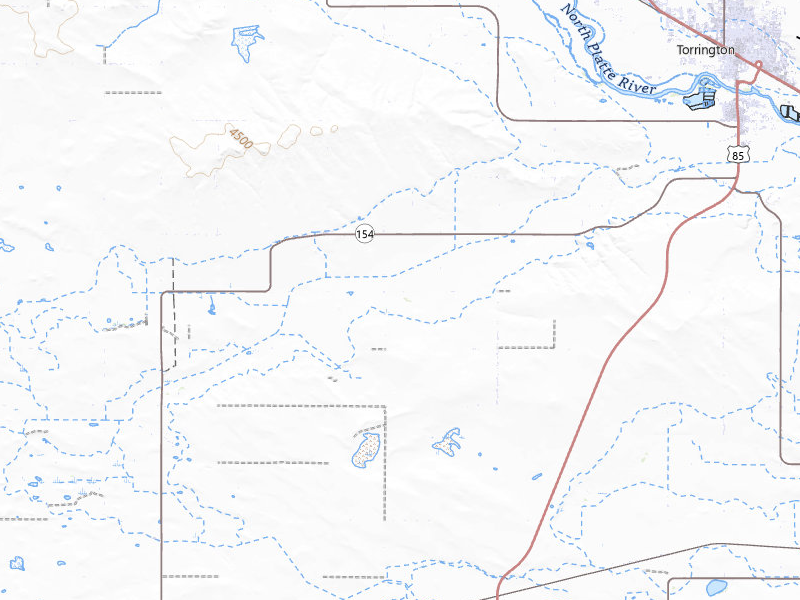
1 city · up to 1" · 20 mapped homes
New Mexico

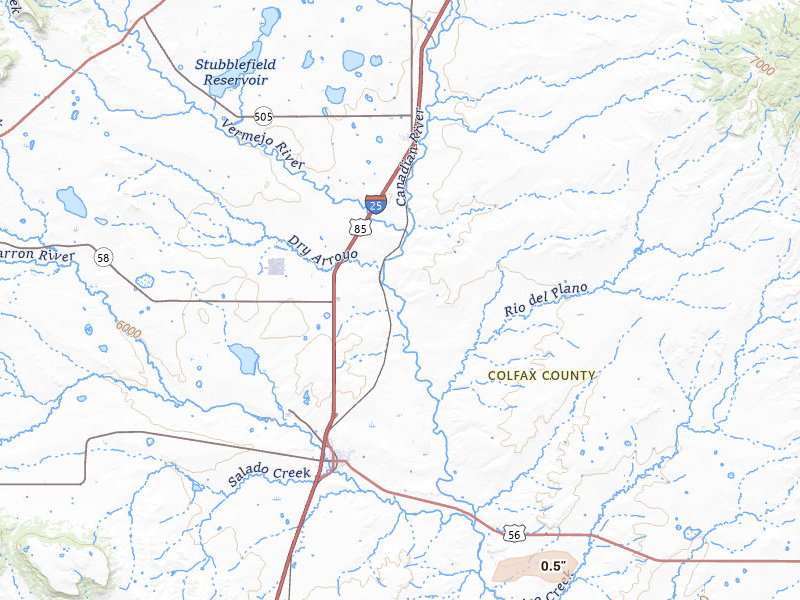
1 city · up to 0.75" · 6 mapped homes
Florida

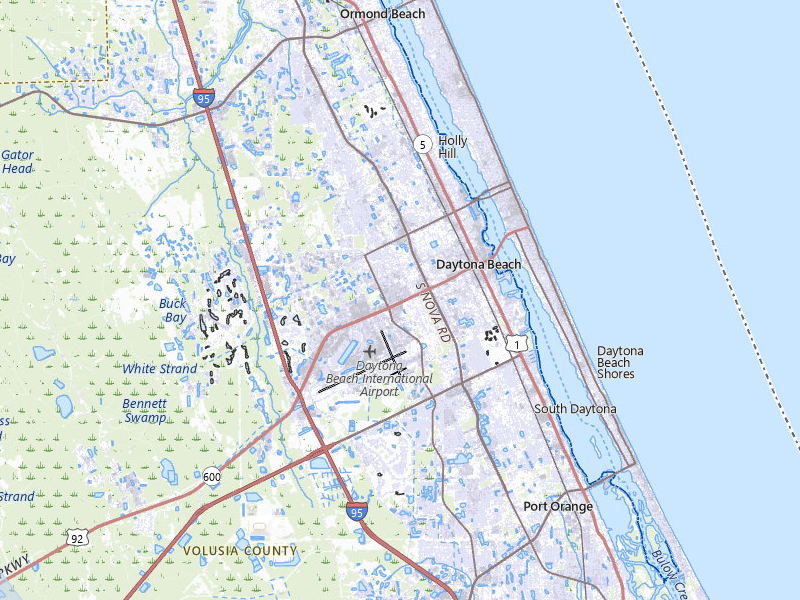
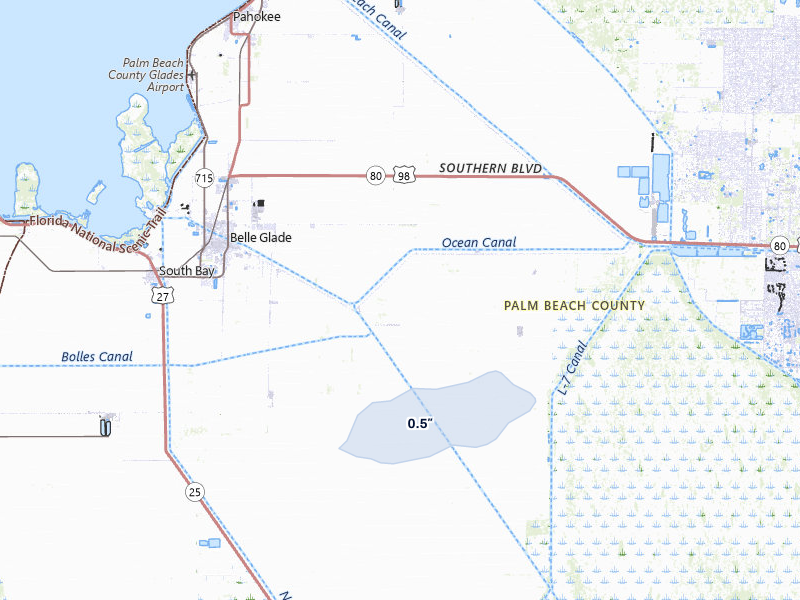
2 cities · up to 0.5" · 30 mapped homes
← All storm days

Overview Pro · iPhone + web

One app for your prospecting day.

The hail map, your next recommended area, and the tools to work it. Start on your own; the same subscription also includes access for up to 4 team members.

Overview Pro

One plan · iPhone + web

Monthly · US App Store

$149.99 / month

5,000 new addresses per user each month on Pro. Put your 200 trial addresses to work before another week goes to guesswork.

Optional outreach

+ $0.21 per contact returned
Available homeowner names and phone numbers, with freshness and DNC flags.
+ $0.75 per postcard mailed
Print, postage, and delivery tracking included.

What's included

Get recommended places to prospect, or draw your own. The same plan gives you the tools to work either one.
  • Hail maps, storm history, and live radar
  • Curated prospecting recommendations and Quests
  • Canvassing sessions and navigation
  • Door outcomes, notes, and photos
  • Visit history and follow-up Quests
  • Alerts for your saved territories
  • Polygon and hexagon draw tools
  • Saved work areas and address lists
  • CSV exports for your dialer or CRM
  • XP, levels, and the leaderboard
  • Access on iPhone and the web
  • Up to 4 team members

7-day free trial in the iPhone app. No card required to start.

Choose whether to subscribe when your trial ends. Paid subscriptions renew monthly. Manage or cancel in your Apple Account settings.

See all pricing and billing details →
Start free trial

Web trial: 7 days free. Card required. $150/month after the trial unless cancelled.

The next storm won’t wait for you.

Set your territory and alerts today. When hail hits, use Overview to choose your streets and get moving.

Download on the App Store

7-day free trial in the iPhone app. No card required to start.

For iPhone. Android coming soon.

Open May 13 on the live map → Start free trial

Web trial: 7 days free. Card required. $150/month after the trial unless cancelled.

Storm days are convective days (noon-to-noon UTC). Cities and counts are the set Overview tracks, not every place hail fell. Ground reports are public-domain observations from the NOAA Storm Prediction Center; radar sizes are detections and estimates, not confirmed damage.