Hail storms on Aug 1, 2026
99 cities across 16 states recorded hail on Aug 1, 2026 — a multi-state outbreak. The peak radar-indicated size reached 3" over San Jon — about the size of a baseball. That is a severe hail signal, not property-level damage confirmation.

7-day free trial in the iPhone app. No card required to start.
For iPhone. Android coming soon.

Web trial: 7 days free. Card required. $150/month after the trial unless cancelled.
Aug 1, 2026 · San Jon, NM: 3" peak radar signal · NEXRAD + radar-estimated size maps
Mapped cities, by state
Every tracked city with a hail signal on Aug 1, 2026
Every tracked city that recorded hail on this convective day, biggest signal first. Each row opens that city's full storm record.
How to read this day
A storm day on Overview is a convective day — it runs from noon to noon UTC, so late-night hail is grouped with the afternoon storm that spawned it rather than split across two calendar dates. Everything below happened inside the Aug 1, 2026 convective day. Across those footprints sit roughly 66,971 homes, and 3 ground reports were filed with the National Weather Service.
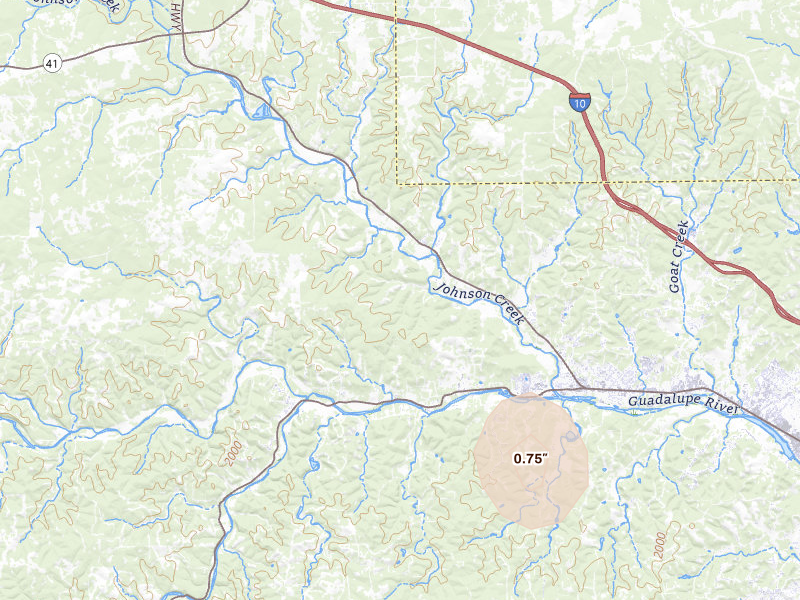
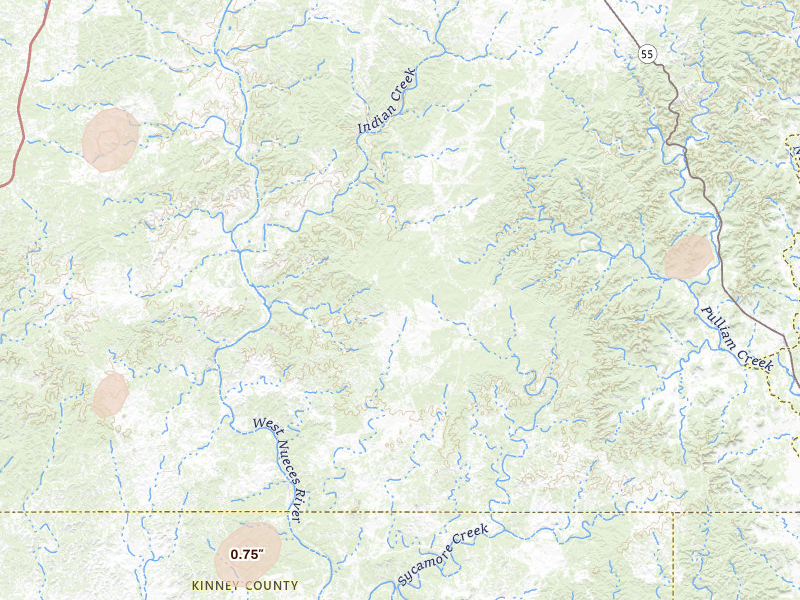
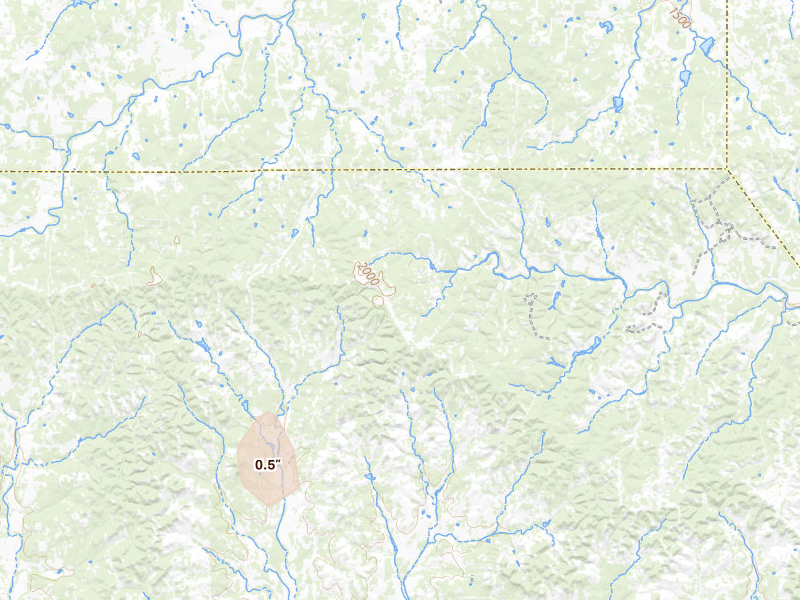
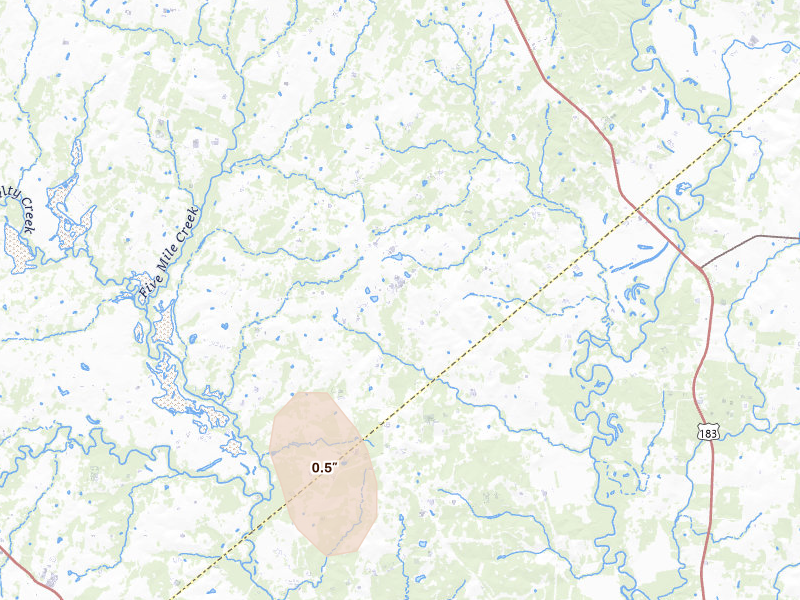
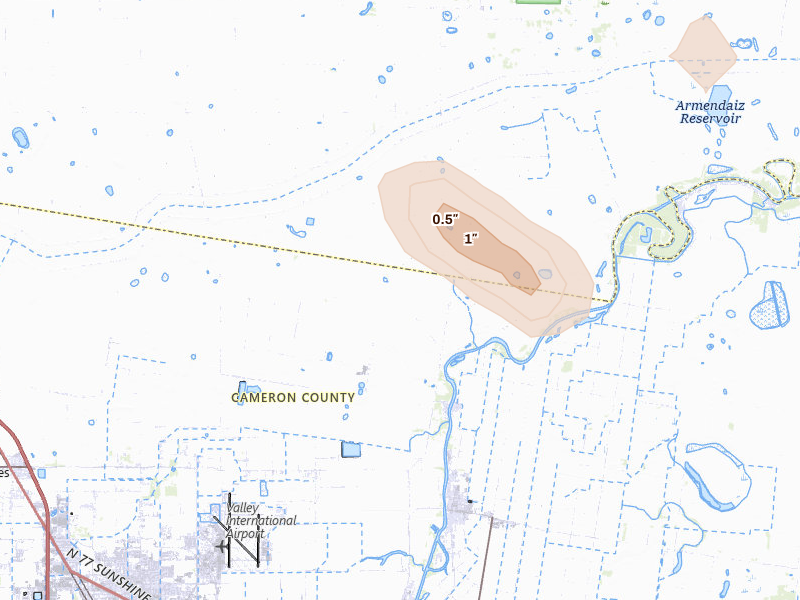
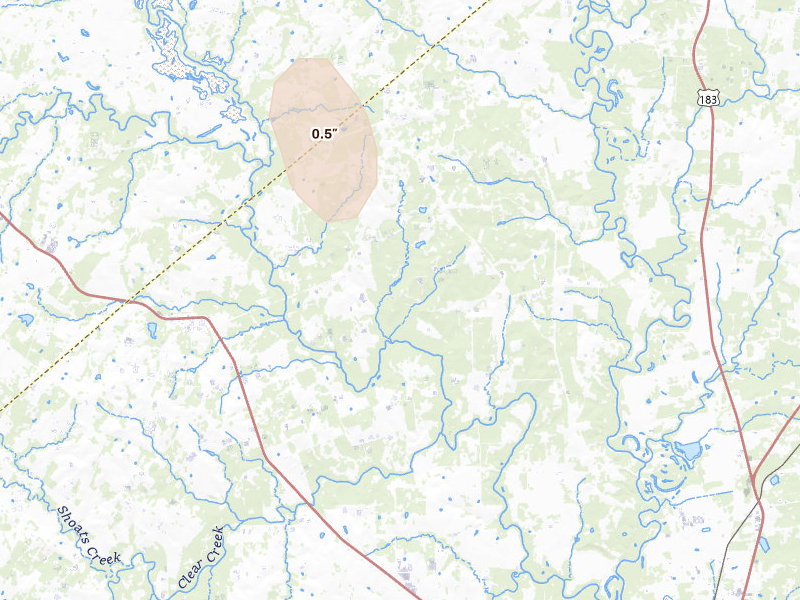
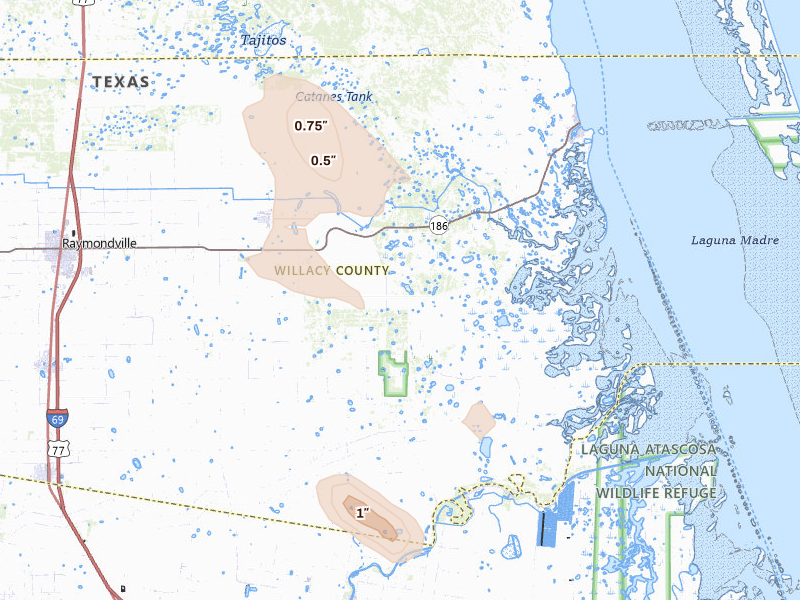
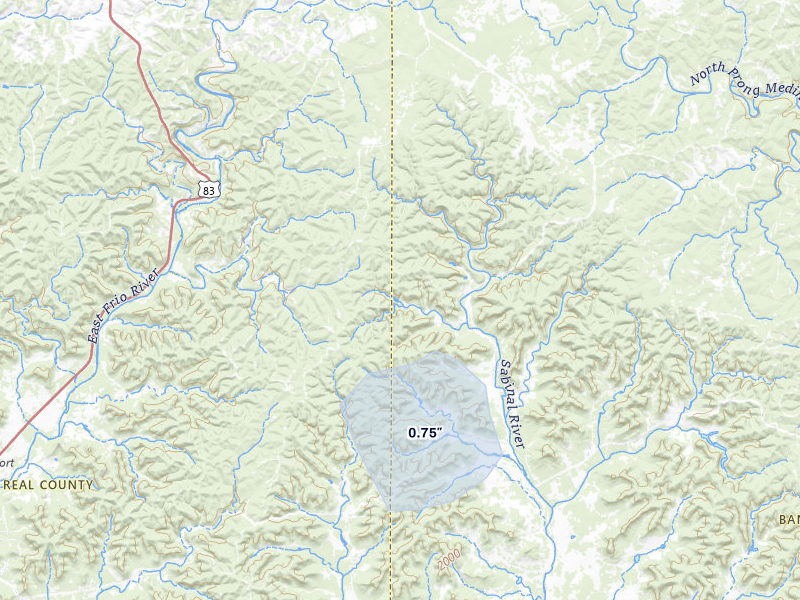
The cities are listed with the biggest storm first, measured by Overview's severity score. Each row links through to that city's own storm page, where you'll find the radar surfaces, every ground report filed, and the hail footprint drawn on the map.
The counts here are the size of the set of cities Overview tracks — never "every US city" — so read a quiet day as "quiet among the places we watch," not as proof nothing happened elsewhere.
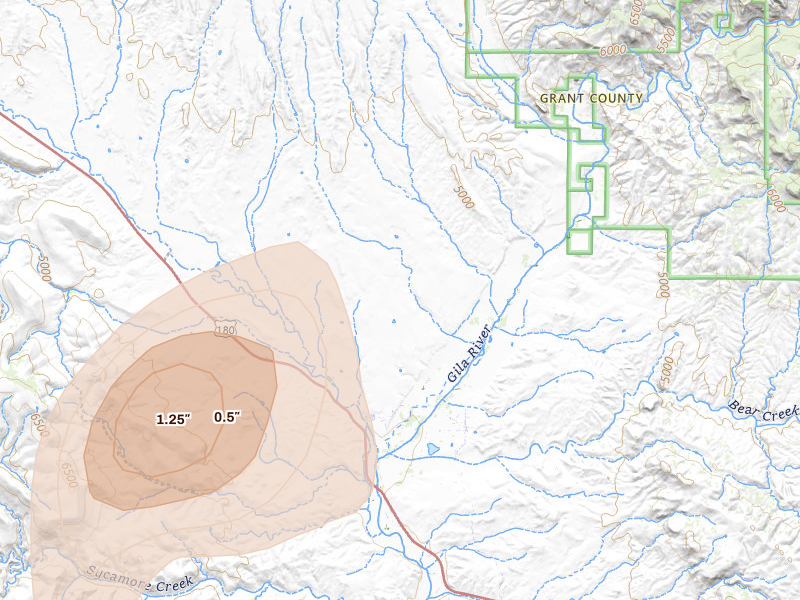
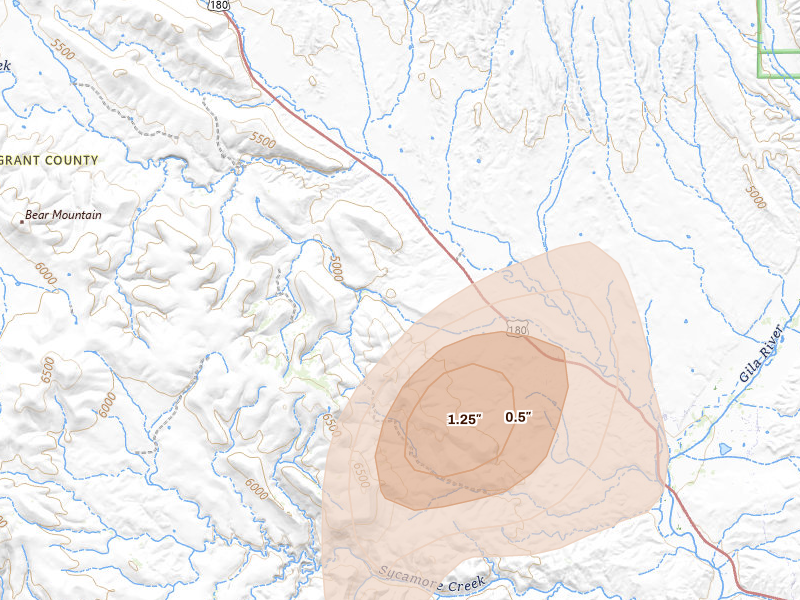
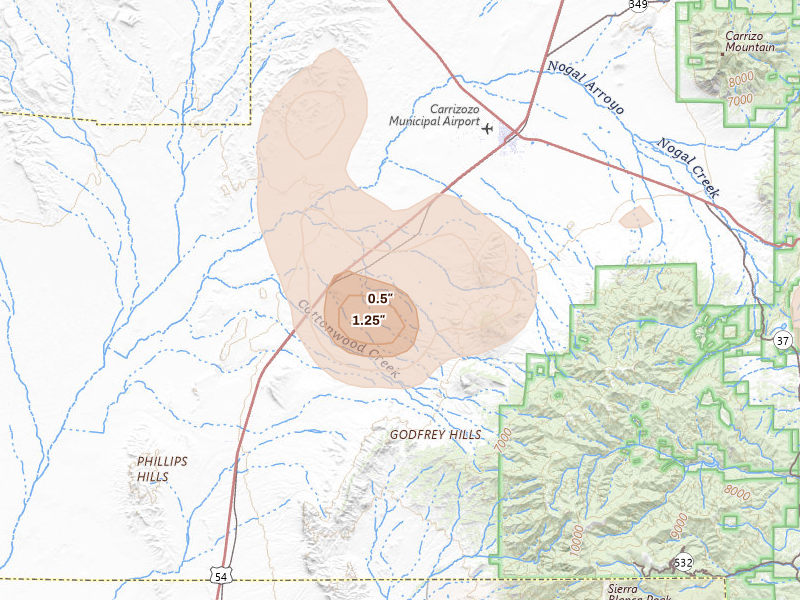
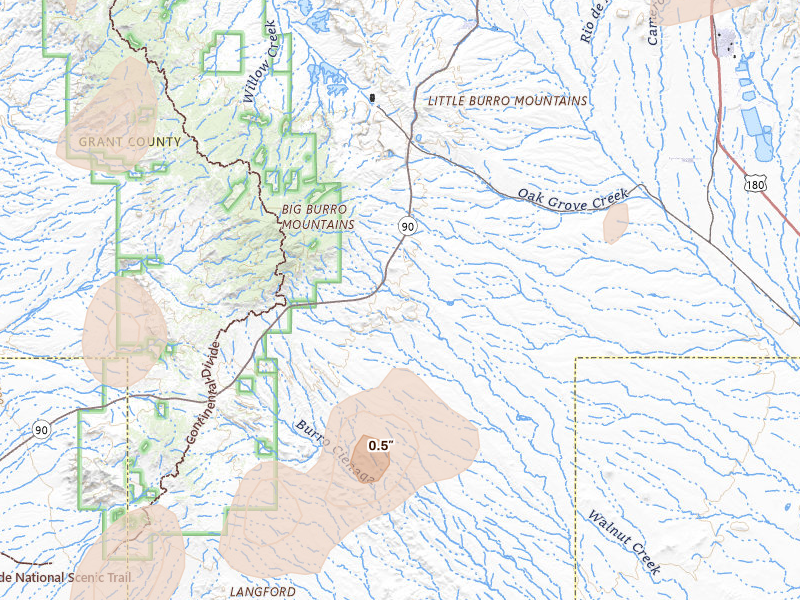
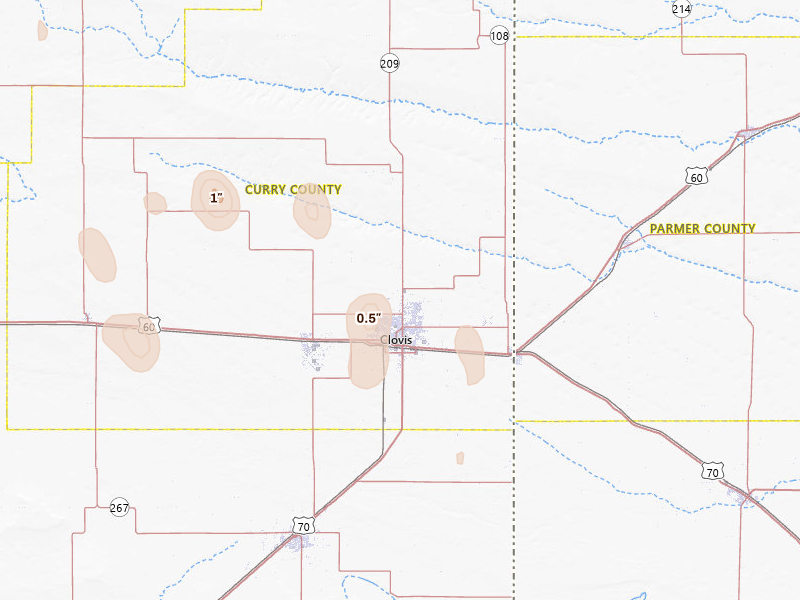
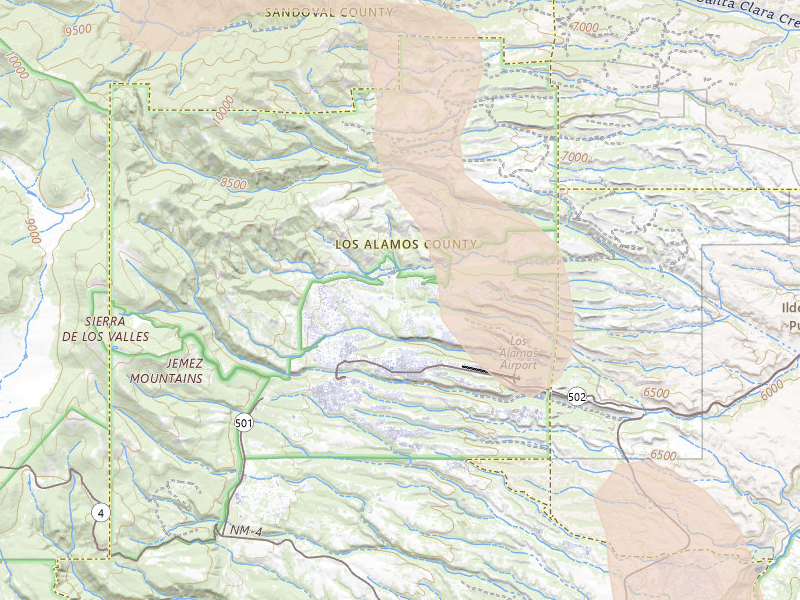
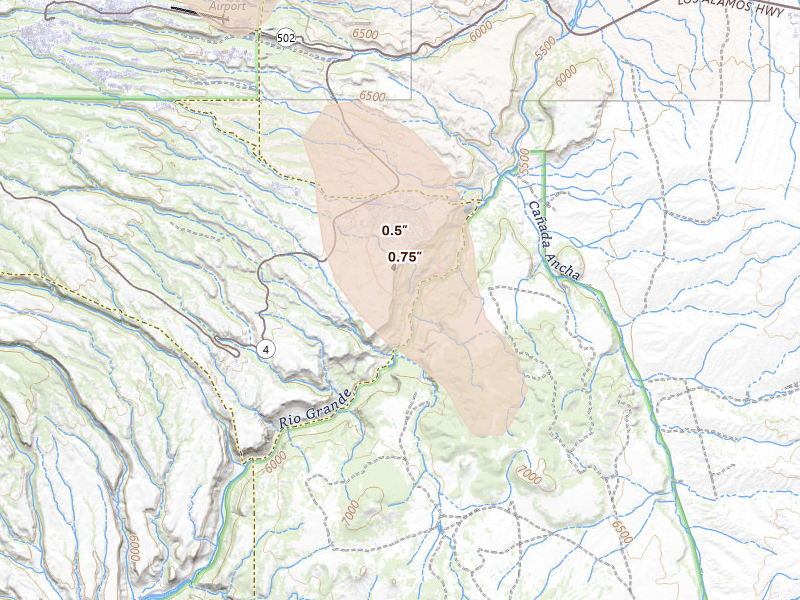
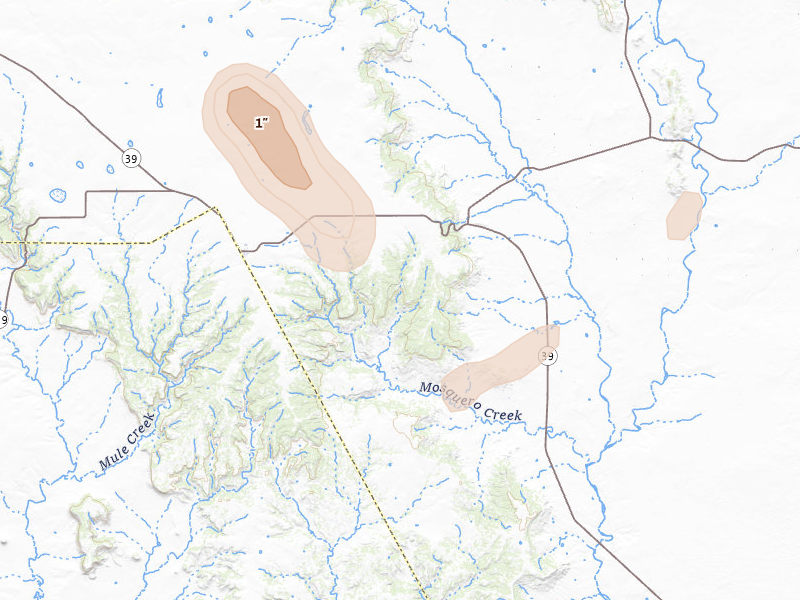
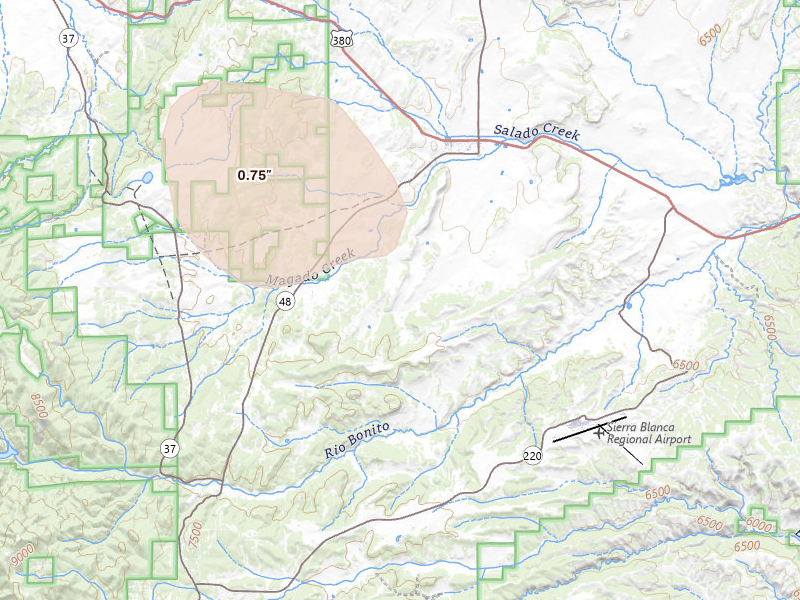
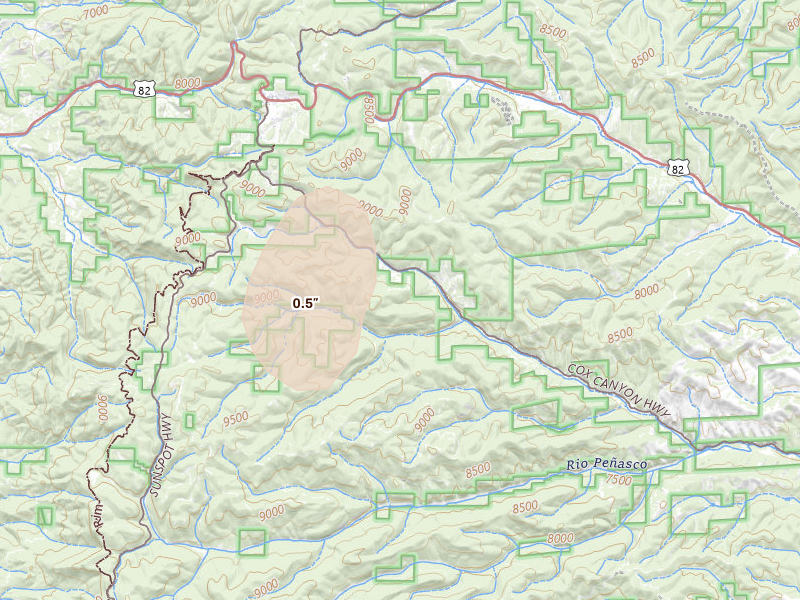
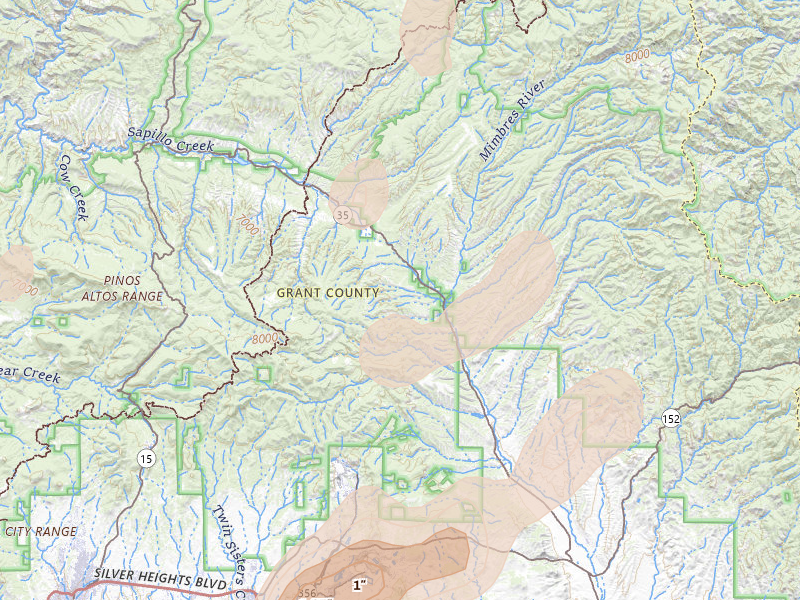
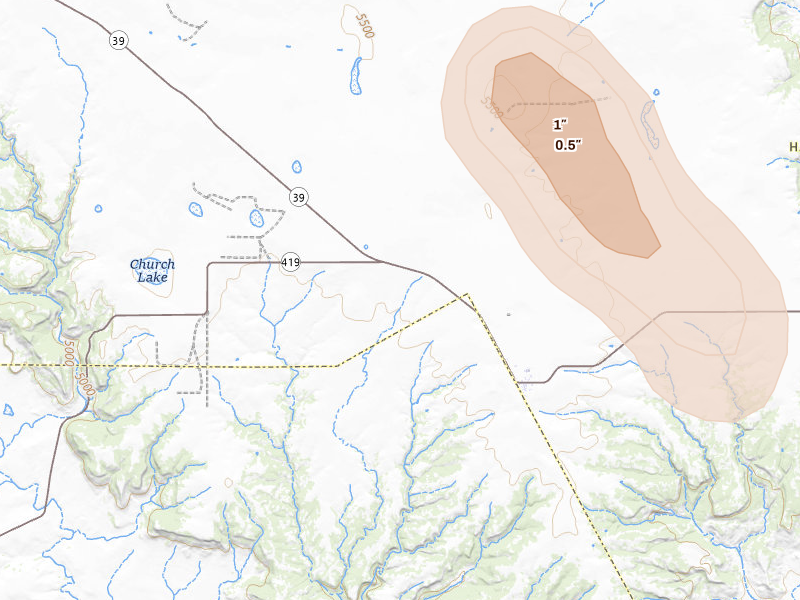
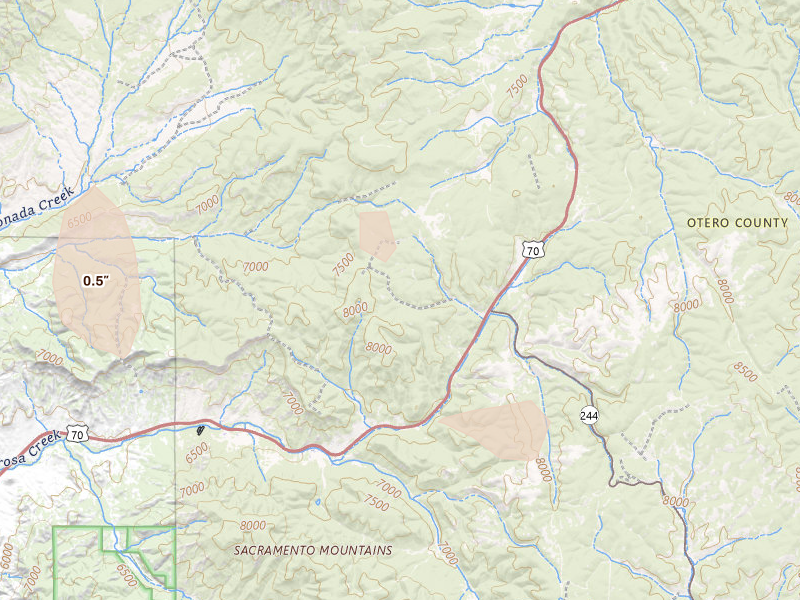
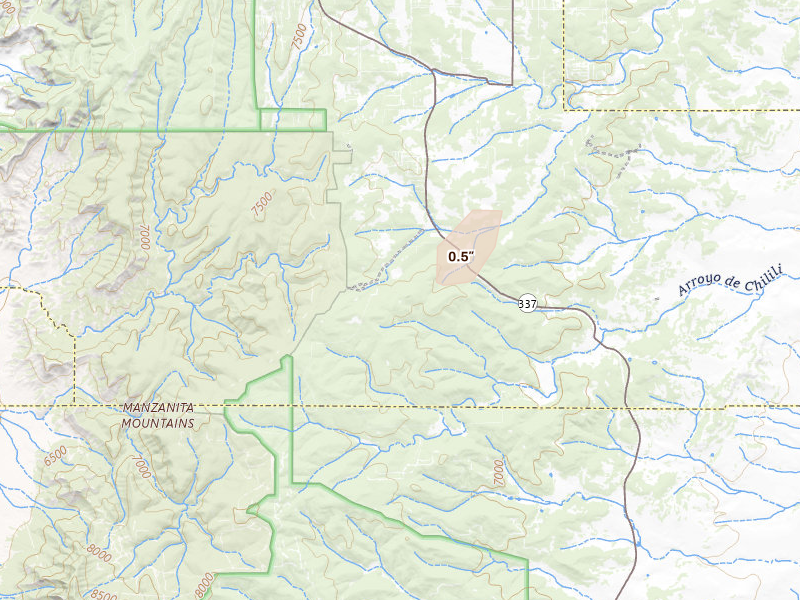
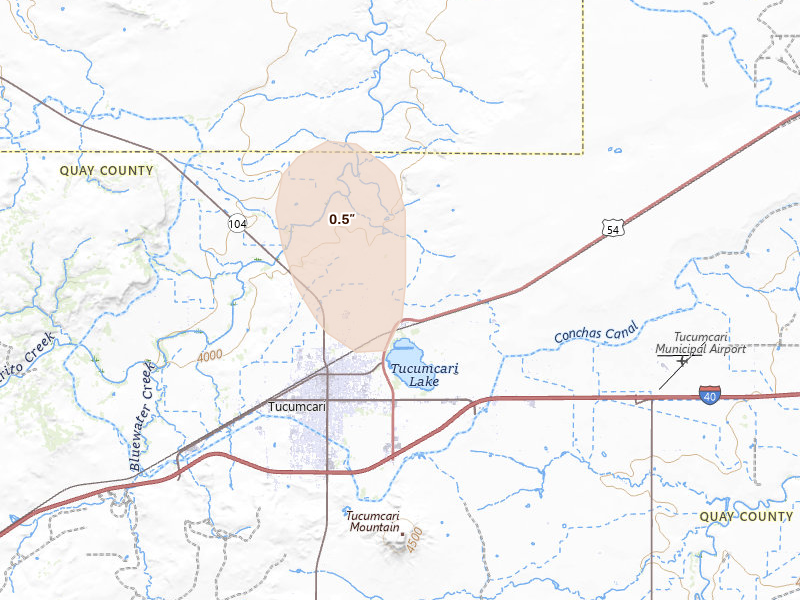
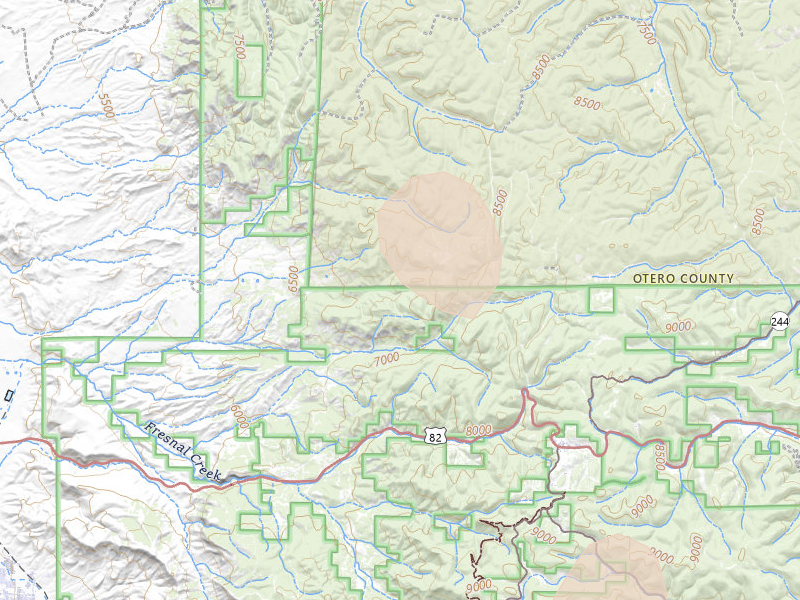
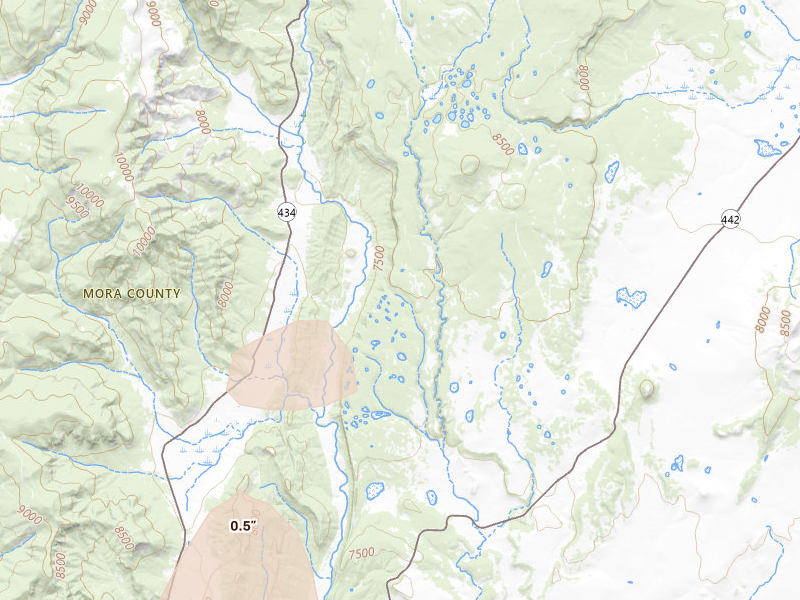
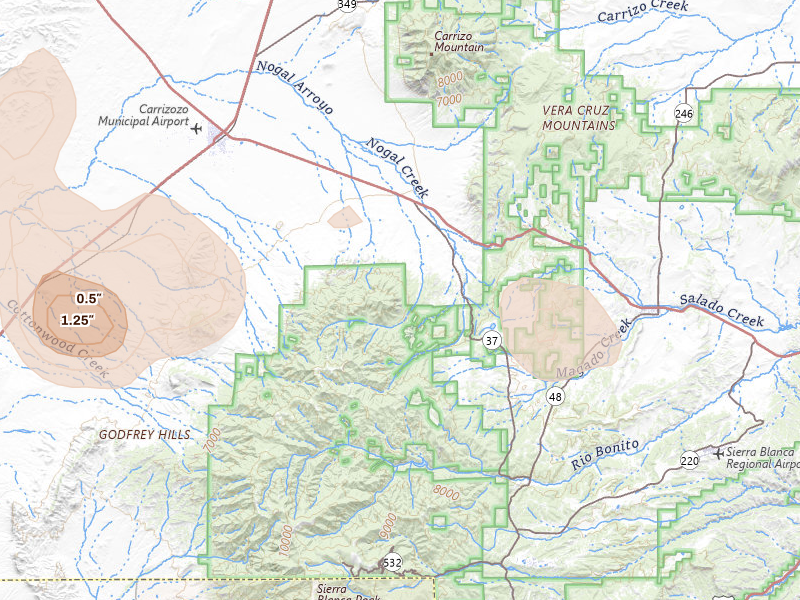
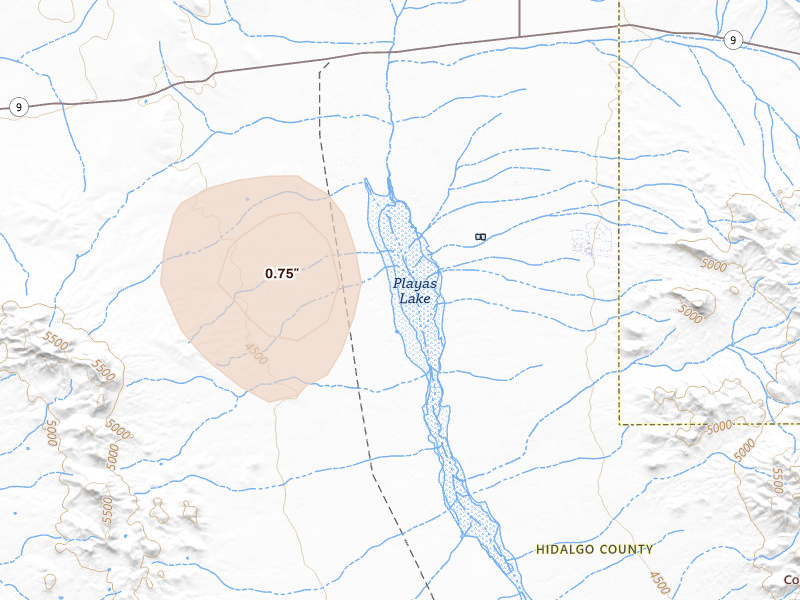
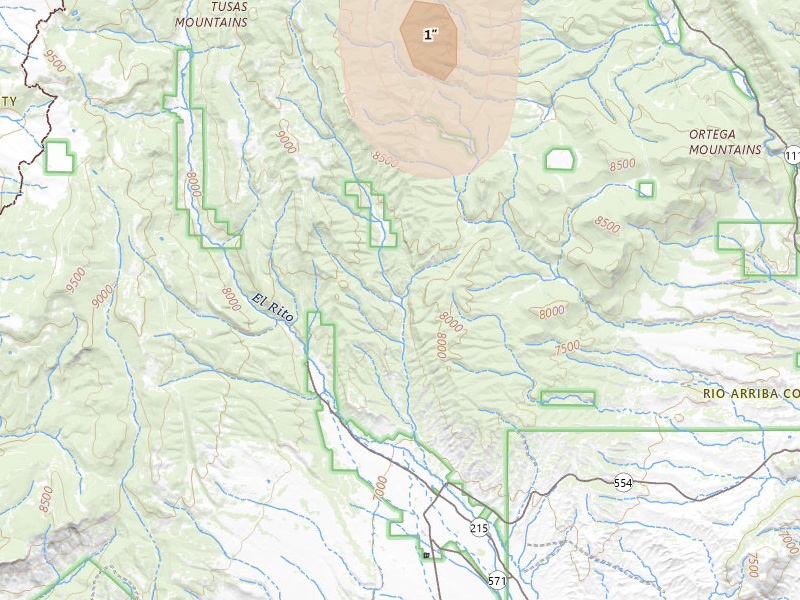
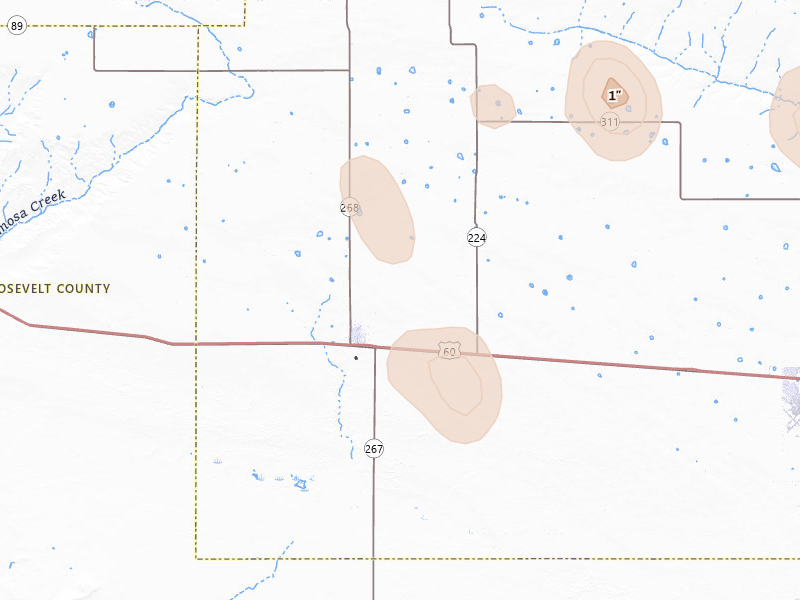
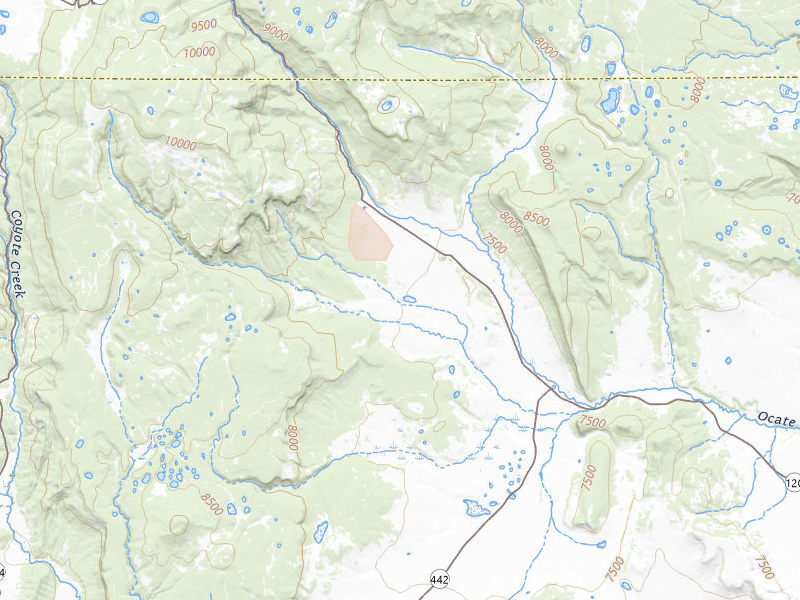
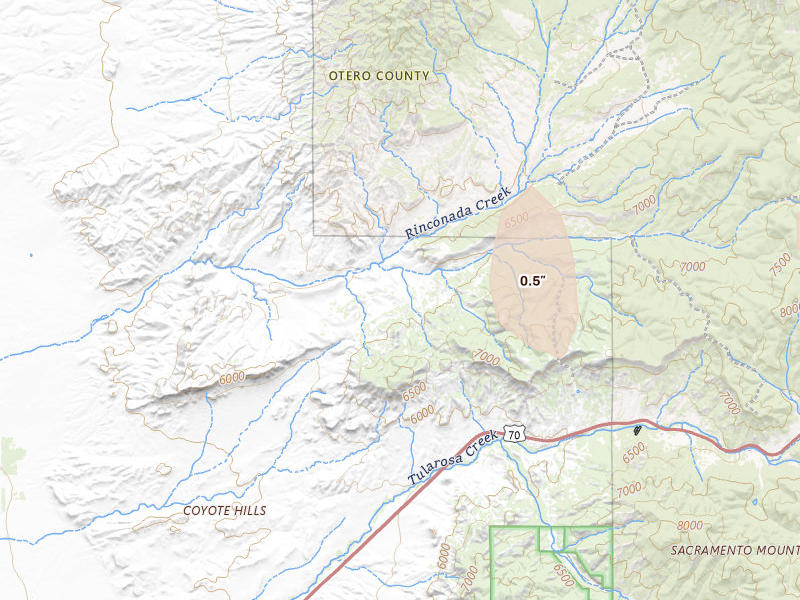
New Mexico
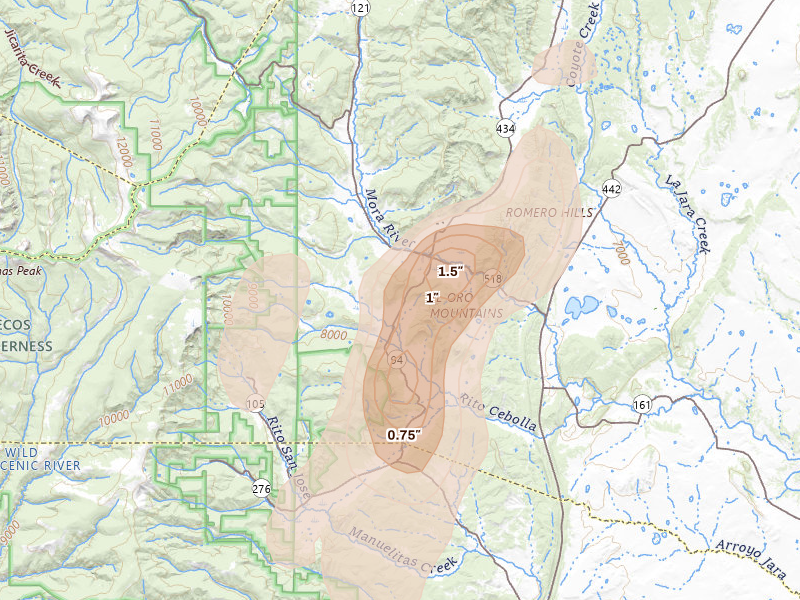
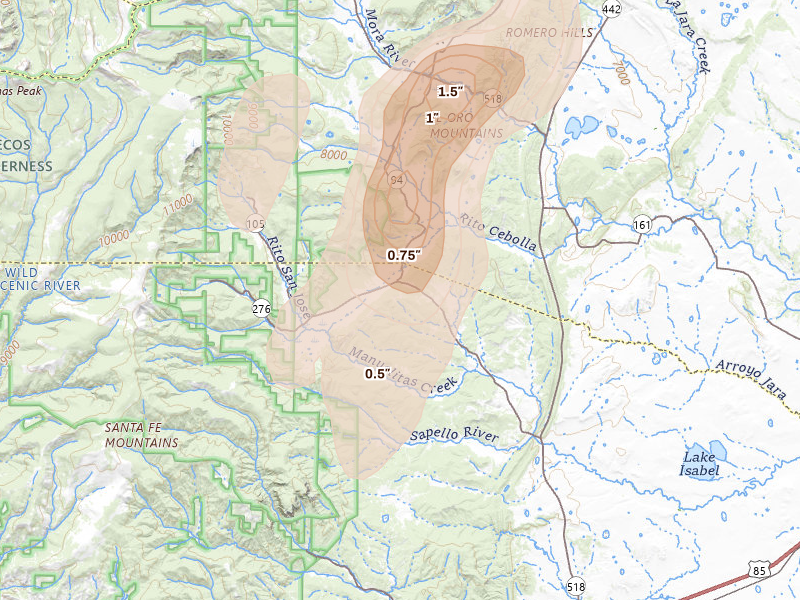
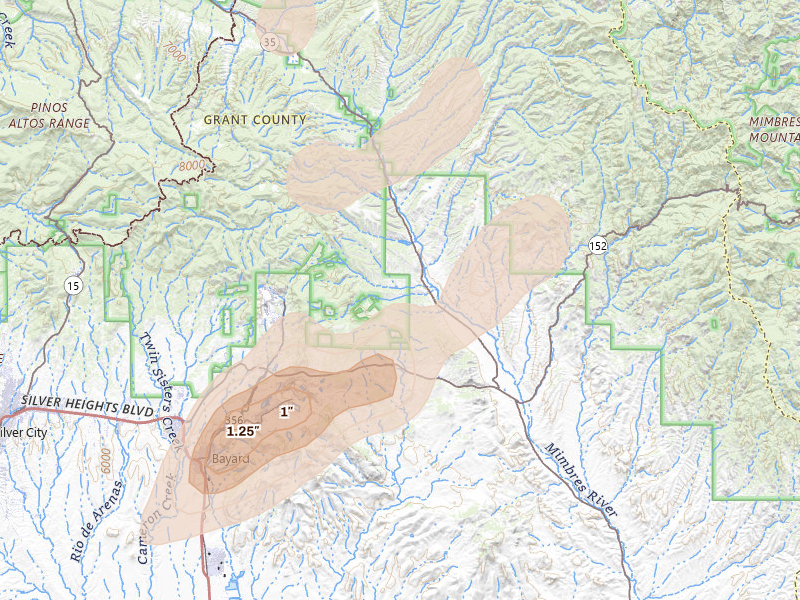
27 cities · up to 3" · 10,007 mapped homes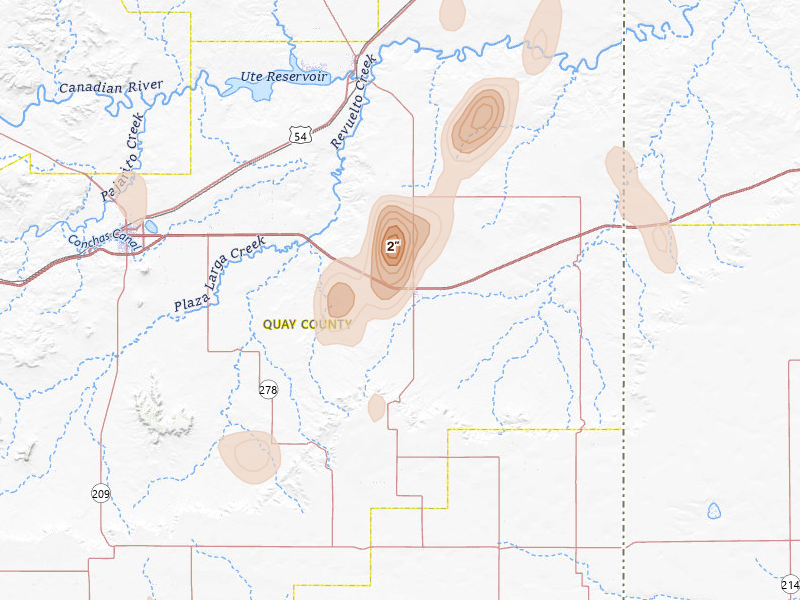
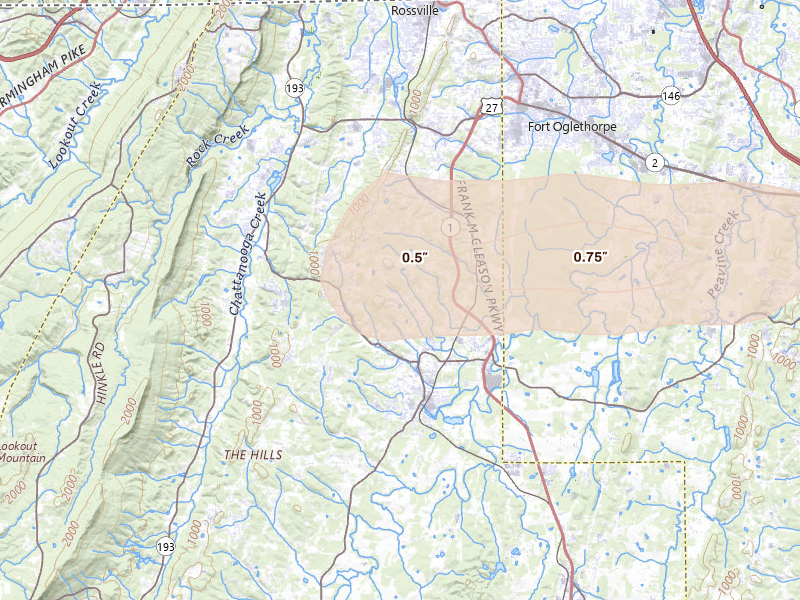
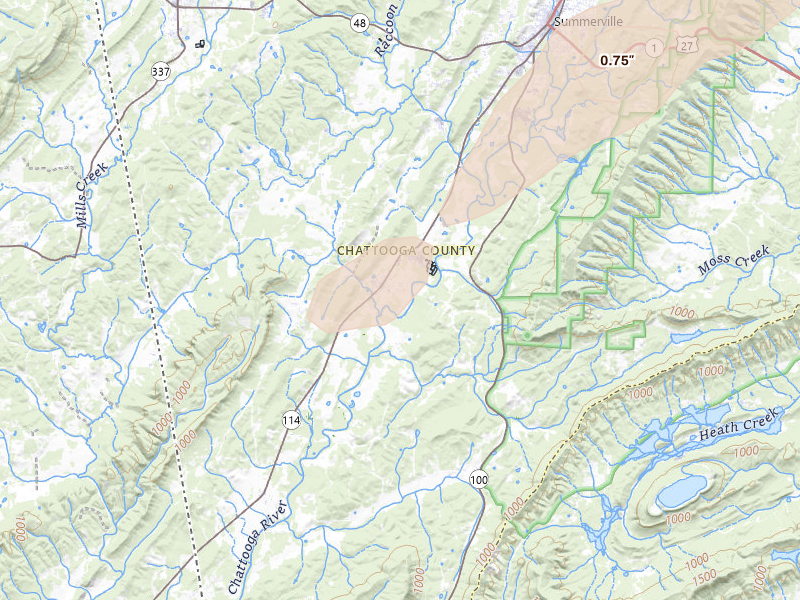
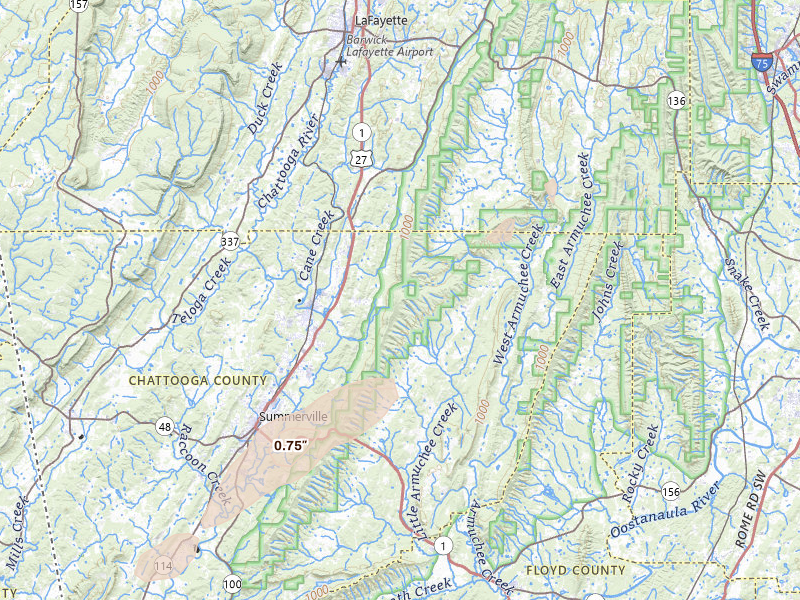
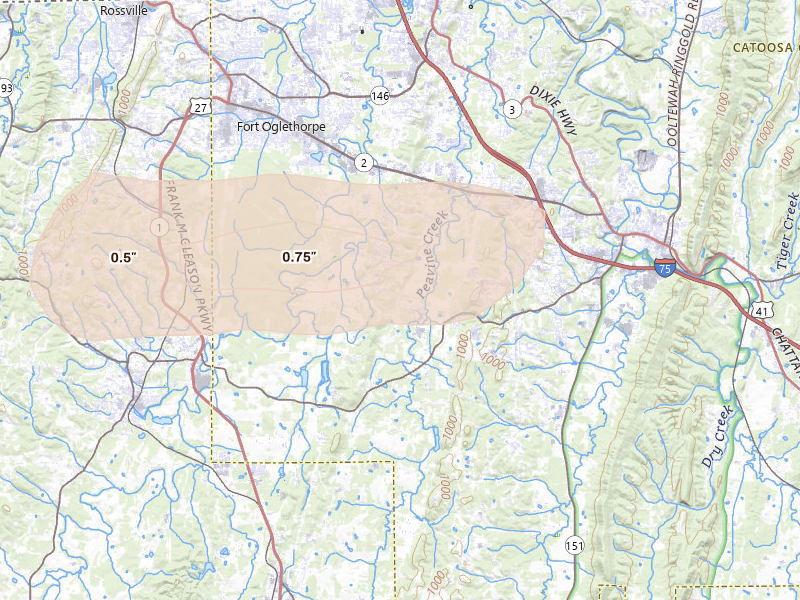
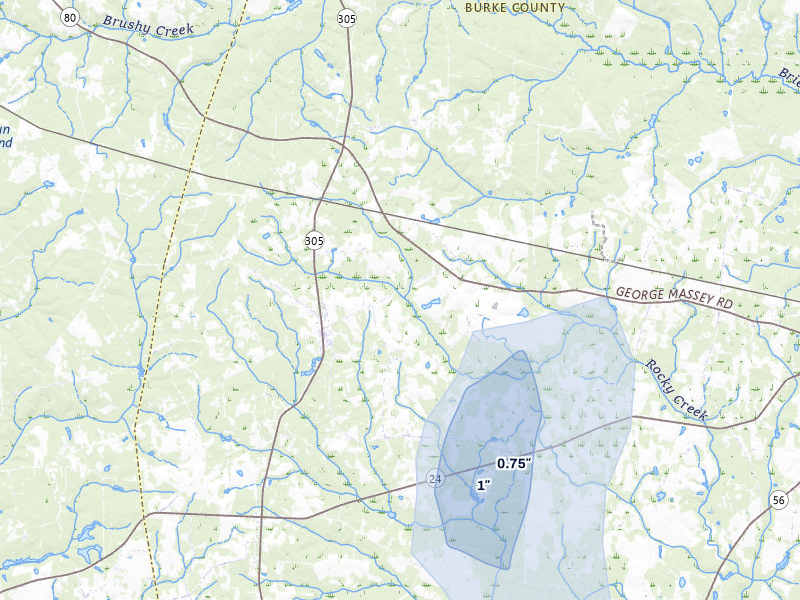
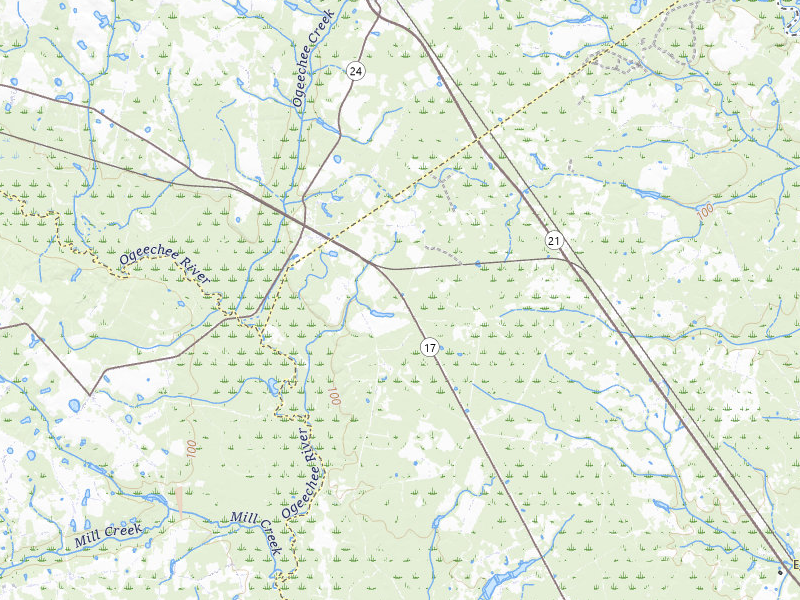
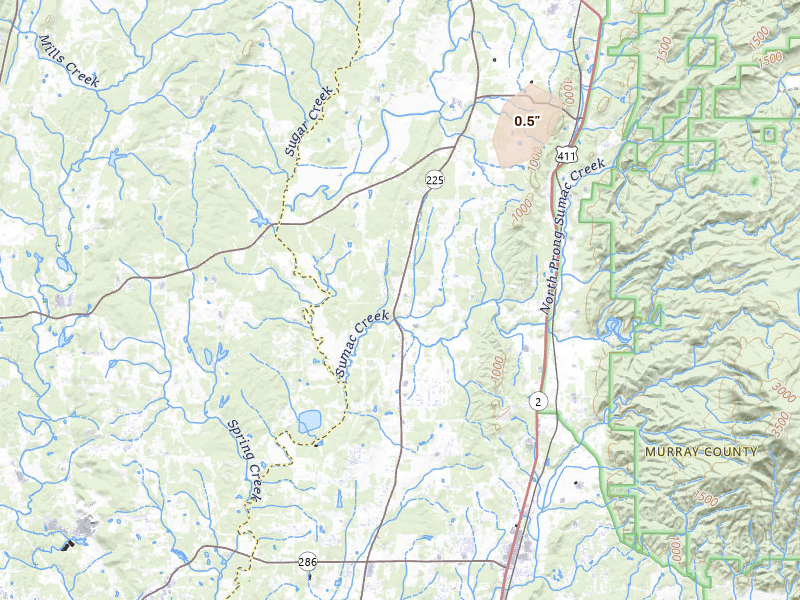
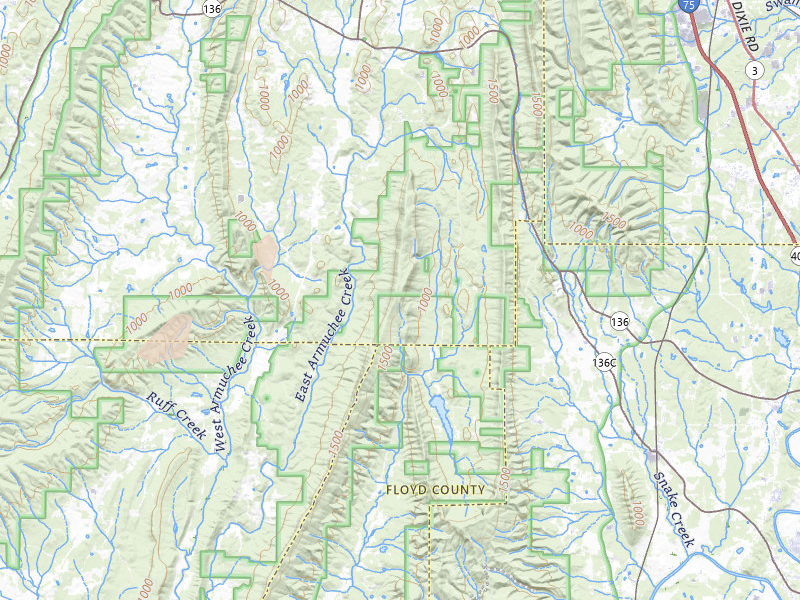
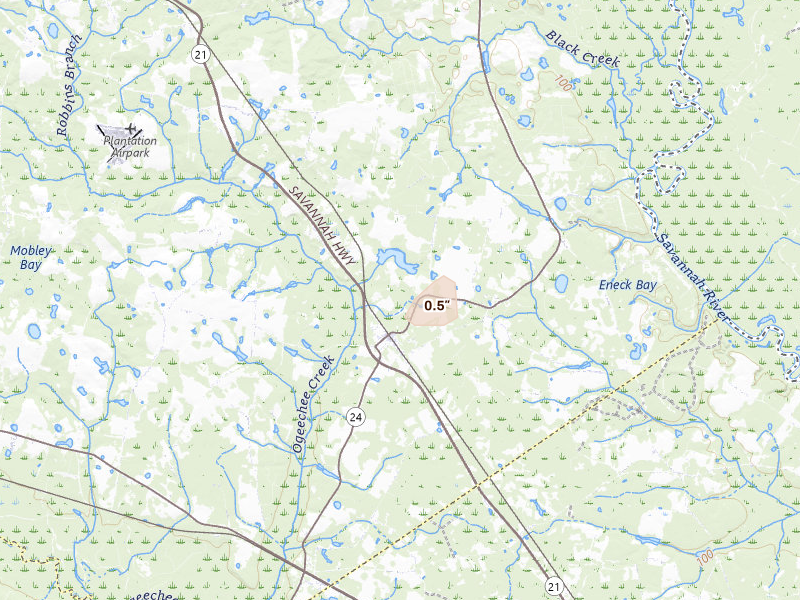
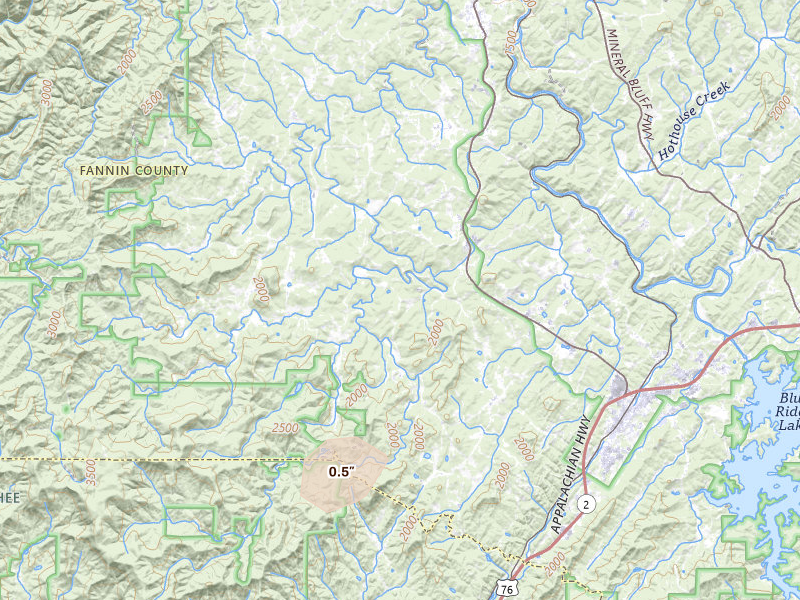
Georgia
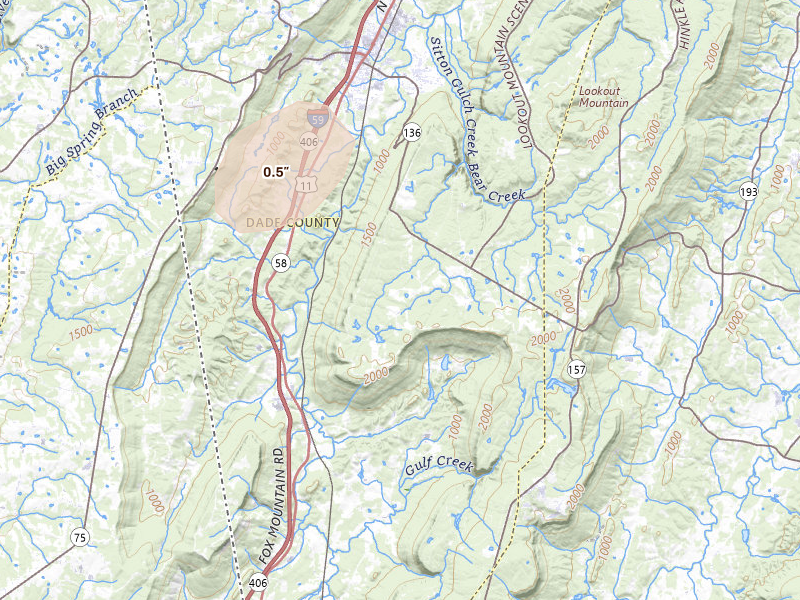
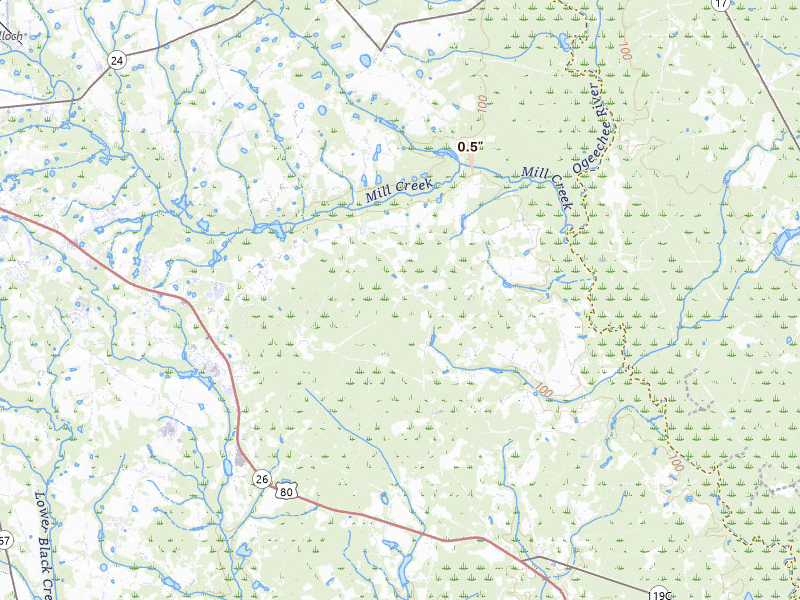
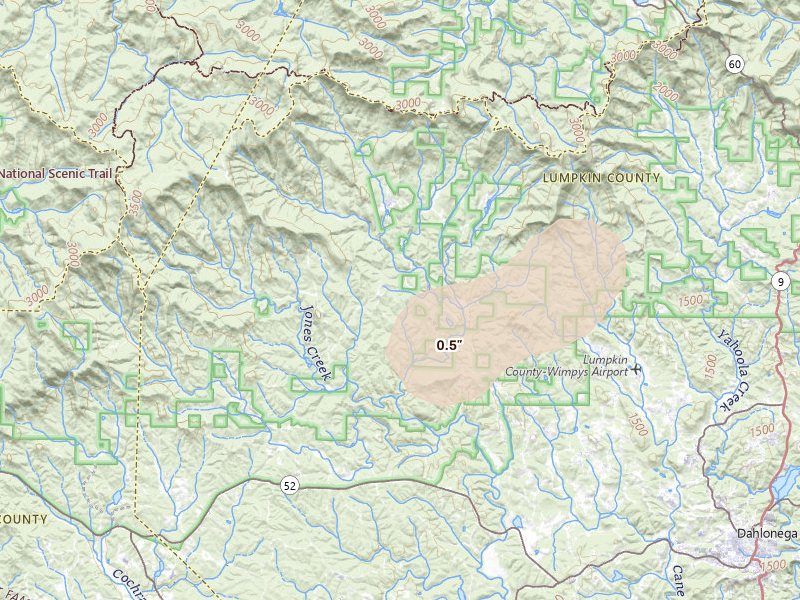
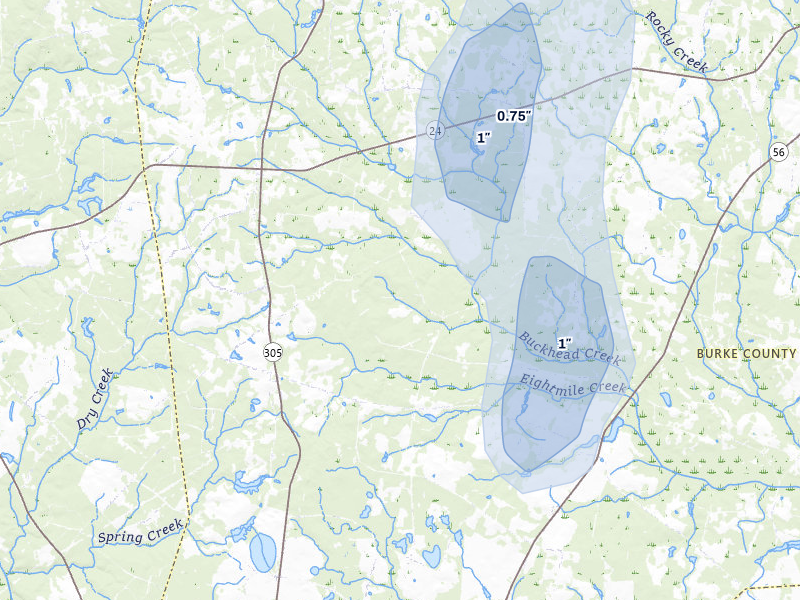
15 cities · up to 2.5" · 12,144 mapped homes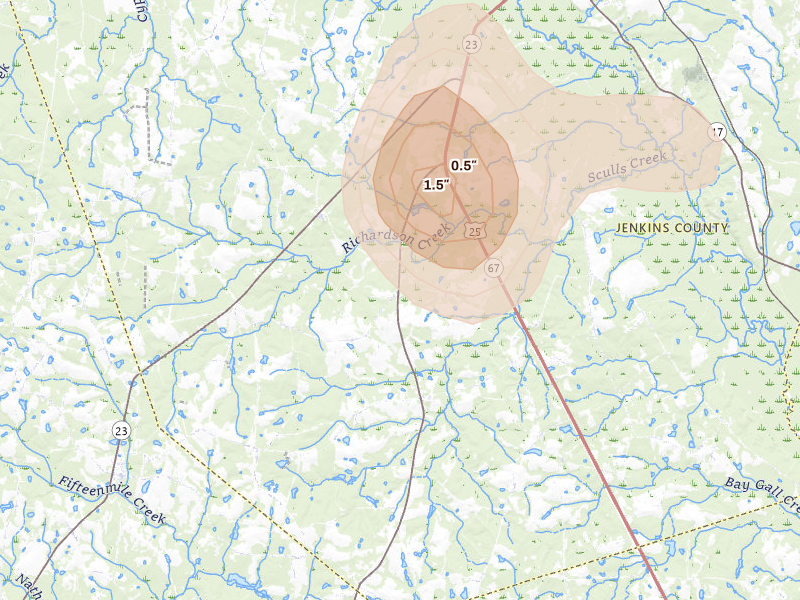
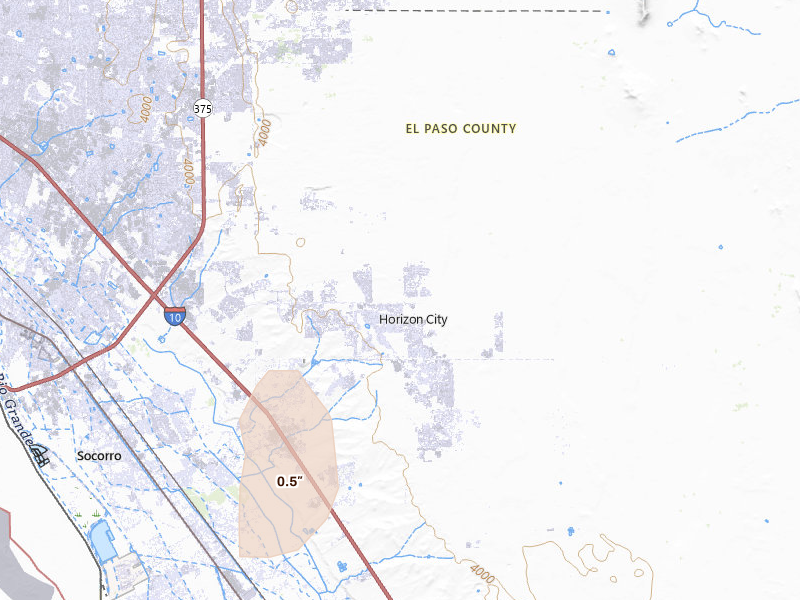
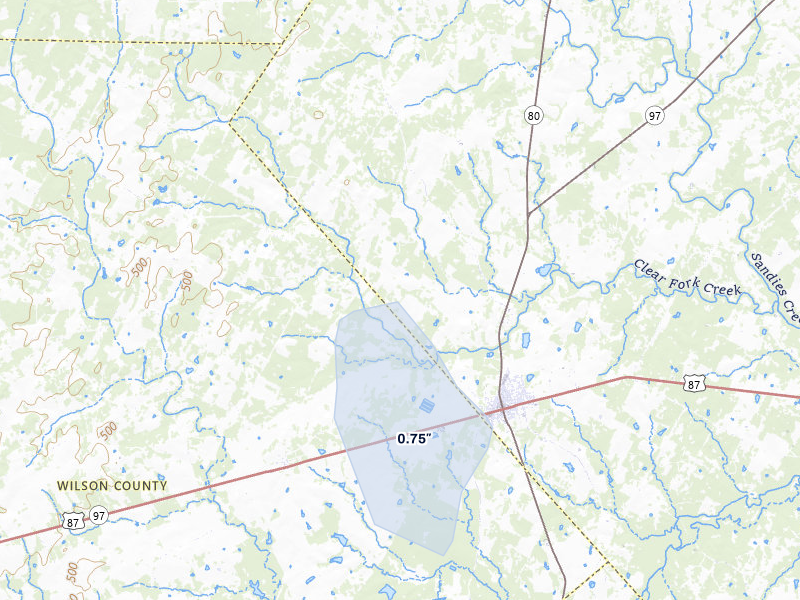
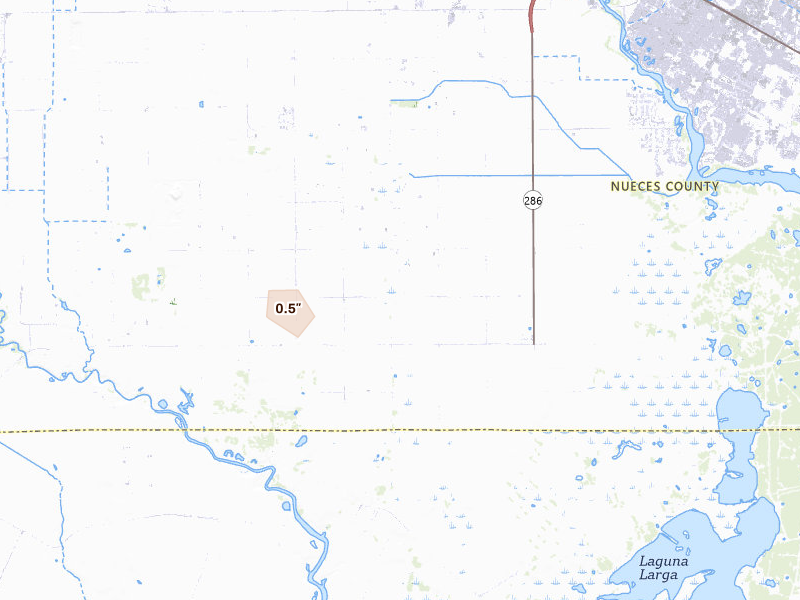
Texas
12 cities · up to 1.75" · 6,665 mapped homes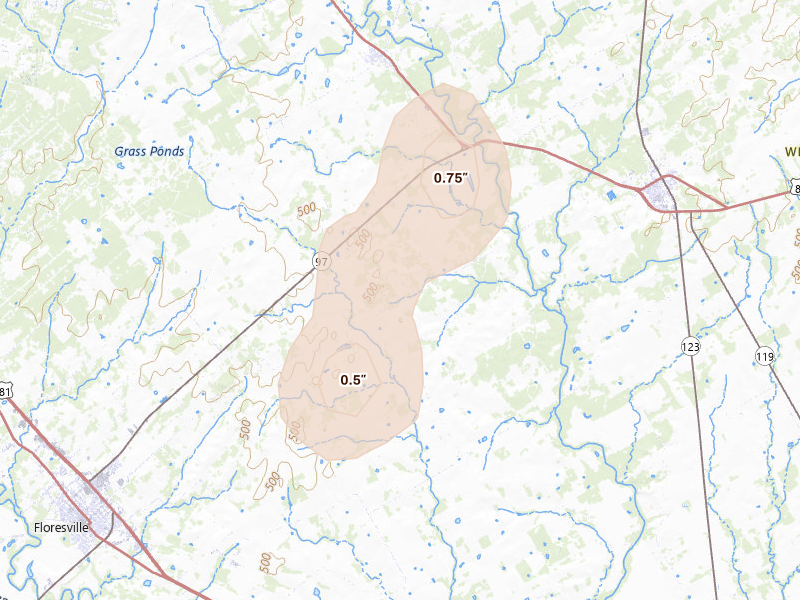
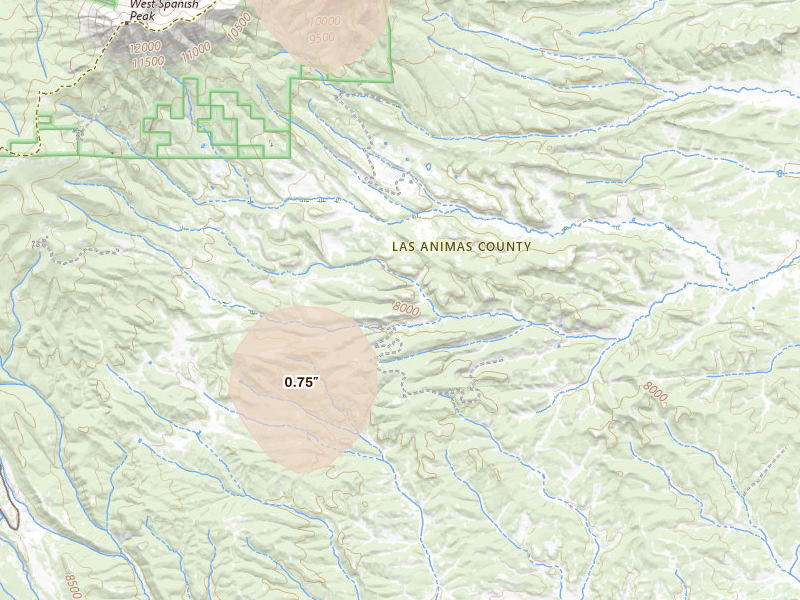
Colorado
2 cities · up to 1.75" · 35 mapped homes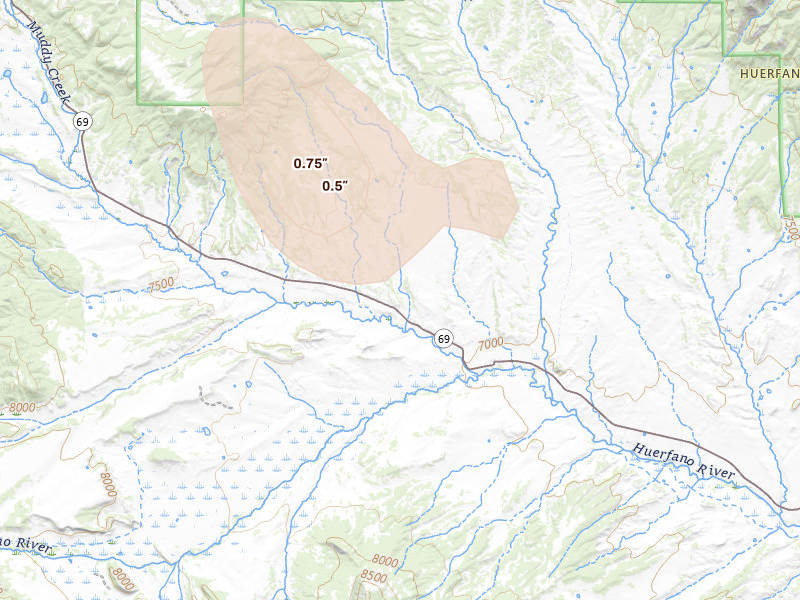
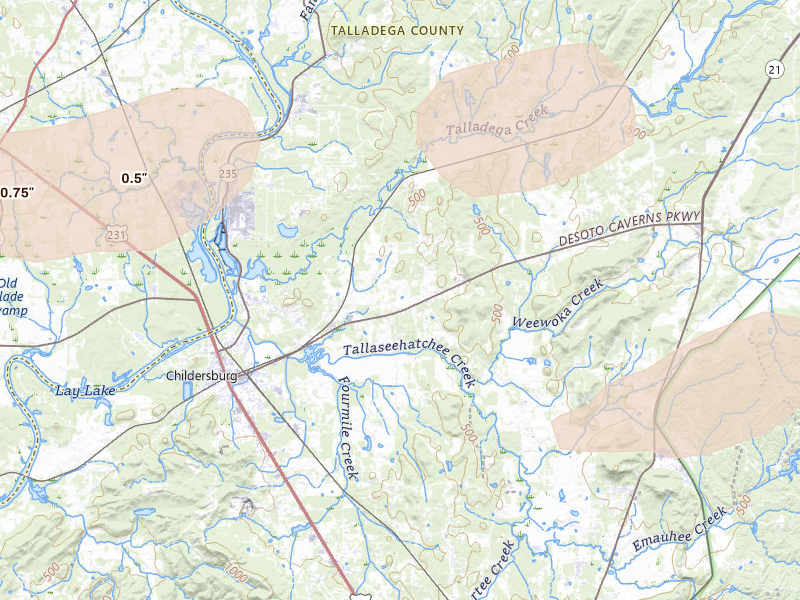
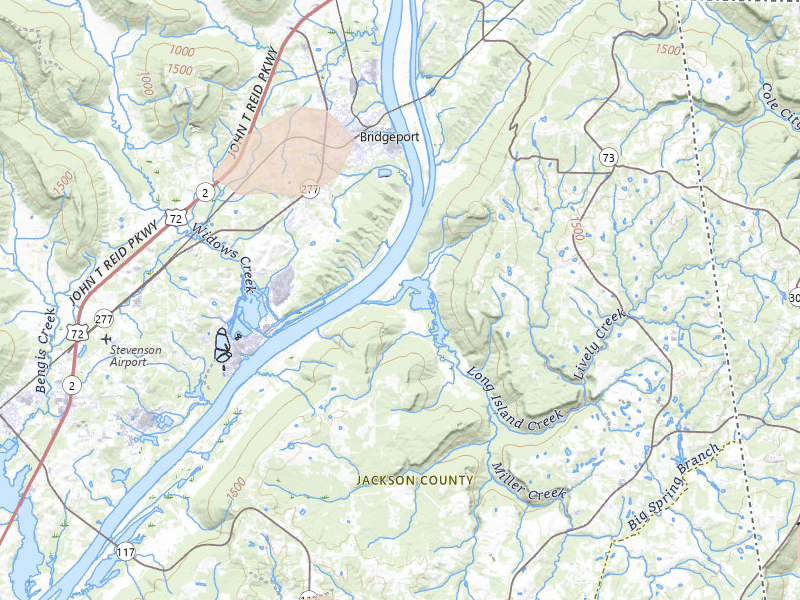
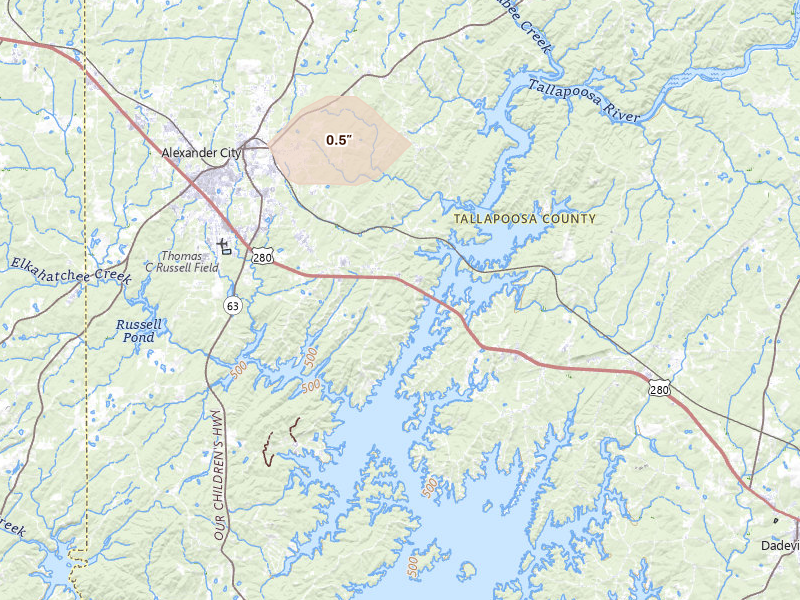
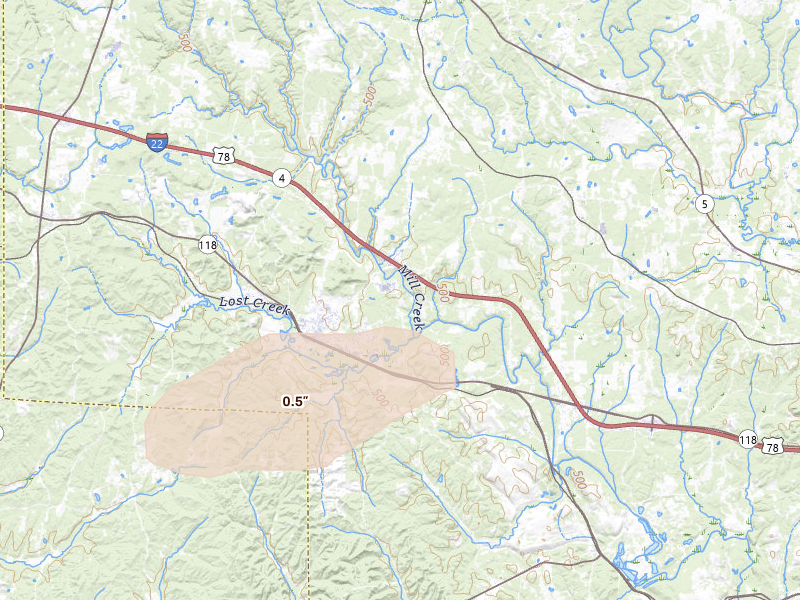
Alabama
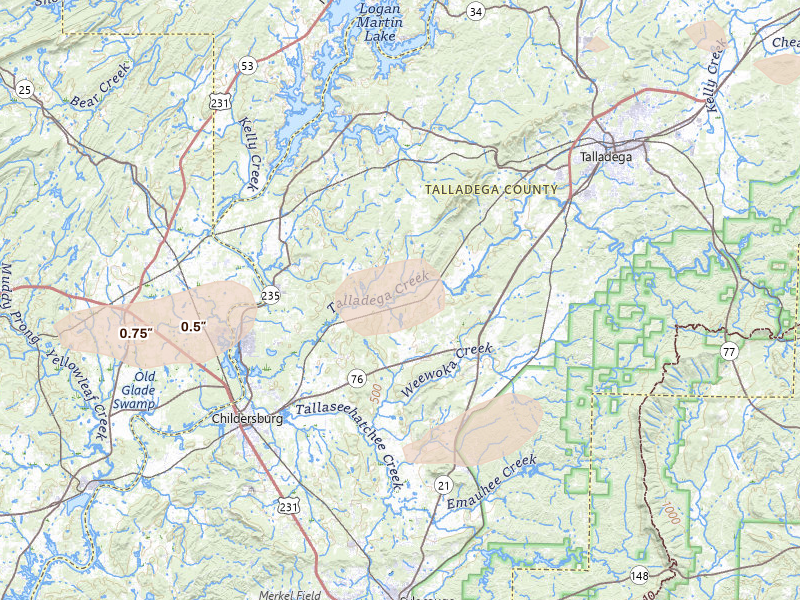
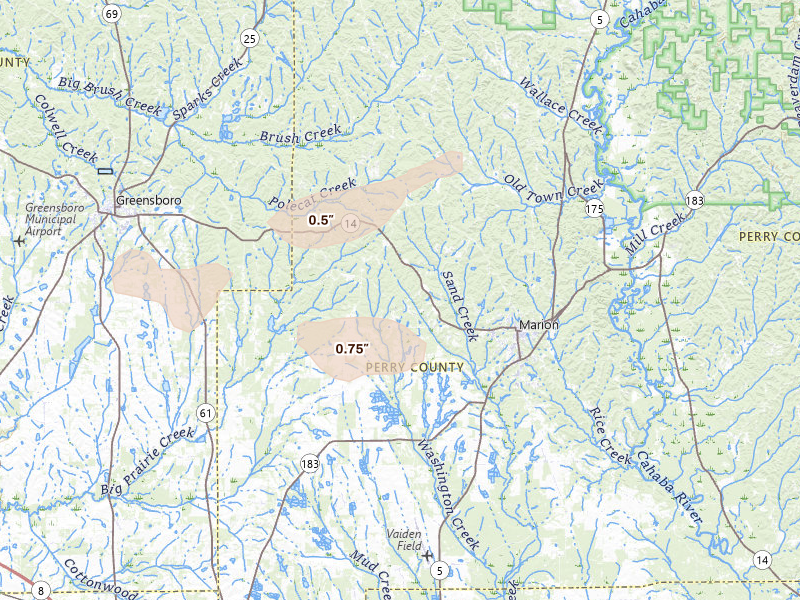
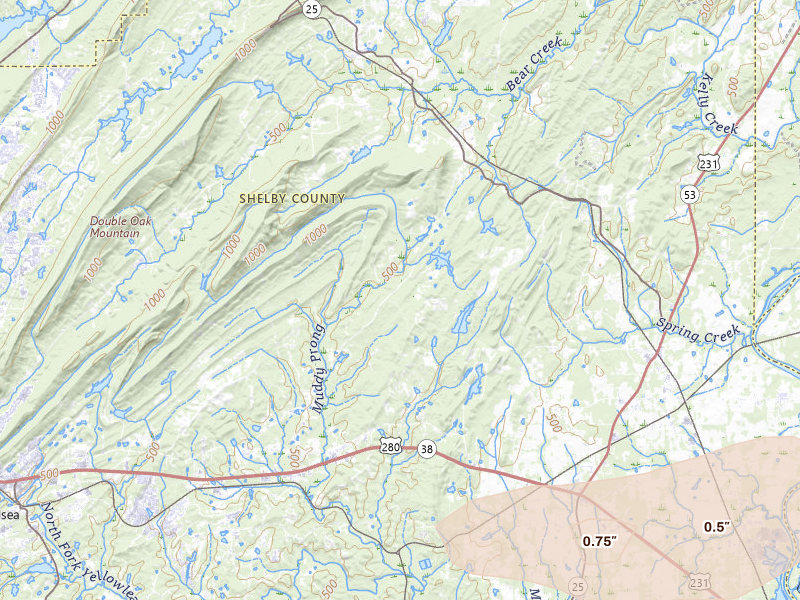
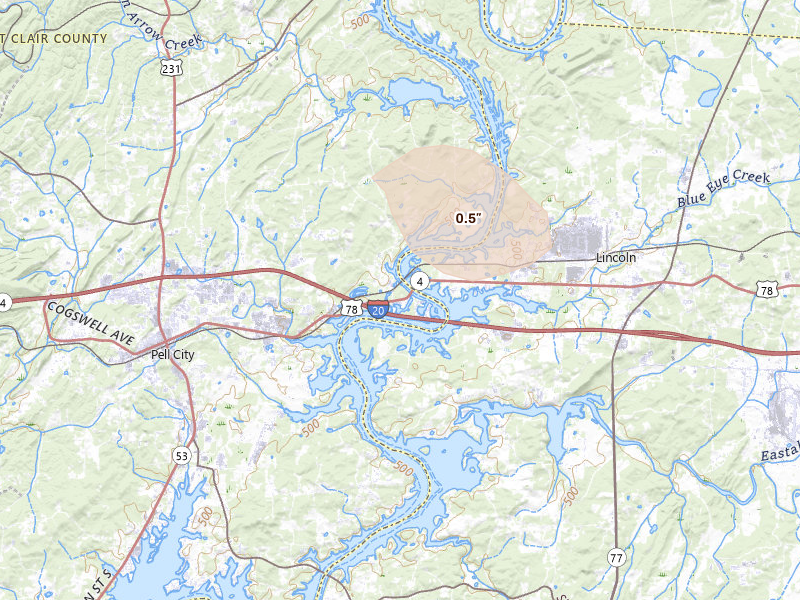
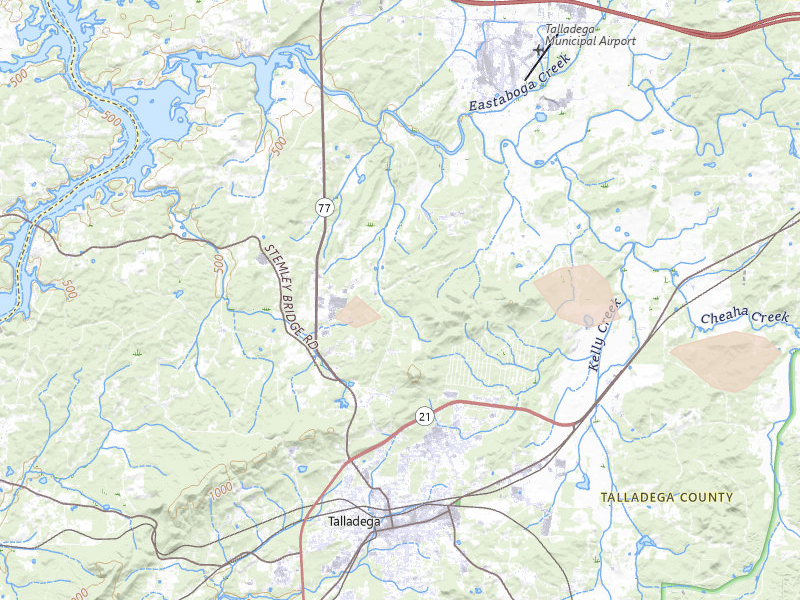
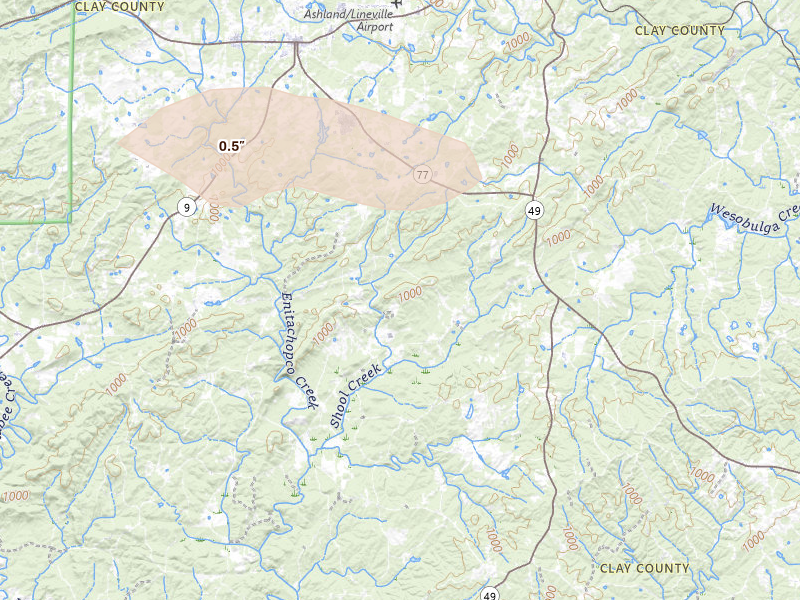
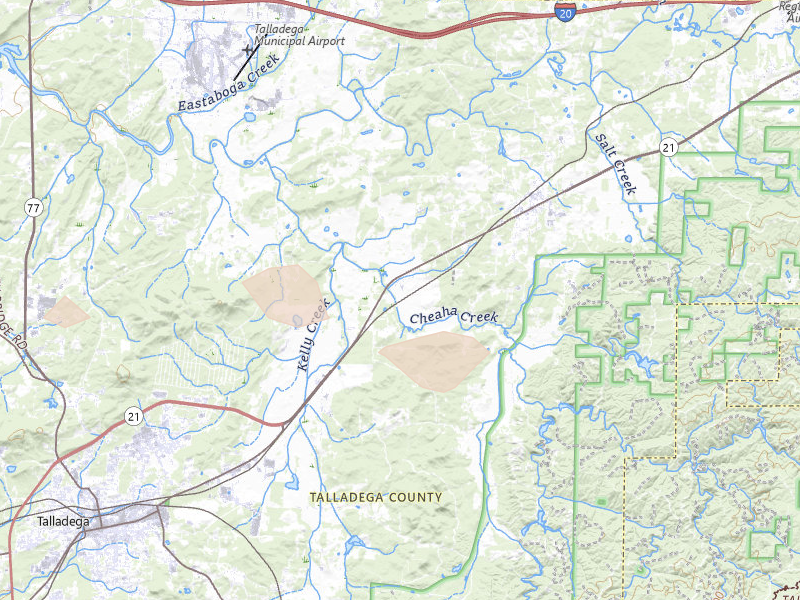
17 cities · up to 1.5" · 8,832 mapped homes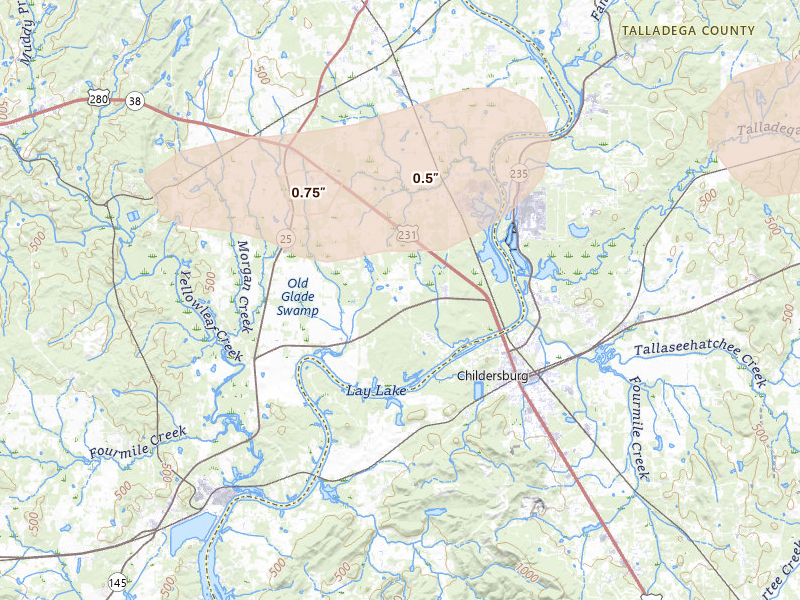
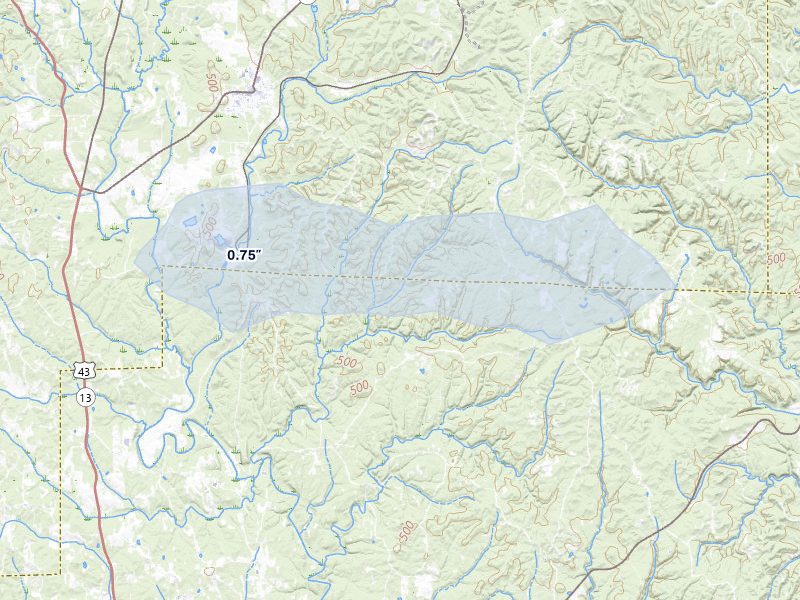
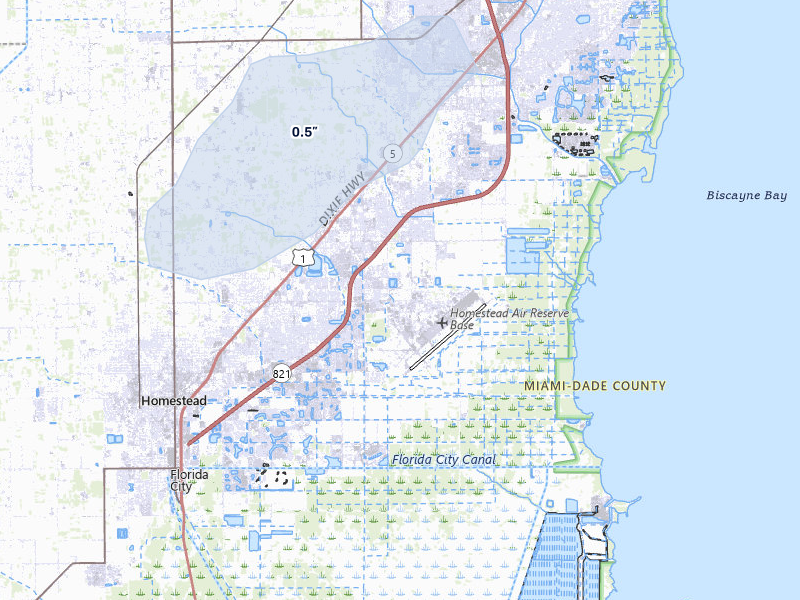
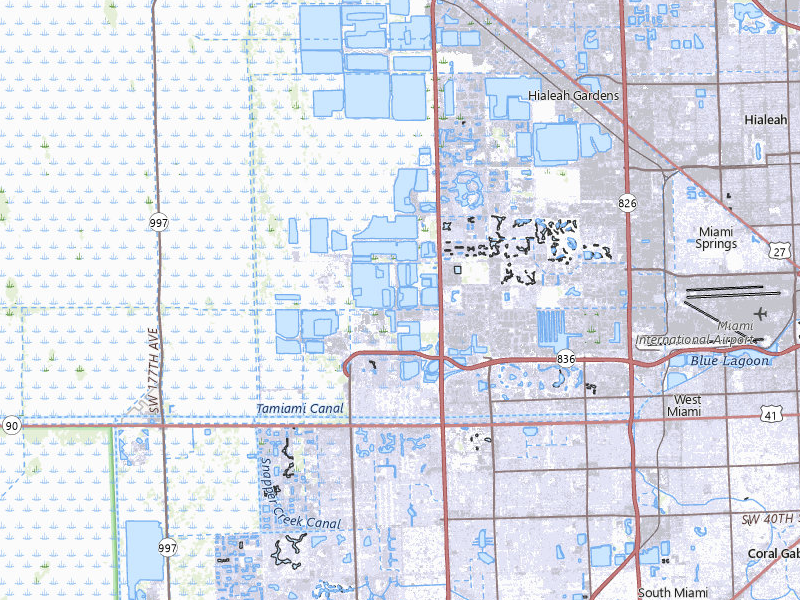
Florida
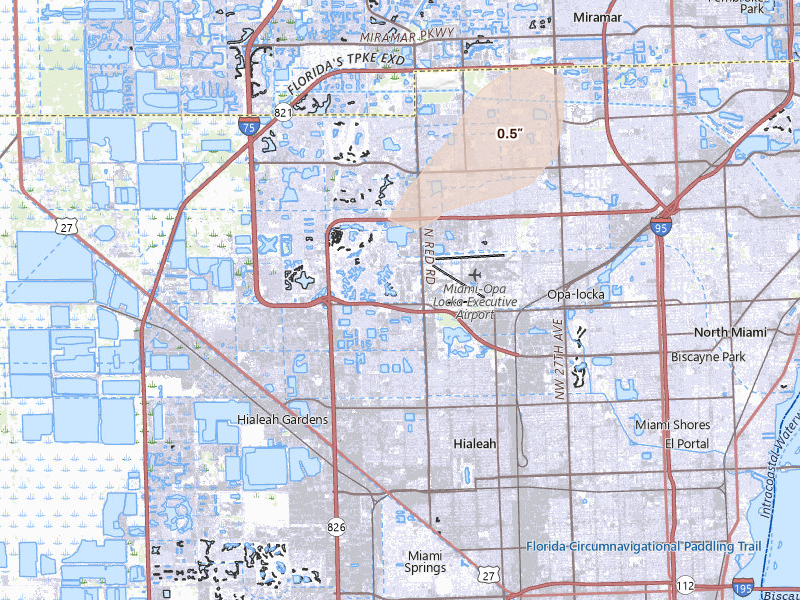
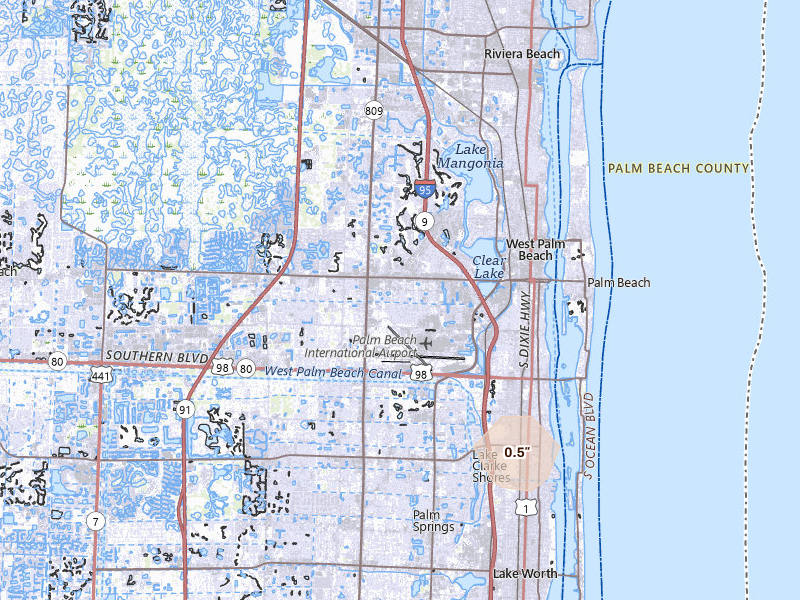
5 cities · up to 1.25" · 26,088 mapped homes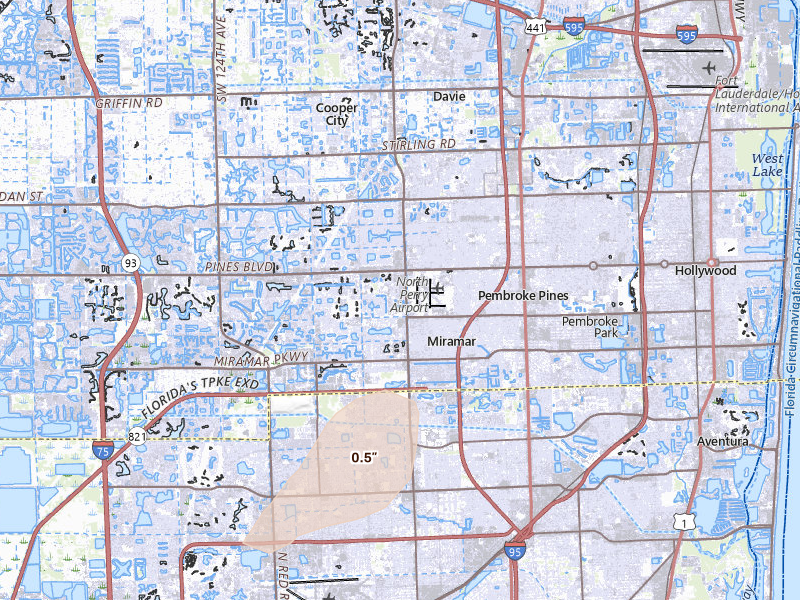
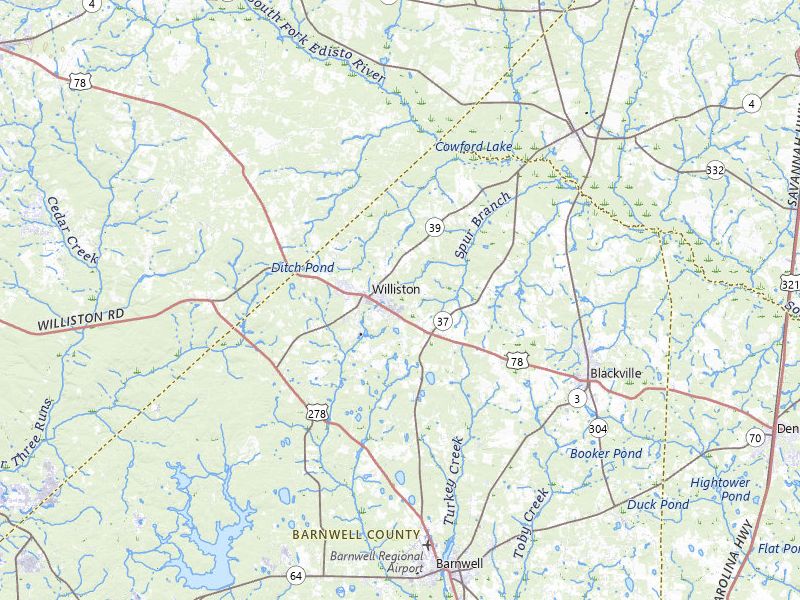
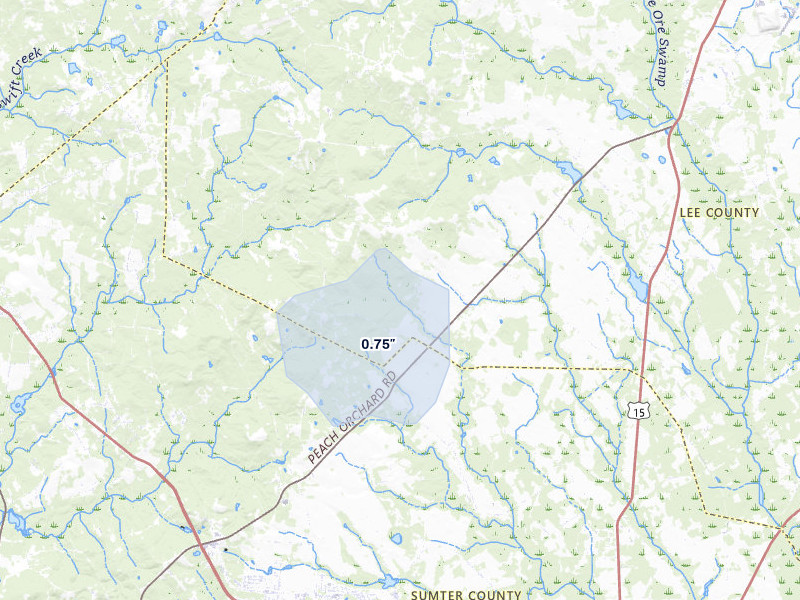
South Carolina
4 cities · up to 1.25" · 398 mapped homes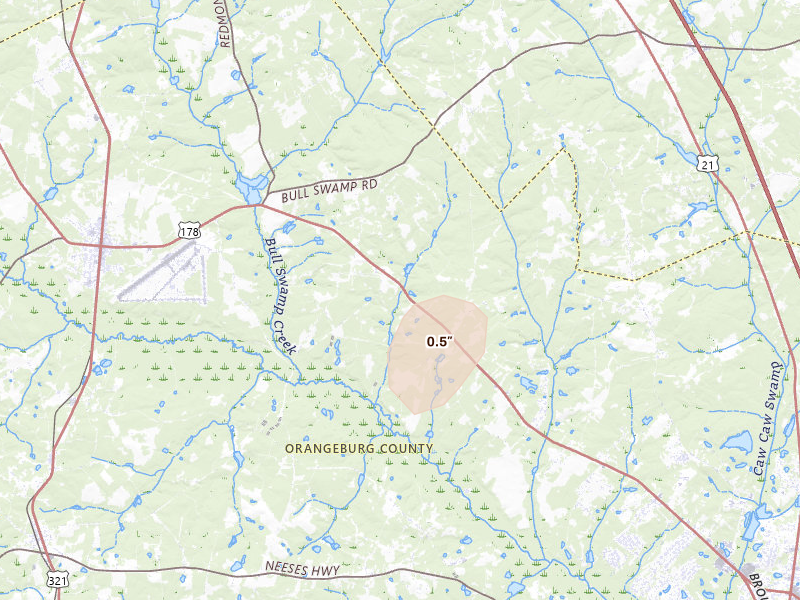
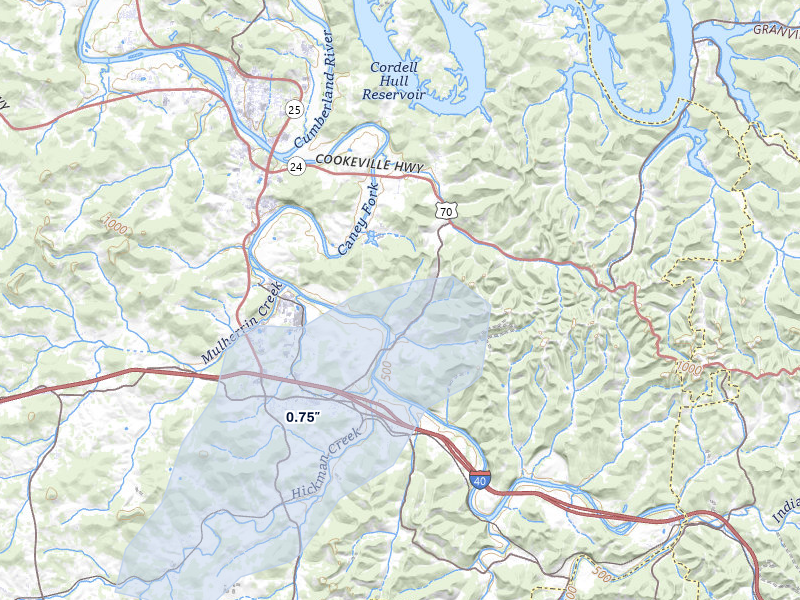
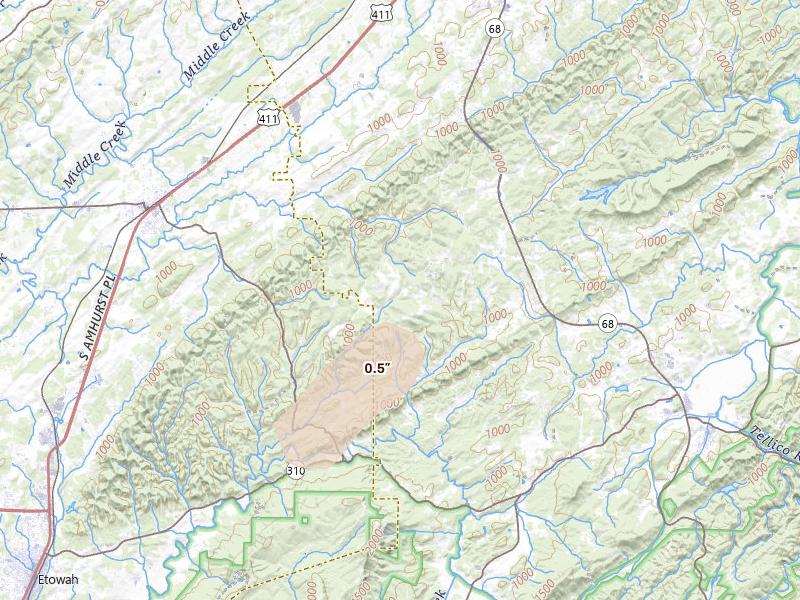
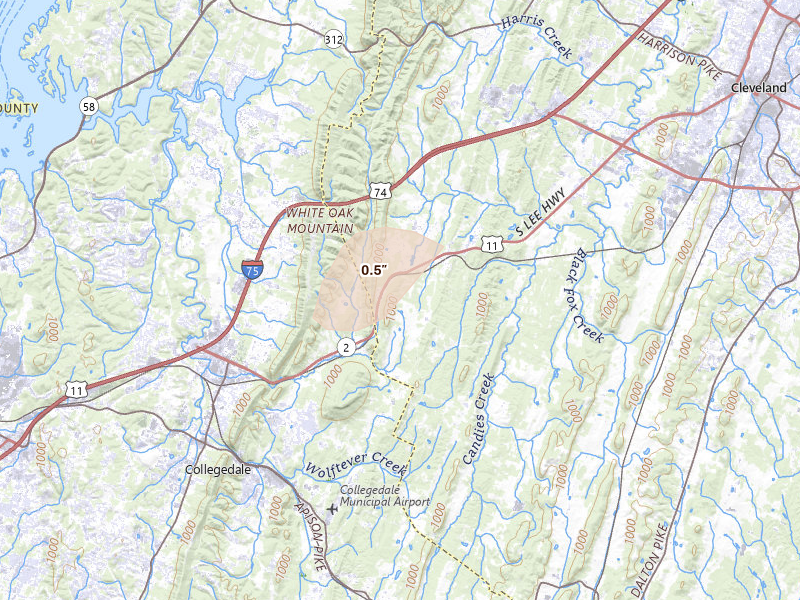
Tennessee
5 cities · up to 1" · 2,477 mapped homes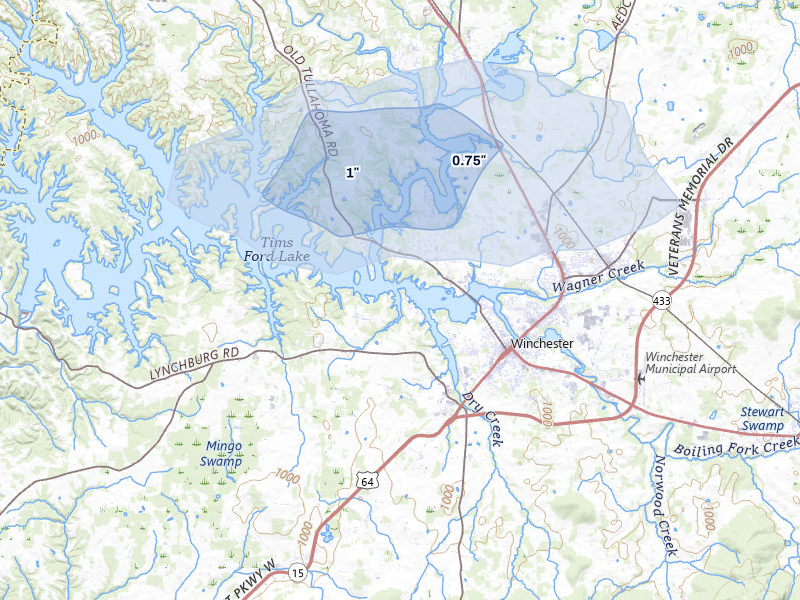
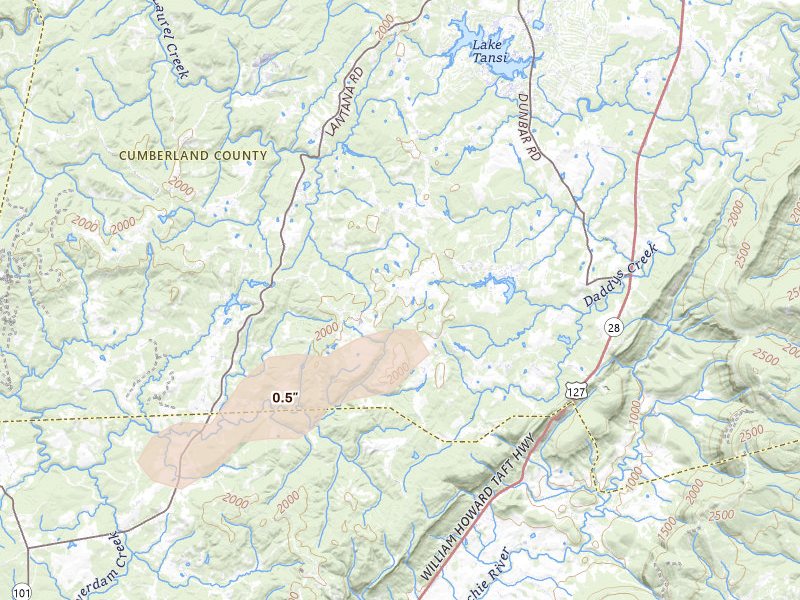
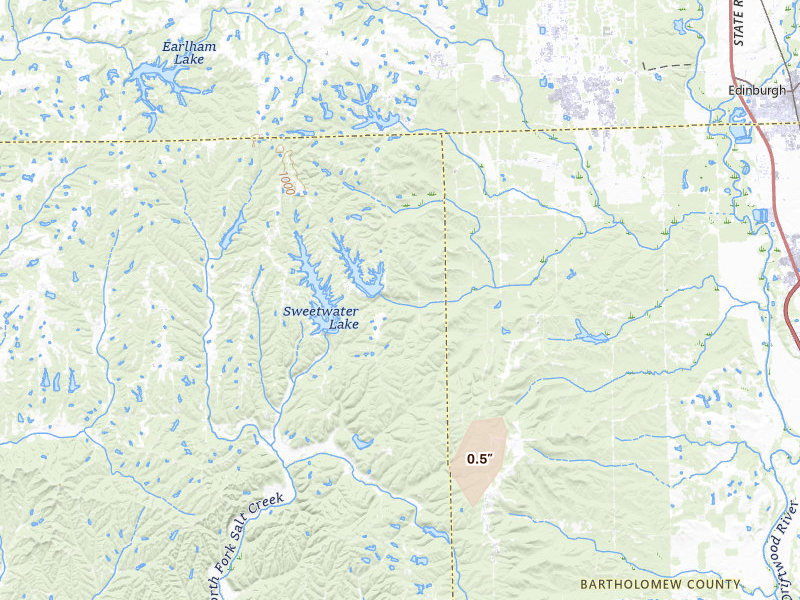
Indiana
2 cities · up to 1" · 41 mapped homes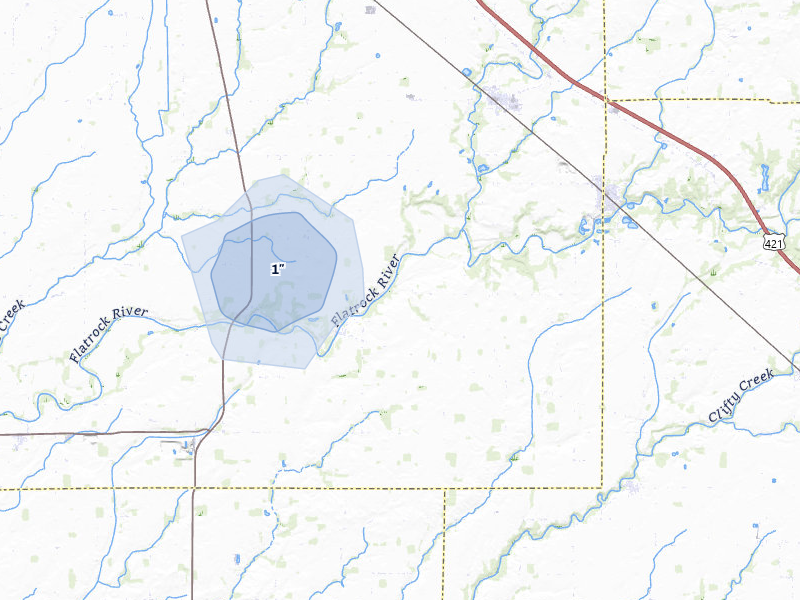
Kentucky
2 cities · up to 1" · 3 mapped homes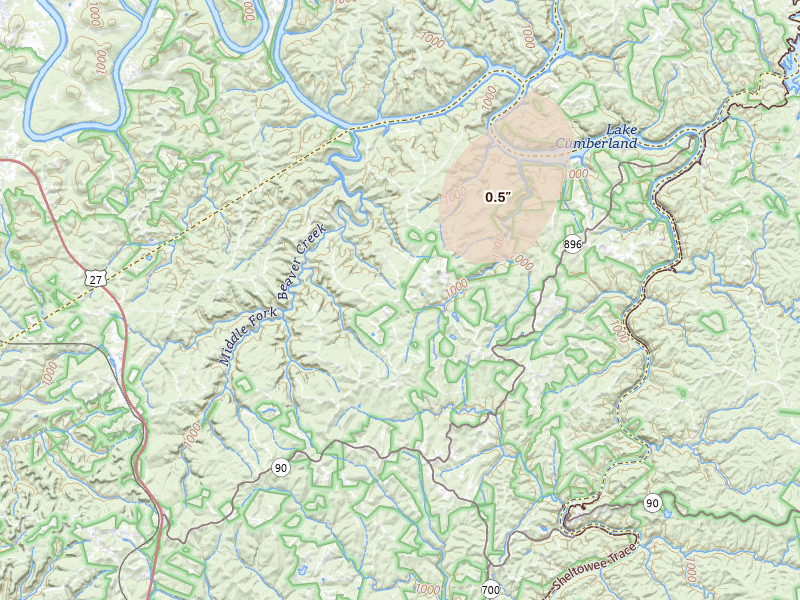
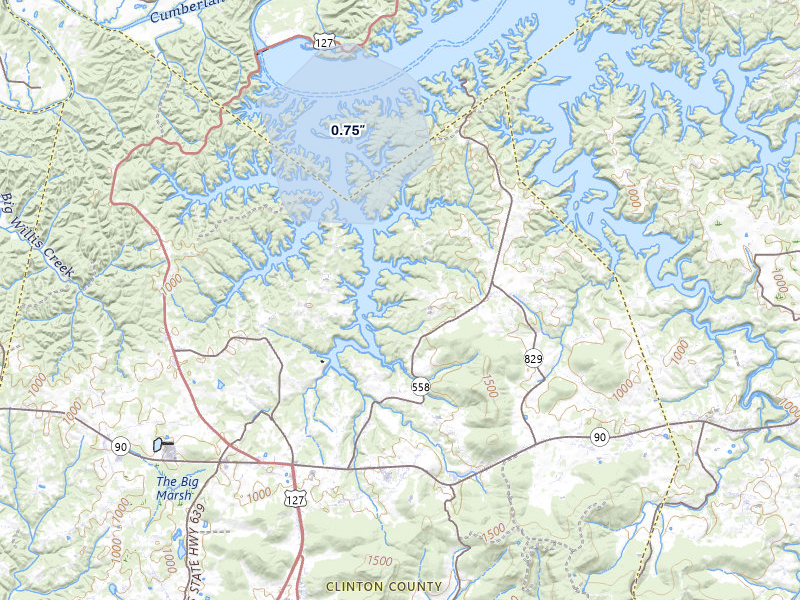
Arizona
2 cities · up to 1" · 0 mapped homes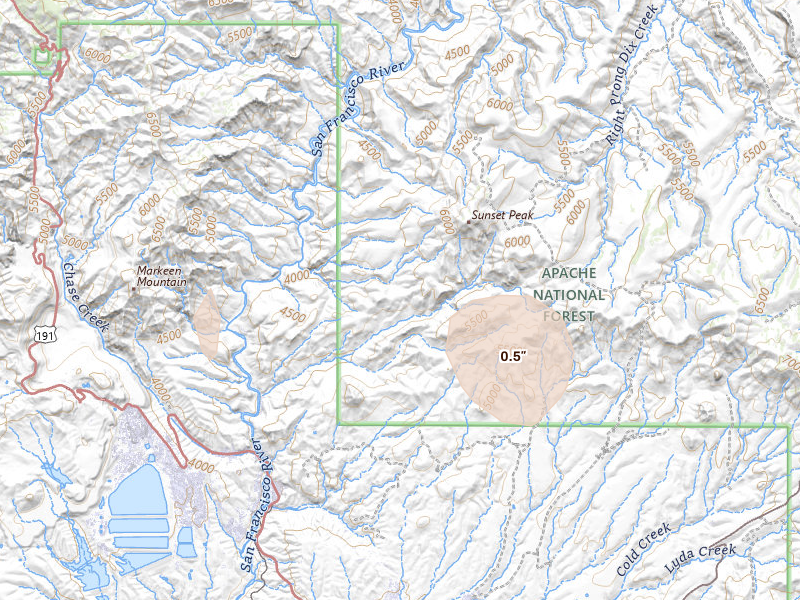
North Carolina
1 city · up to 0.75" · 123 mapped homes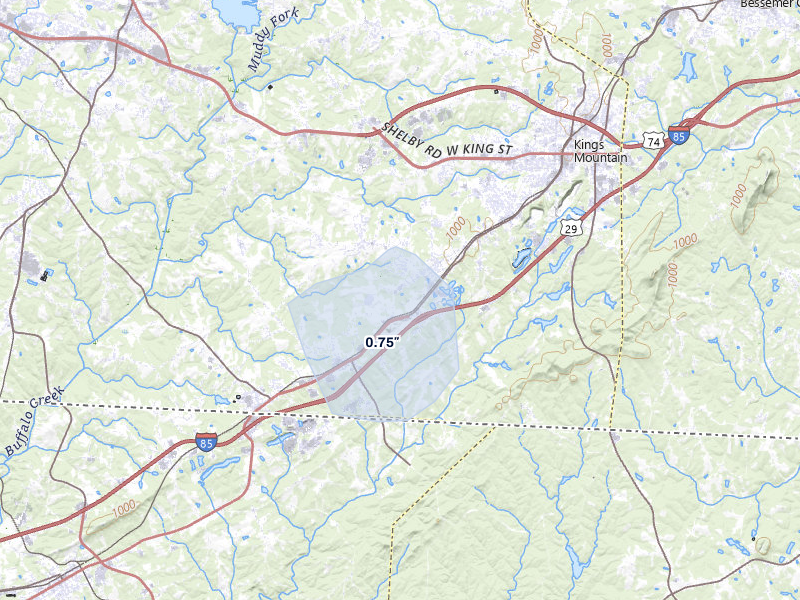
Pennsylvania
1 city · up to 0.5" · 86 mapped homes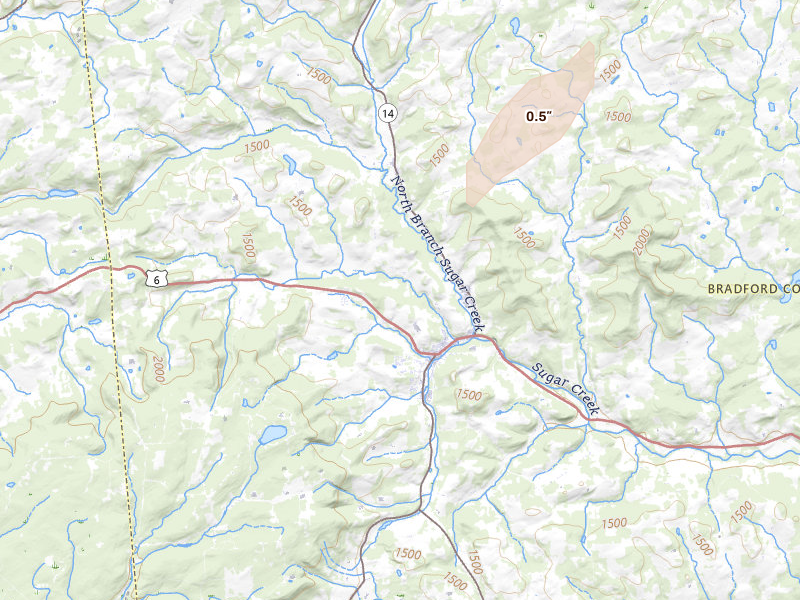
New York
1 city · up to 0.5" · 48 mapped homes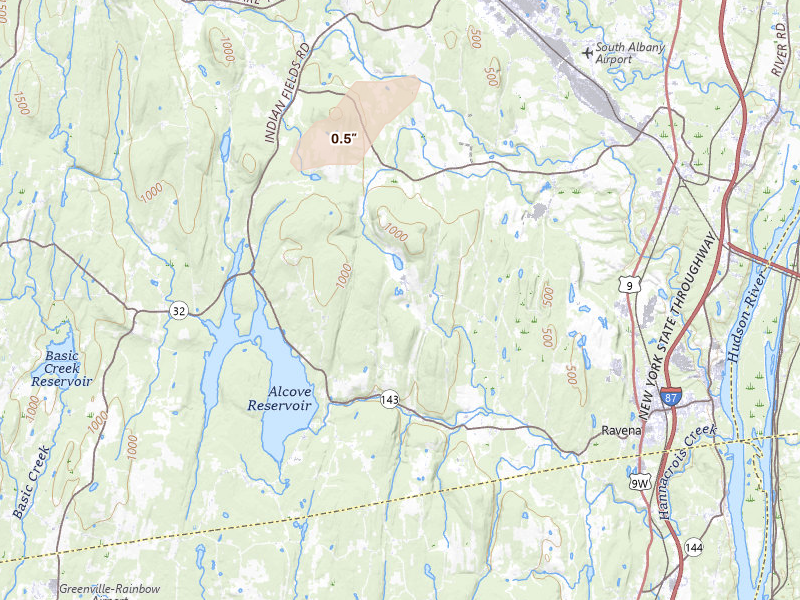
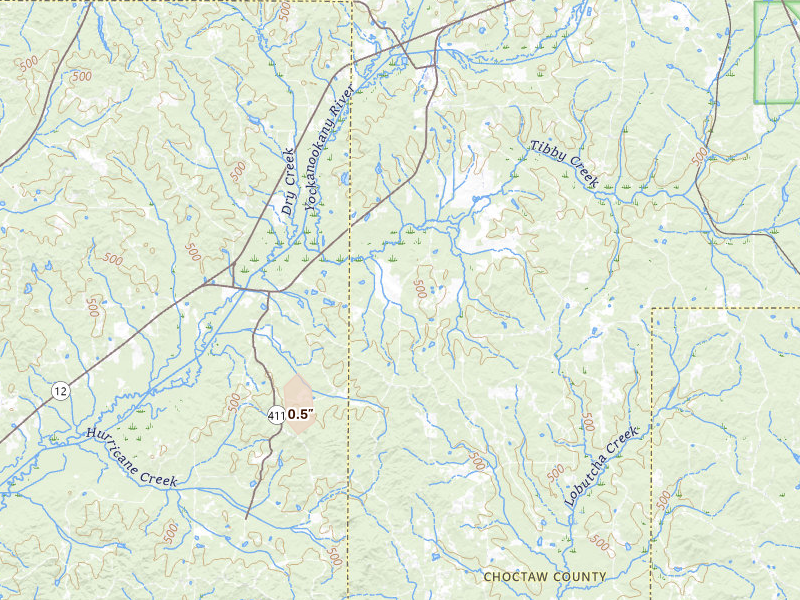
Mississippi
2 cities · up to 0.5" · 24 mapped homes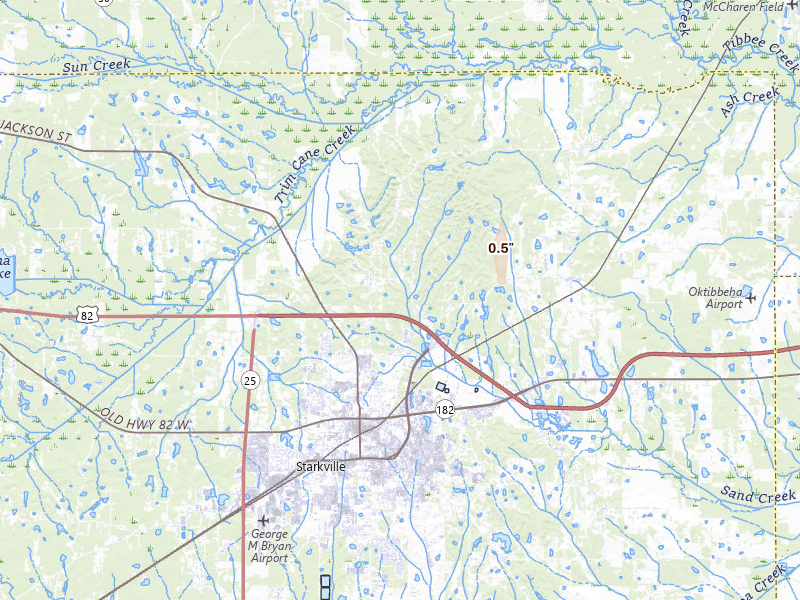
Montana
1 city · up to 0.5" · 0 mapped homes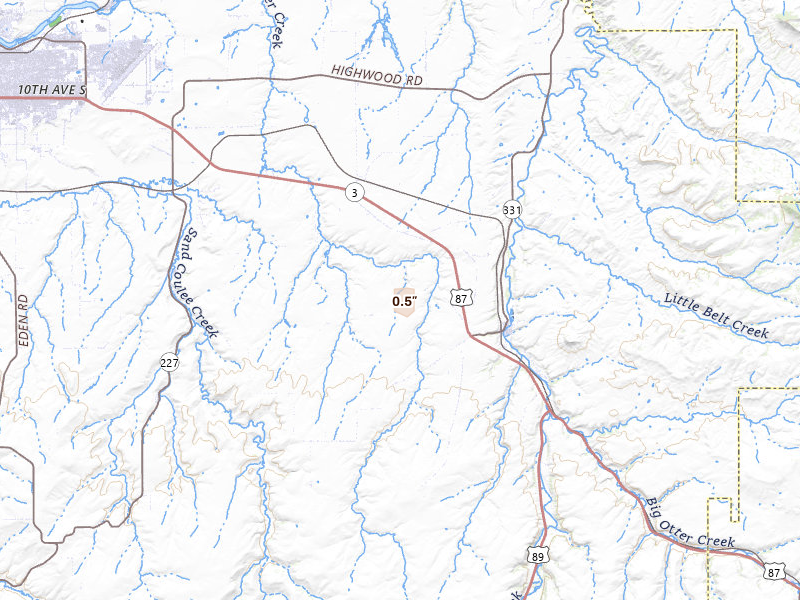
Overview Pro · iPhone + web
One app for your prospecting day.
The hail map, your next recommended area, and the tools to work it. Start on your own; the same subscription also includes access for up to 4 team members.
Overview Pro
One plan · iPhone + webMonthly · US App Store
$149.99 / month
5,000 new addresses per user each month on Pro. Put your 200 trial addresses to work before another week goes to guesswork.
Optional outreach
- + $0.21 per contact returned
- Available homeowner names and phone numbers, with freshness and DNC flags.
- + $0.75 per postcard mailed
- Print, postage, and delivery tracking included.
What's included
Get recommended places to prospect, or draw your own. The same plan gives you the tools to work either one.
- Hail maps, storm history, and live radar
- Curated prospecting recommendations and Quests
- Canvassing sessions and navigation
- Door outcomes, notes, and photos
- Visit history and follow-up Quests
- Alerts for your saved territories
- Polygon and hexagon draw tools
- Saved work areas and address lists
- CSV exports for your dialer or CRM
- XP, levels, and the leaderboard
- Access on iPhone and the web
- Up to 4 team members
7-day free trial in the iPhone app. No card required to start.
Choose whether to subscribe when your trial ends. Paid subscriptions renew monthly. Manage or cancel in your Apple Account settings.
See all pricing and billing details →Web trial: 7 days free. Card required. $150/month after the trial unless cancelled.
The next storm won’t wait for you.
Set your territory and alerts today. When hail hits, use Overview to choose your streets and get moving.
7-day free trial in the iPhone app. No card required to start.
For iPhone. Android coming soon.
Web trial: 7 days free. Card required. $150/month after the trial unless cancelled.