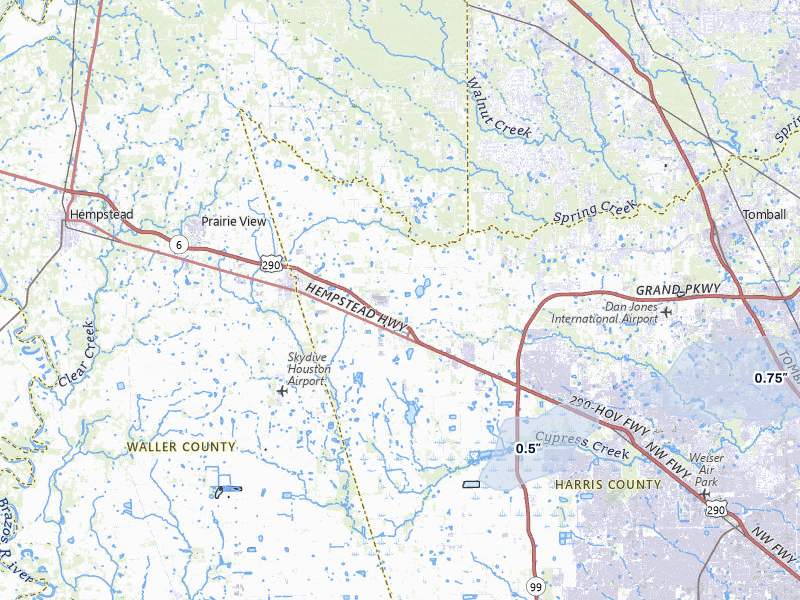
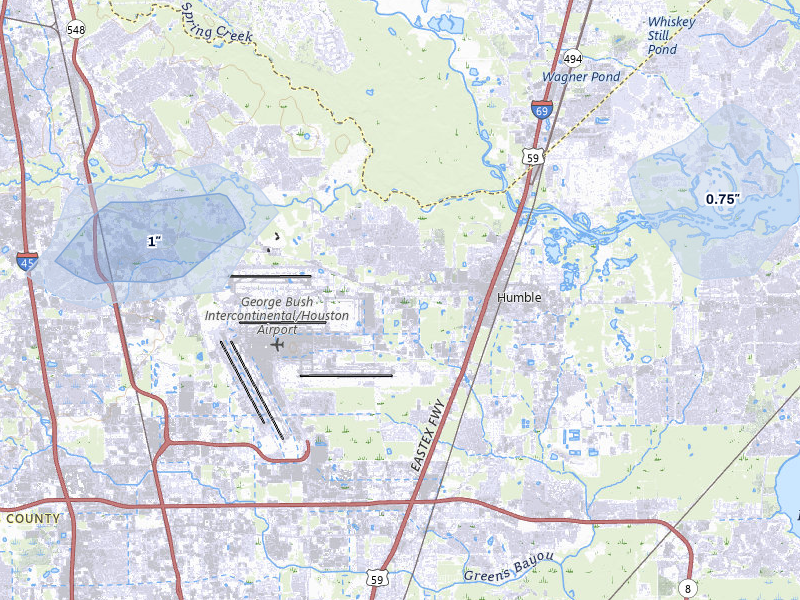
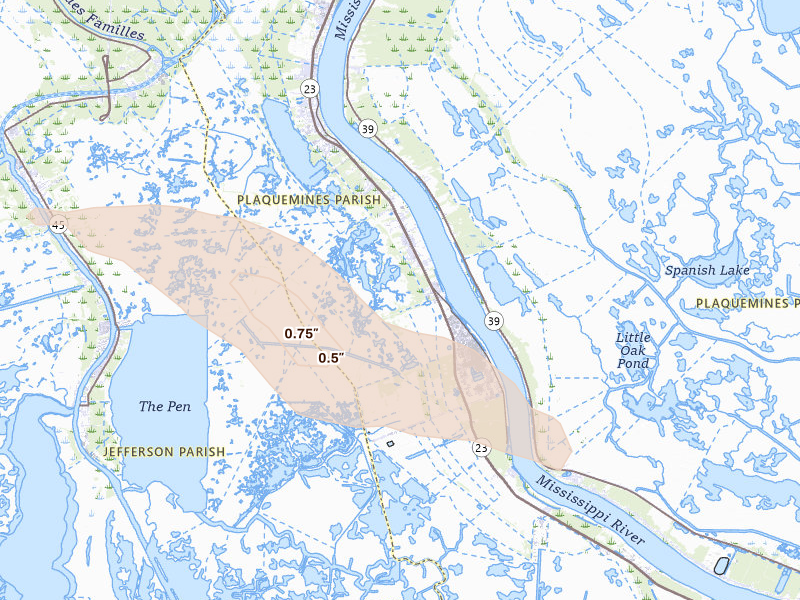
Hail storms on Apr 30, 2026

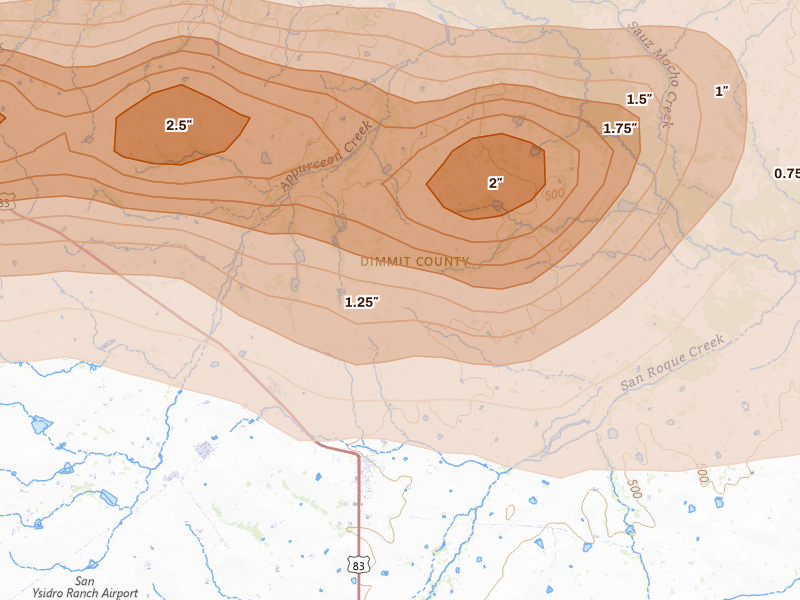
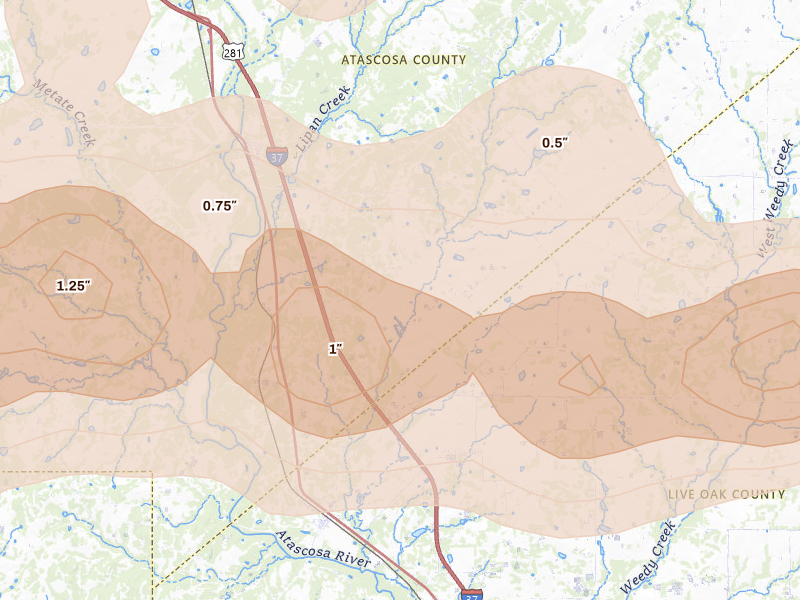
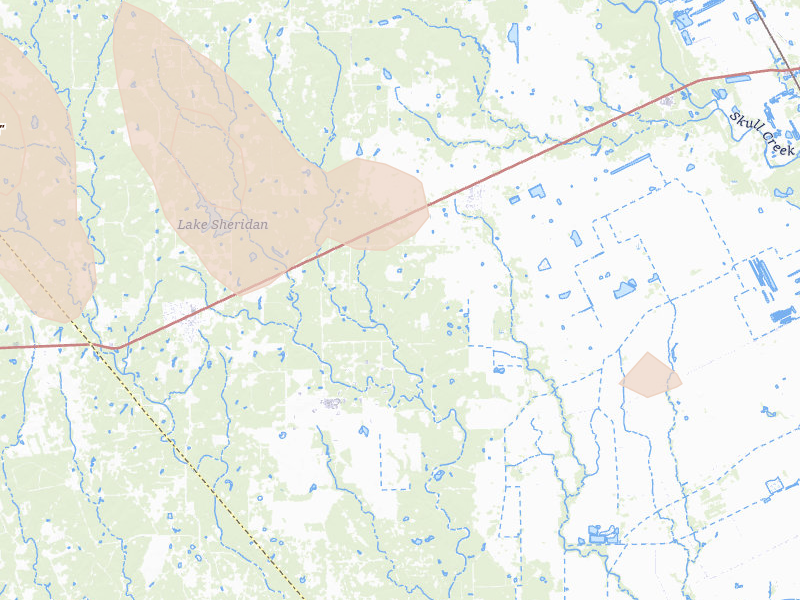
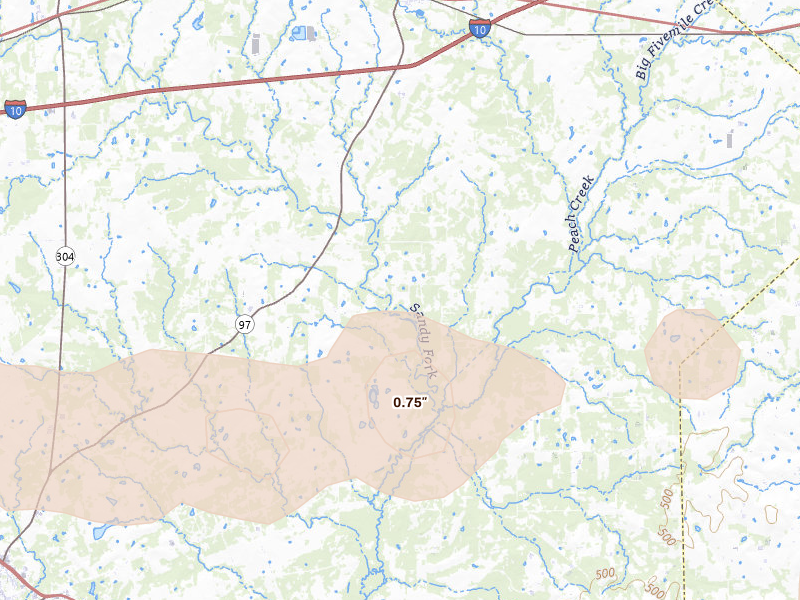
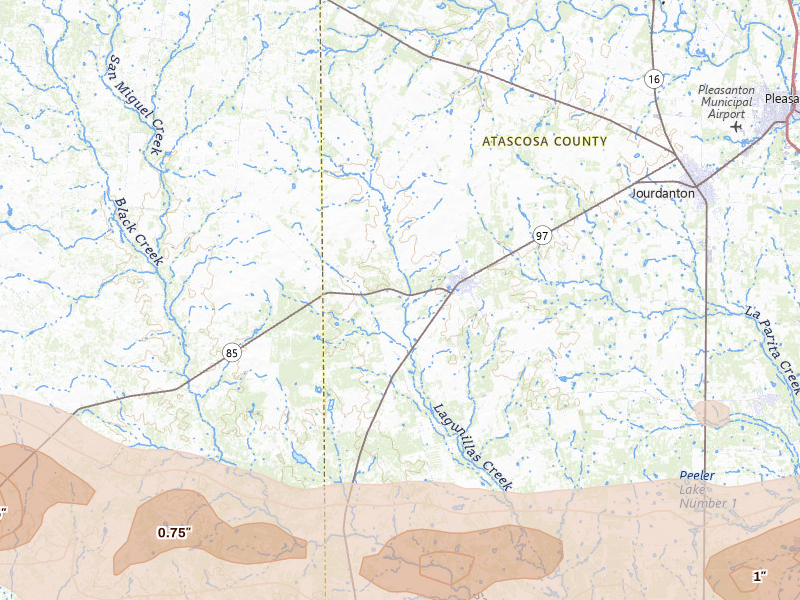
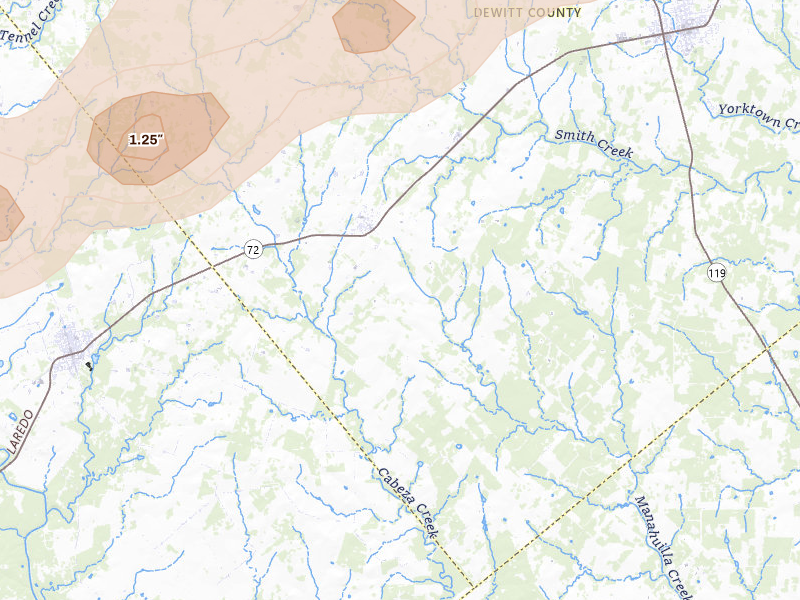
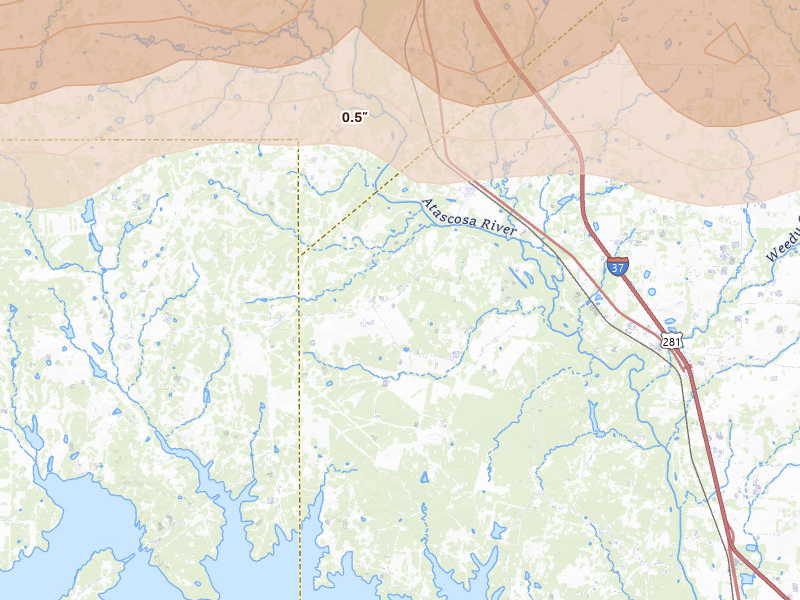
80 cities across 4 states recorded hail on Apr 30, 2026 — a multi-state outbreak. The peak radar-indicated size reached 4" over Carrizo Springs — about the size of a softball or larger. That is a severe hail signal, not property-level damage confirmation.

Download on the App Store

7-day free trial in the iPhone app. No card required to start.

For iPhone. Android coming soon.

Web trial: 7 days free. Card required. $150/month after the trial unless cancelled.

Cities hit 80 across 4 states
Peak hail signal 4" ≈ softball or larger · Carrizo Springs
Homes in footprints 250,489
Ground reports 23

Apr 30, 2026 · Carrizo Springs, TX: 4" peak radar signal · NEXRAD + radar-estimated size maps

Mapped cities, by state

Every tracked city with a hail signal on Apr 30, 2026

80 cities · up to 4" · 250,489 mapped homes · noon-to-noon UTC

Every tracked city that recorded hail on this convective day, biggest signal first. Each row opens that city's full storm record.

How to read this day

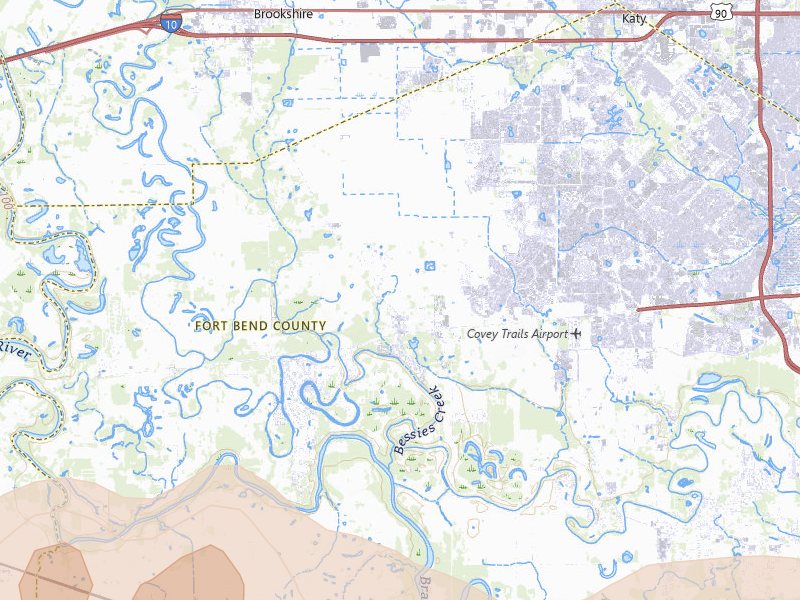
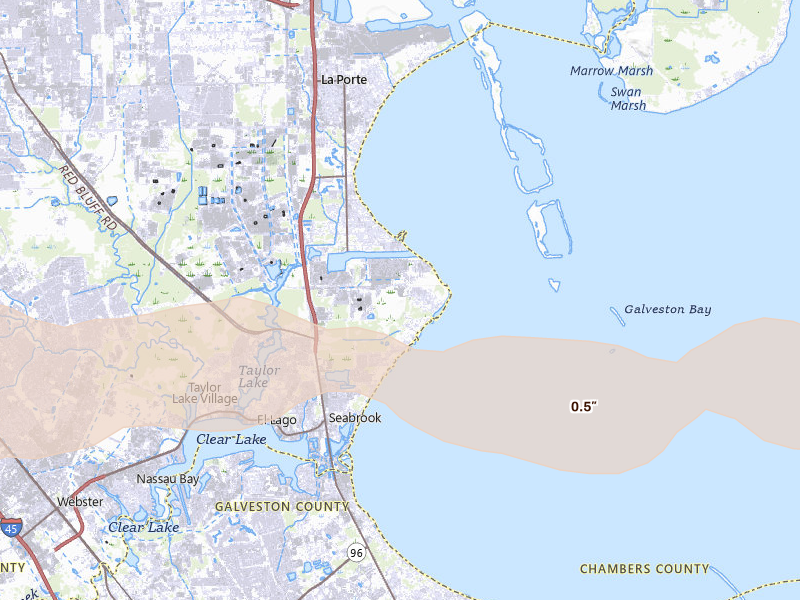
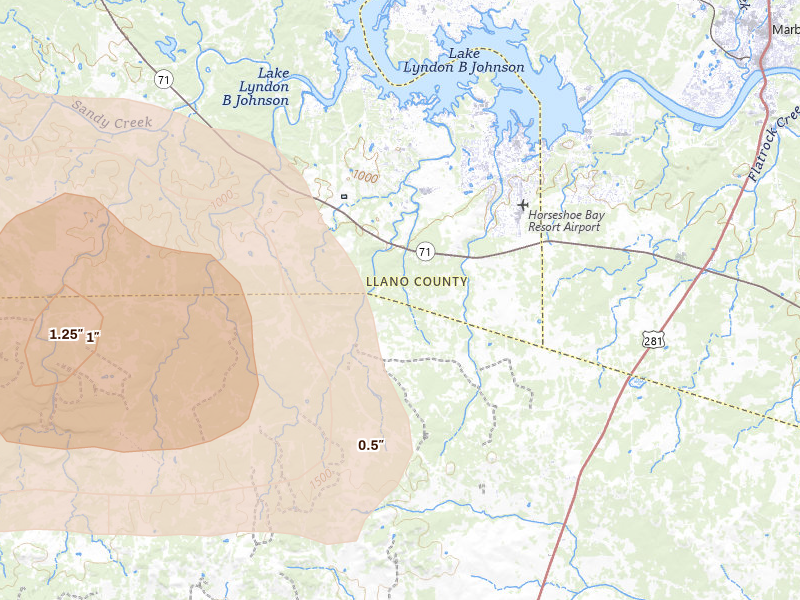
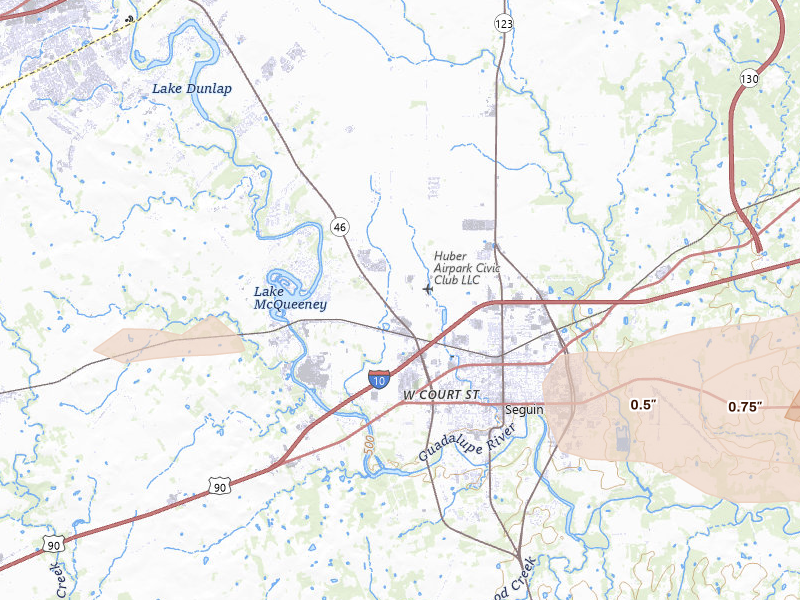
A storm day on Overview is a convective day — it runs from noon to noon UTC, so late-night hail is grouped with the afternoon storm that spawned it rather than split across two calendar dates. Everything below happened inside the Apr 30, 2026 convective day. Across those footprints sit roughly 250,489 homes, and 23 ground reports were filed with the National Weather Service.

The cities are listed with the biggest storm first, measured by Overview's severity score. Each row links through to that city's own storm page, where you'll find the radar surfaces, every ground report filed, and the hail footprint drawn on the map.

The counts here are the size of the set of cities Overview tracks — never "every US city" — so read a quiet day as "quiet among the places we watch," not as proof nothing happened elsewhere.

Texas

75 cities · up to 4" · 249,384 mapped homes
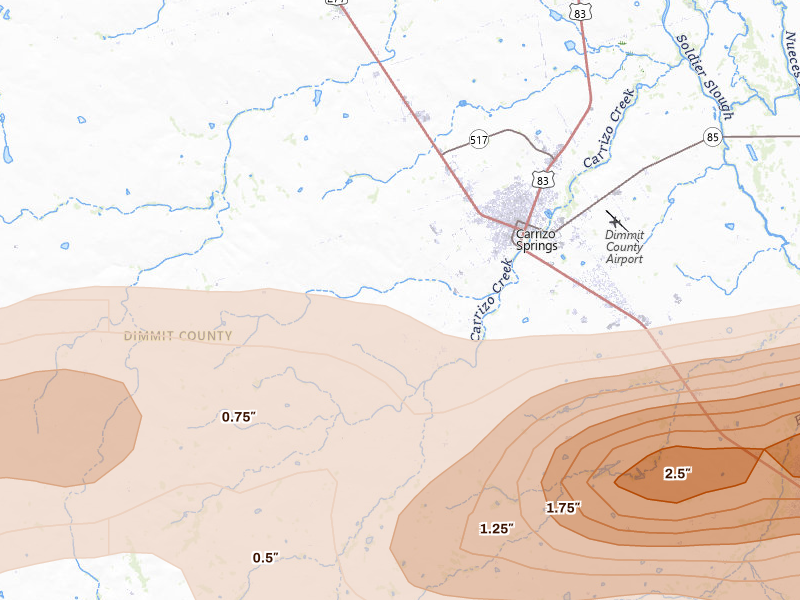
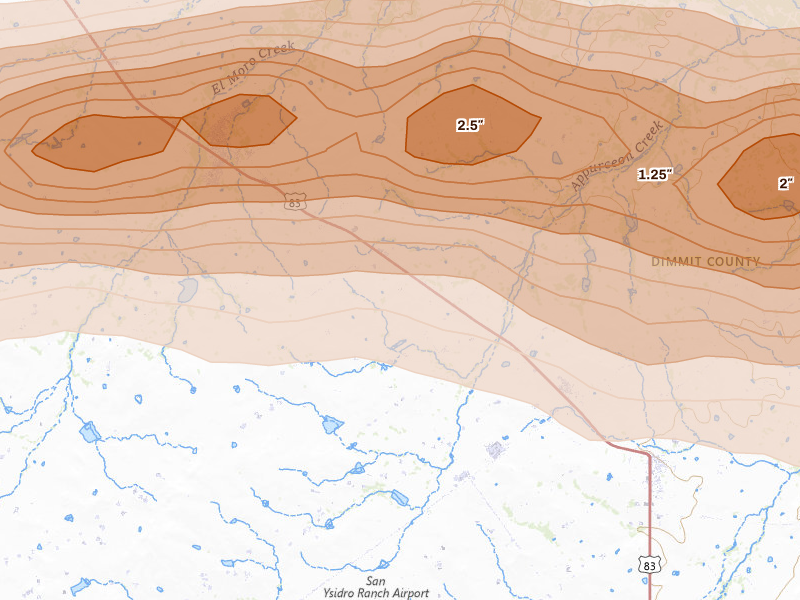
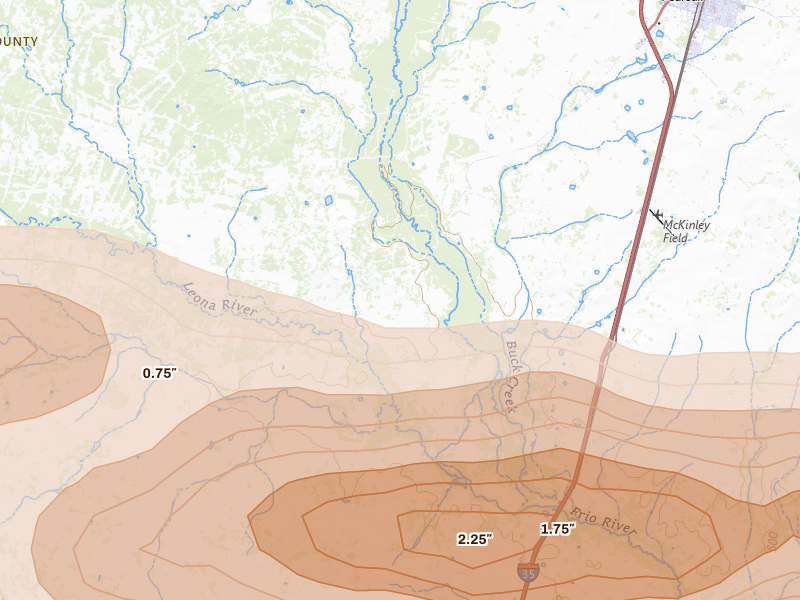
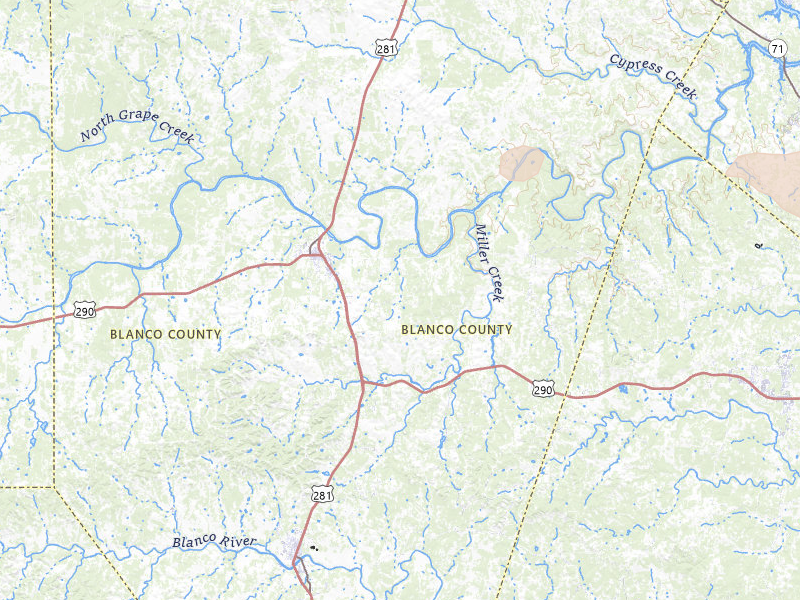
Carrizo Springs, TX 8.5 /10 severity
4" peak signal 1,001 mapped homes 4 ground reports
Asherton, TX 8.1 /10 severity
4" peak signal 622 mapped homes 3 ground reports
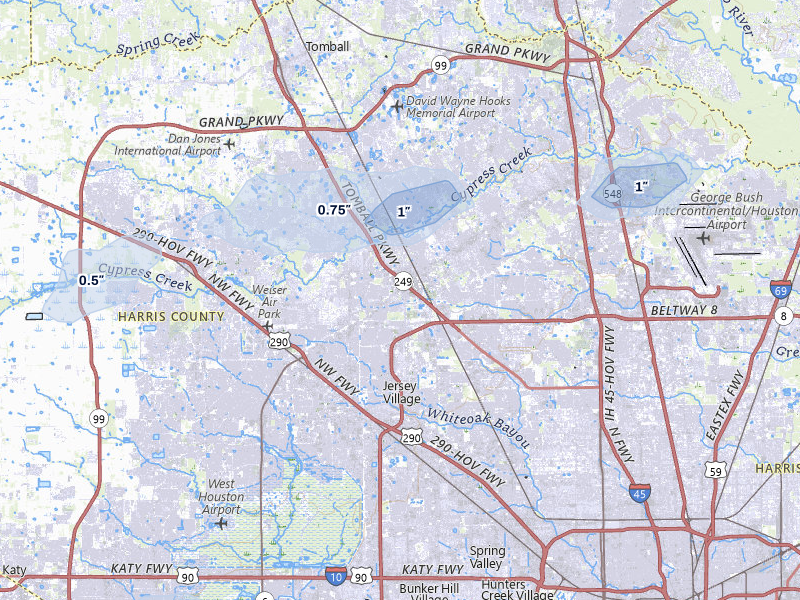
Houston, TX 7.8 /10 severity
2.5" peak signal 113,236 mapped homes 8 ground reports
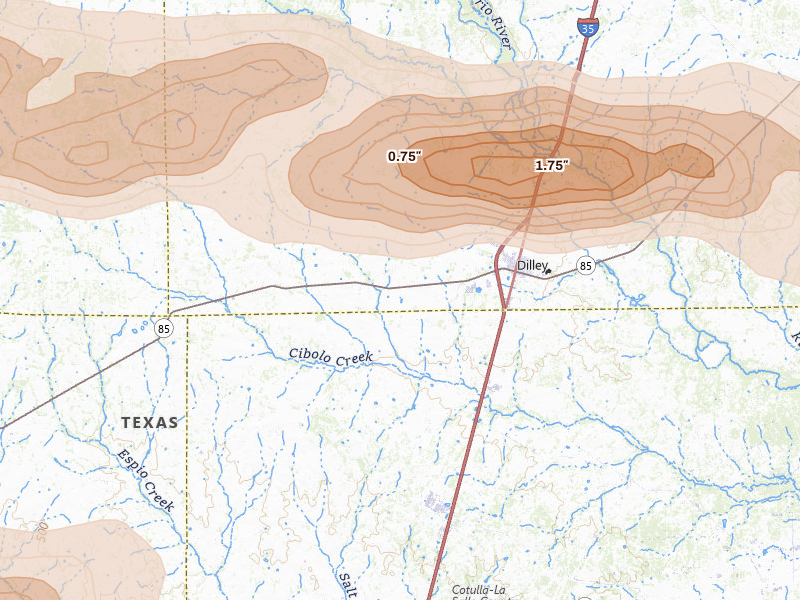
Dilley, TX 7.7 /10 severity
4" peak signal 802 mapped homes 1 ground report
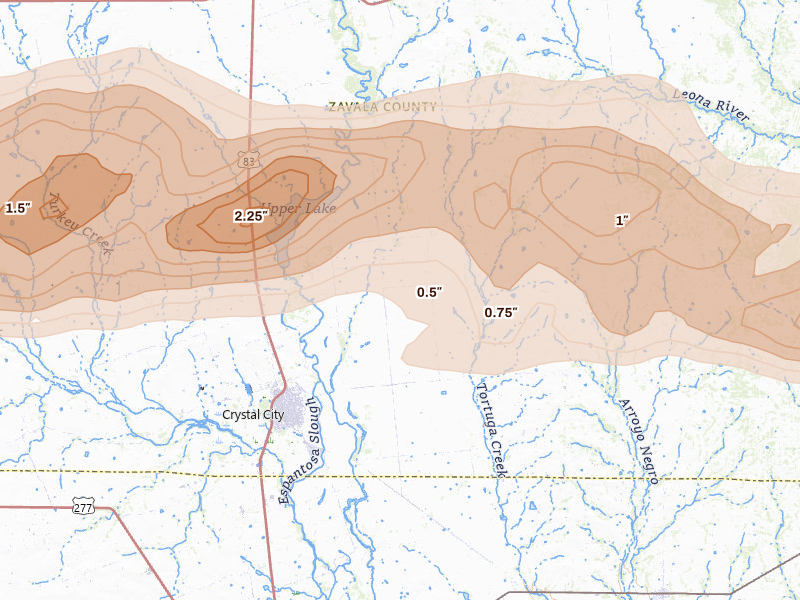
Crystal City, TX 7.2 /10 severity
4" peak signal 233 mapped homes No ground reports
Pearsall, TX 7.1 /10 severity
4" peak signal 156 mapped homes No ground reports
Catarina, TX 6.9 /10 severity
4" peak signal 55 mapped homes No ground reports
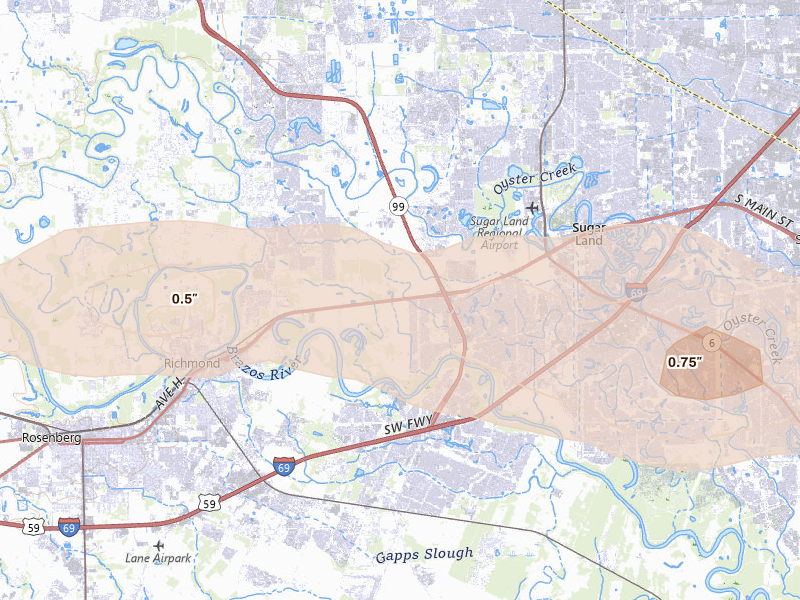
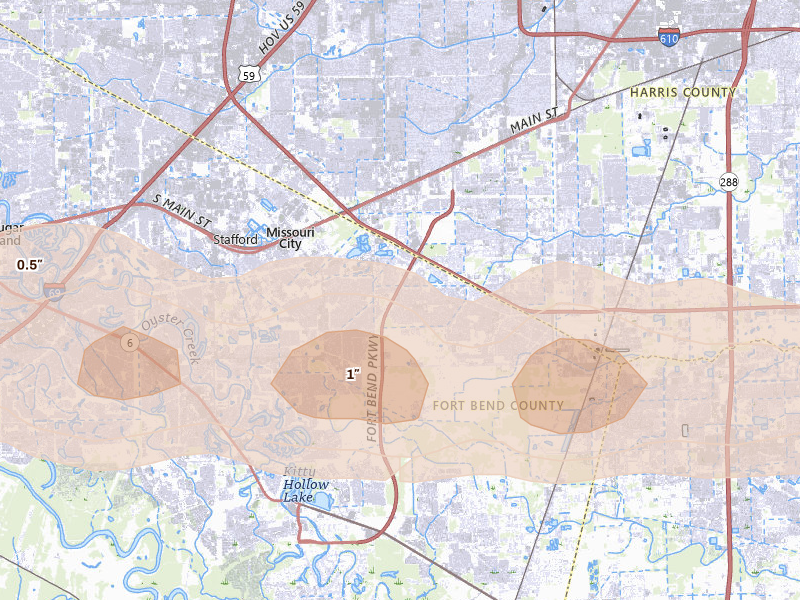
Sugar Land, TX 6.6 /10 severity
2.5" peak signal 52,704 mapped homes 2 ground reports
Missouri City, TX 6.3 /10 severity
2.5" peak signal 35,333 mapped homes 1 ground report
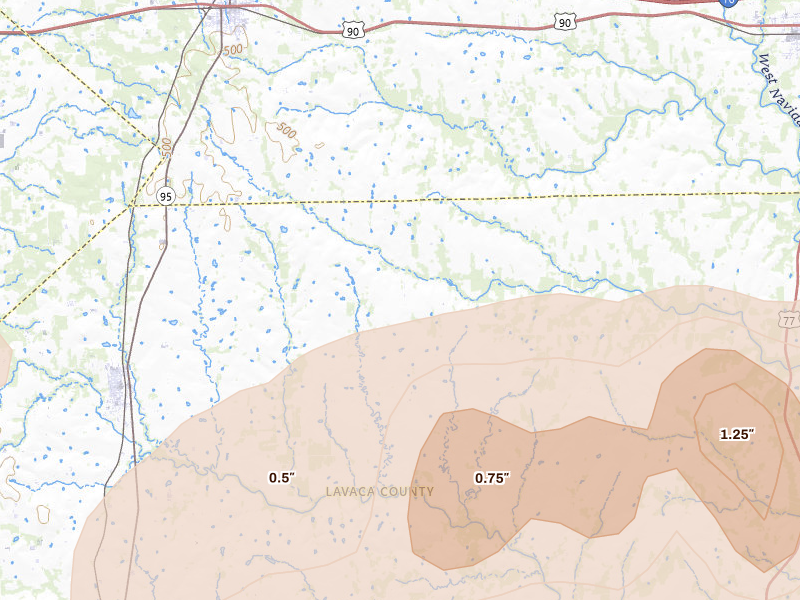
Hallettsville, TX 5.6 /10 severity
2.5" peak signal 1,575 mapped homes 1 ground report
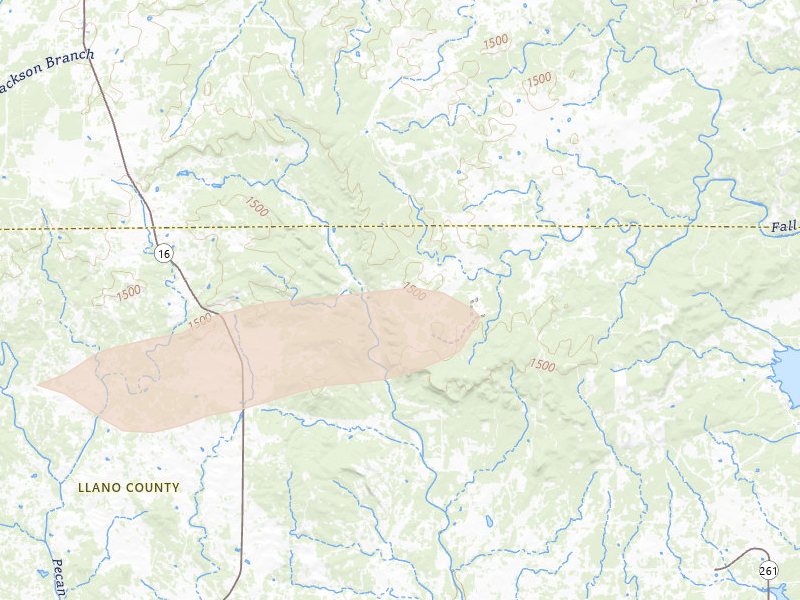
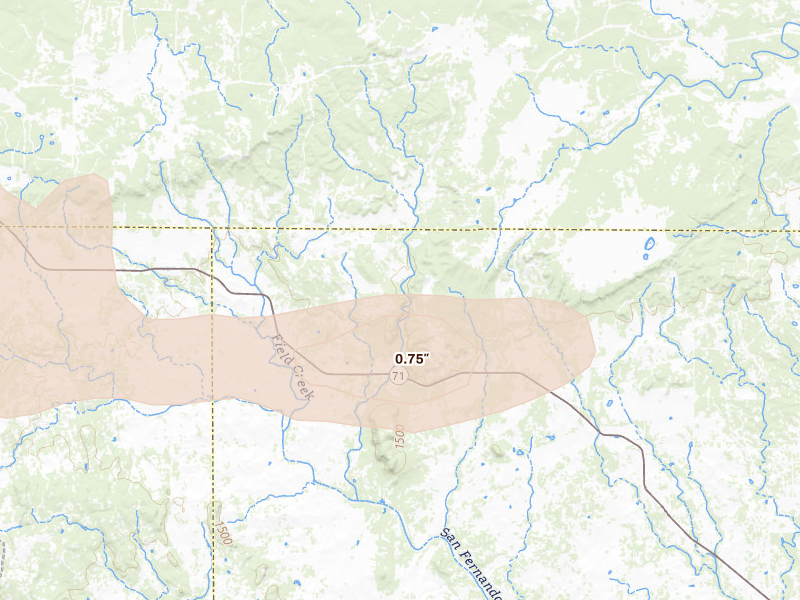
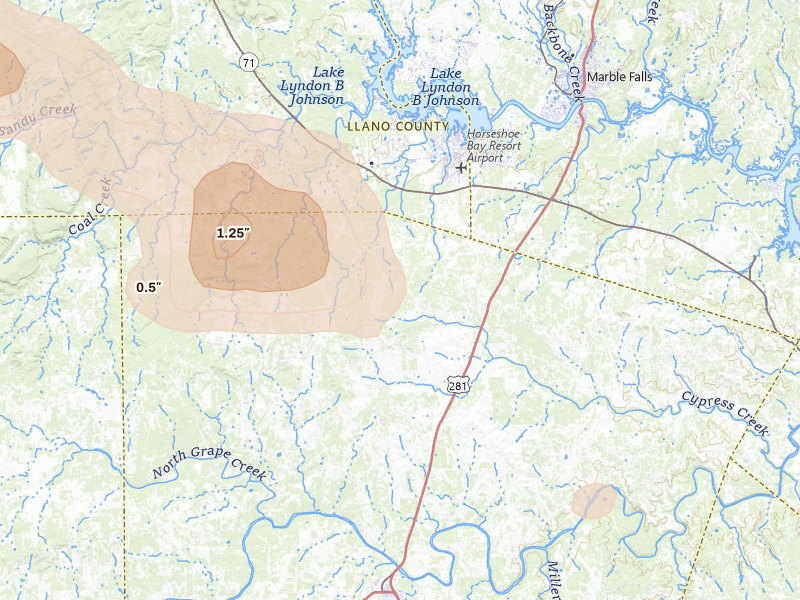
Llano, TX 5.5 /10 severity
2.75" peak signal 494 mapped homes No ground reports
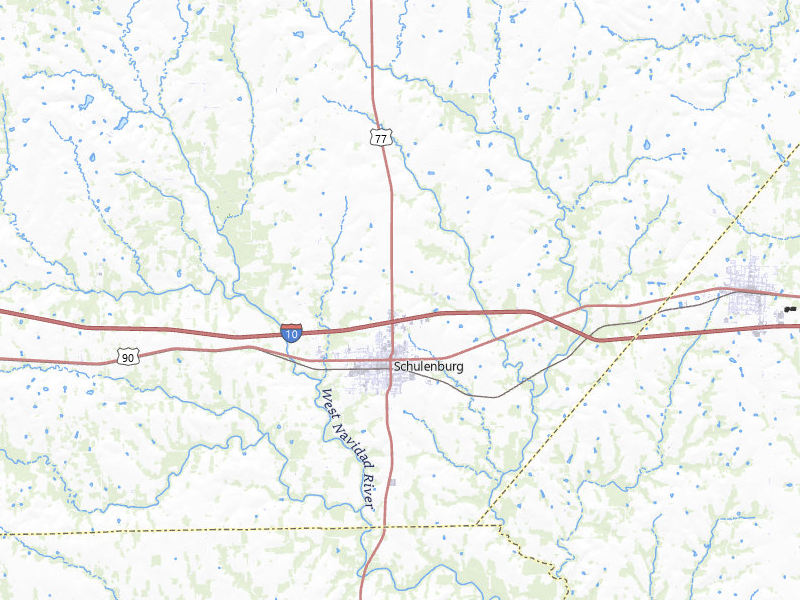
Schulenburg, TX 5.5 /10 severity
2.5" peak signal 875 mapped homes 1 ground report
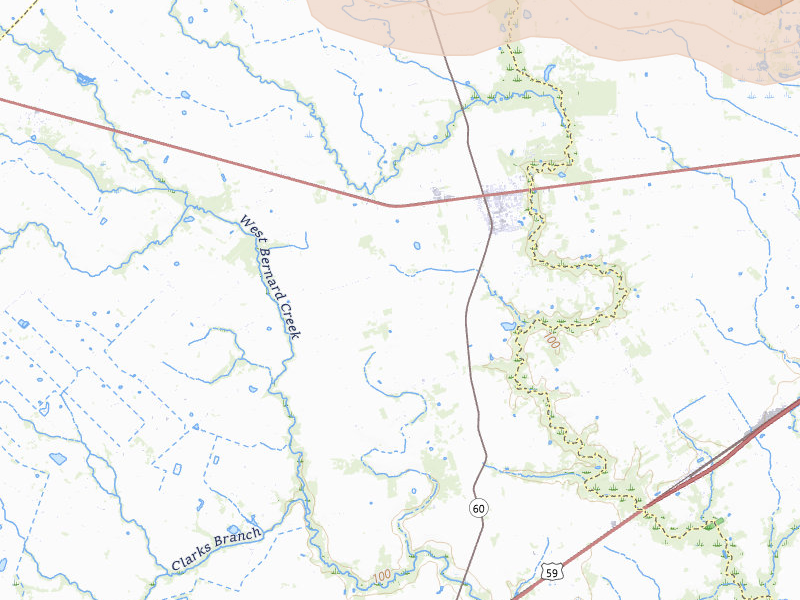
Wallis, TX 5.4 /10 severity
2.5" peak signal 1,603 mapped homes No ground reports
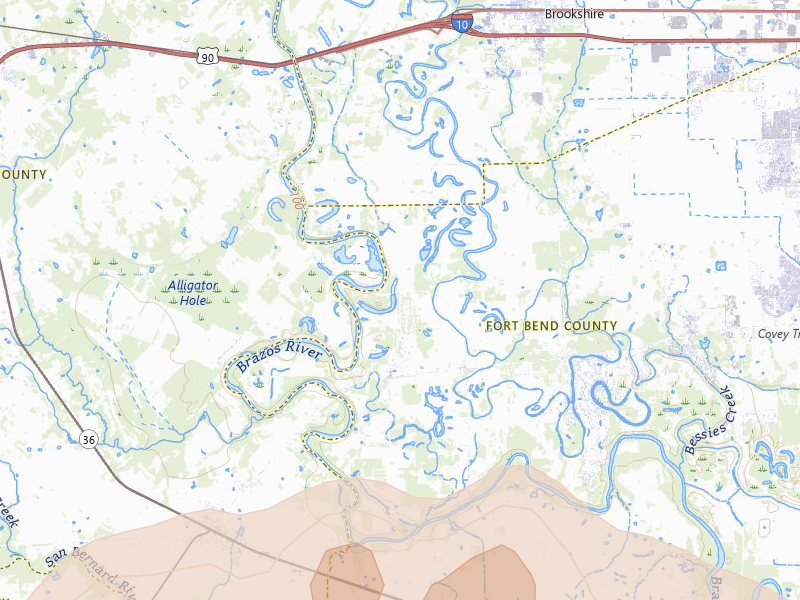
East Bernard, TX 5.3 /10 severity
2.5" peak signal 1,231 mapped homes No ground reports
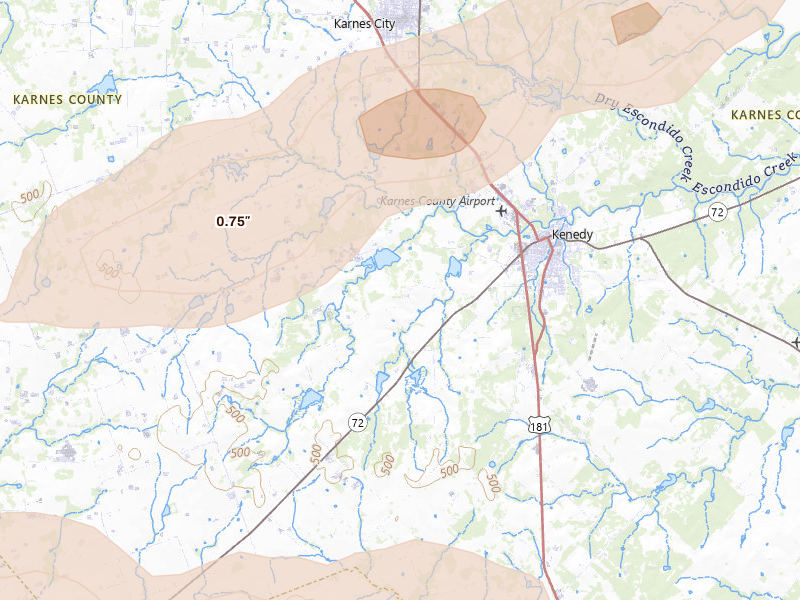
Kenedy, TX 5.3 /10 severity
2.5" peak signal 1,233 mapped homes No ground reports
Moulton, TX 5.3 /10 severity
2.5" peak signal 1,091 mapped homes No ground reports
Shiner, TX 5.3 /10 severity
2.5" peak signal 1,062 mapped homes No ground reports
Junction, TX 5.2 /10 severity
2.75" peak signal 120 mapped homes No ground reports
Karnes City, TX 5.2 /10 severity
2.5" peak signal 641 mapped homes No ground reports
Kingsbury, TX 5.2 /10 severity
2.5" peak signal 929 mapped homes No ground reports
Luling, TX 5.2 /10 severity
2.5" peak signal 661 mapped homes No ground reports
Art, TX 5.1 /10 severity
2.5" peak signal 432 mapped homes No ground reports
Campbellton, TX 5.1 /10 severity
2.5" peak signal 432 mapped homes No ground reports
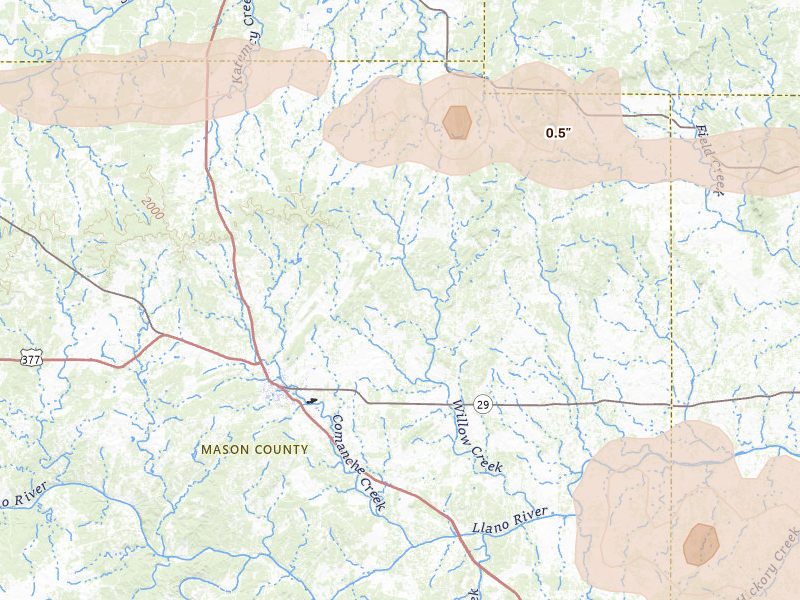
Mason, TX 5.1 /10 severity
2.5" peak signal 563 mapped homes No ground reports
Pontotoc, TX 5.1 /10 severity
2.75" peak signal 71 mapped homes No ground reports
Austin, TX 5.0 /10 severity
1.75" peak signal 5,240 mapped homes 2 ground reports
Eagle Pass, TX 5.0 /10 severity
2.5" peak signal 362 mapped homes No ground reports
Runge, TX 5.0 /10 severity
2.5" peak signal 264 mapped homes No ground reports
Batesville, TX 4.9 /10 severity
2.5" peak signal 240 mapped homes No ground reports
Jourdanton, TX 4.9 /10 severity
2.5" peak signal 169 mapped homes No ground reports
Pleasanton, TX 4.9 /10 severity
2.5" peak signal 166 mapped homes No ground reports
Cotulla, TX 4.8 /10 severity
2.5" peak signal 153 mapped homes No ground reports
Tilden, TX 4.8 /10 severity
2.5" peak signal 118 mapped homes No ground reports
Rosenberg, TX 4.6 /10 severity
1.75" peak signal 7,081 mapped homes No ground reports
Cuero, TX 4.4 /10 severity
1.75" peak signal 3,560 mapped homes No ground reports
Fredonia, TX 4.1 /10 severity
2" peak signal 195 mapped homes No ground reports
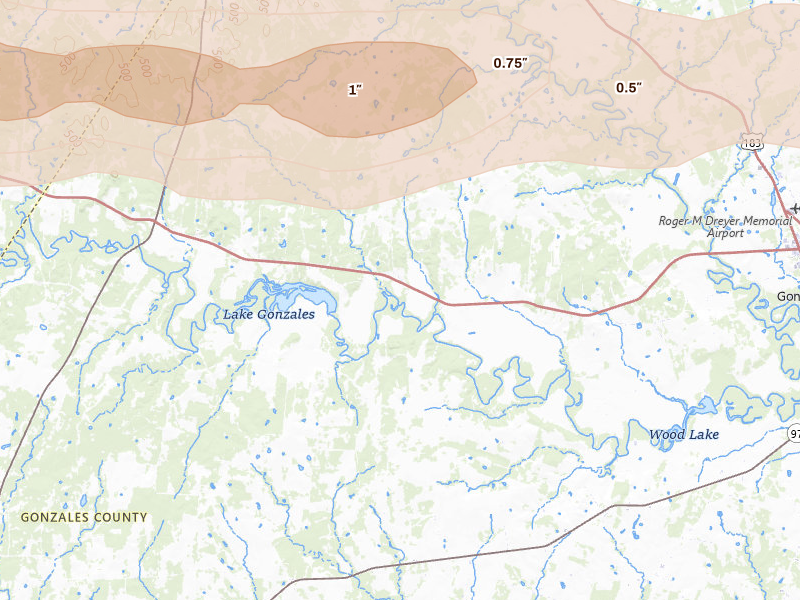
Gonzales, TX 4.1 /10 severity
1.75" peak signal 1,009 mapped homes No ground reports
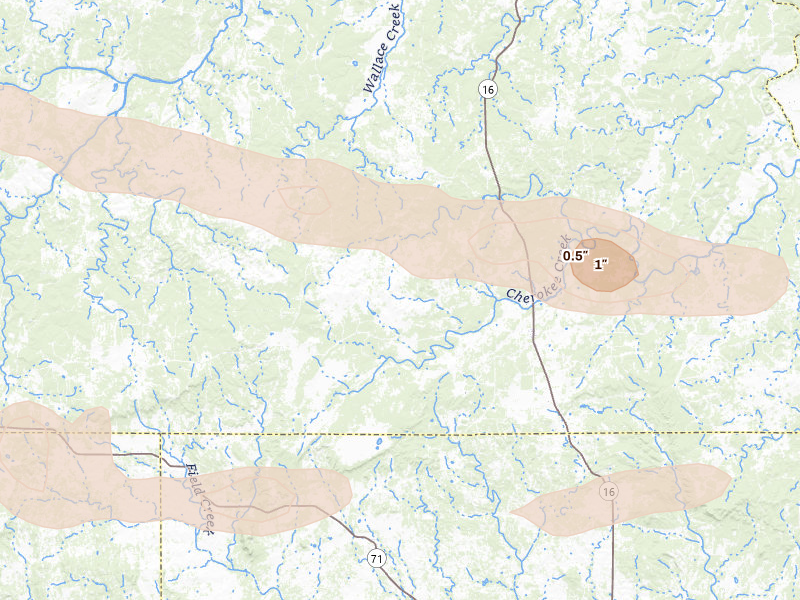
Cherokee, TX 4.0 /10 severity
2" peak signal 95 mapped homes No ground reports
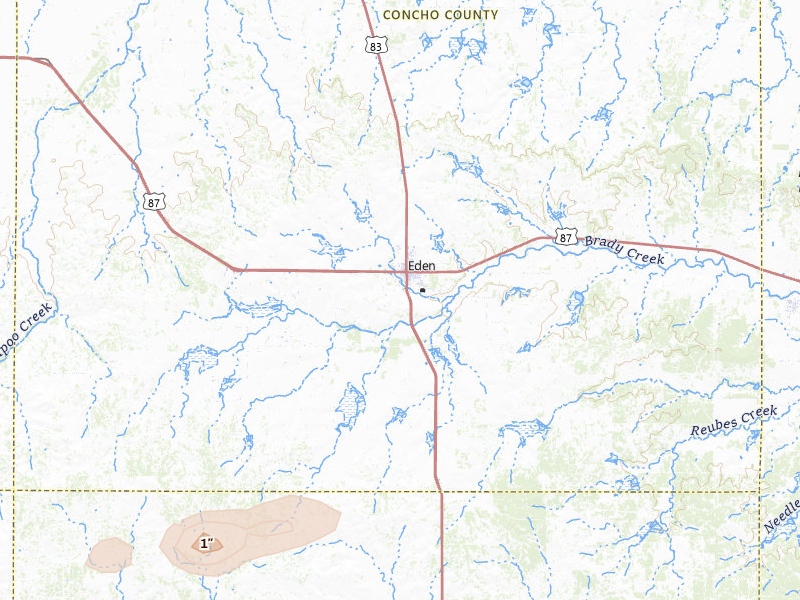
Eden, TX 4.0 /10 severity
2.25" peak signal 17 mapped homes No ground reports
Round Mountain, TX 4.0 /10 severity
2" peak signal 83 mapped homes No ground reports
Weimar, TX 4.0 /10 severity
1.75" peak signal 684 mapped homes No ground reports
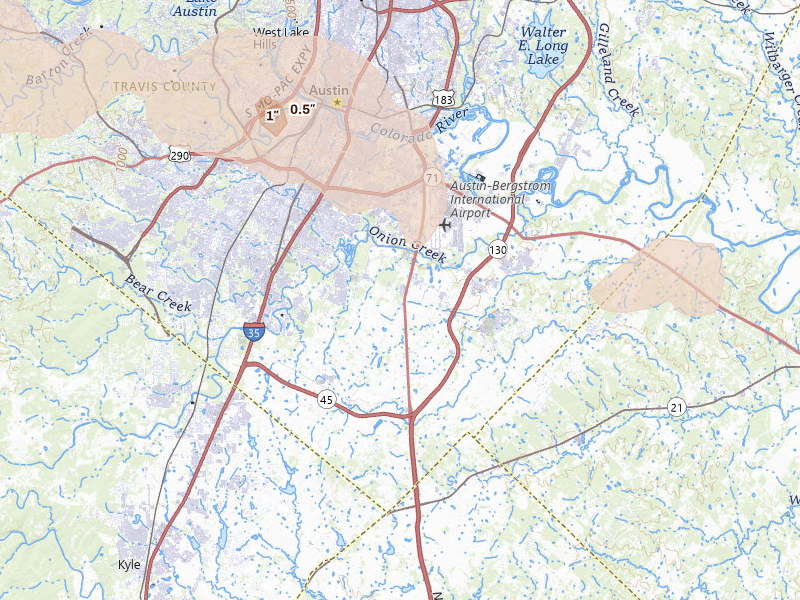
Yorktown, TX 4.0 /10 severity
1.75" peak signal 673 mapped homes No ground reports
Oakhurst, TX 3.9 /10 severity
1.75" peak signal 413 mapped homes No ground reports
Sheridan, TX 3.9 /10 severity
1.75" peak signal 425 mapped homes No ground reports
Falls City, TX 3.8 /10 severity
1.75" peak signal 265 mapped homes No ground reports
Rock Island, TX 3.8 /10 severity
1.75" peak signal 265 mapped homes No ground reports
Waelder, TX 3.8 /10 severity
1.75" peak signal 214 mapped homes No ground reports
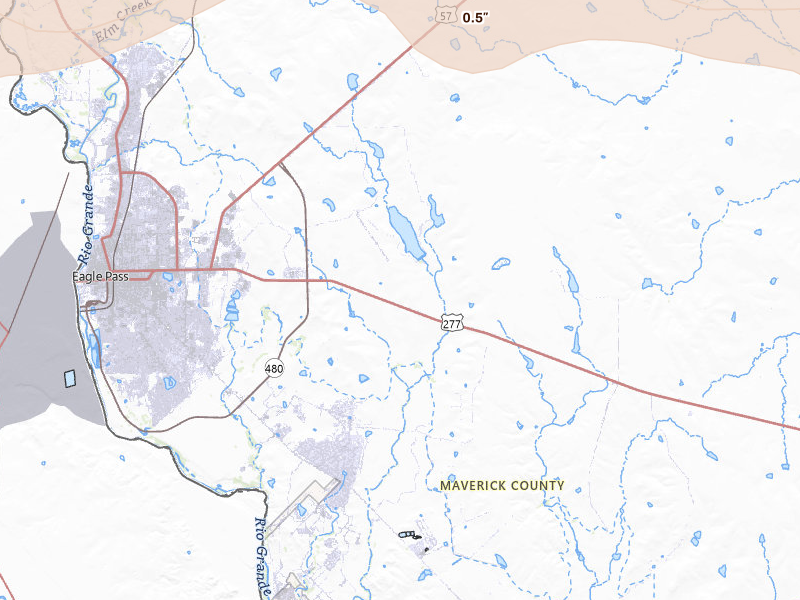
Charlotte, TX 3.7 /10 severity
1.75" peak signal 166 mapped homes No ground reports
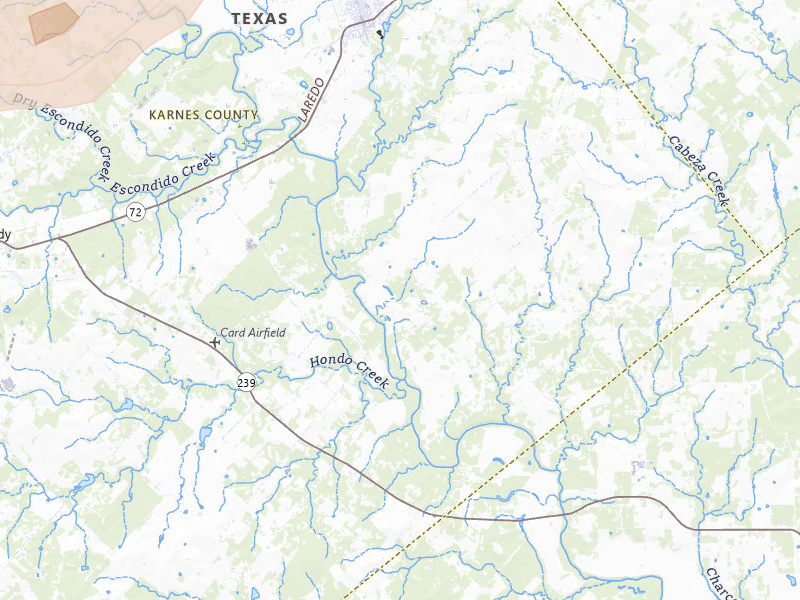
Nordheim, TX 3.6 /10 severity
1.75" peak signal 79 mapped homes No ground reports
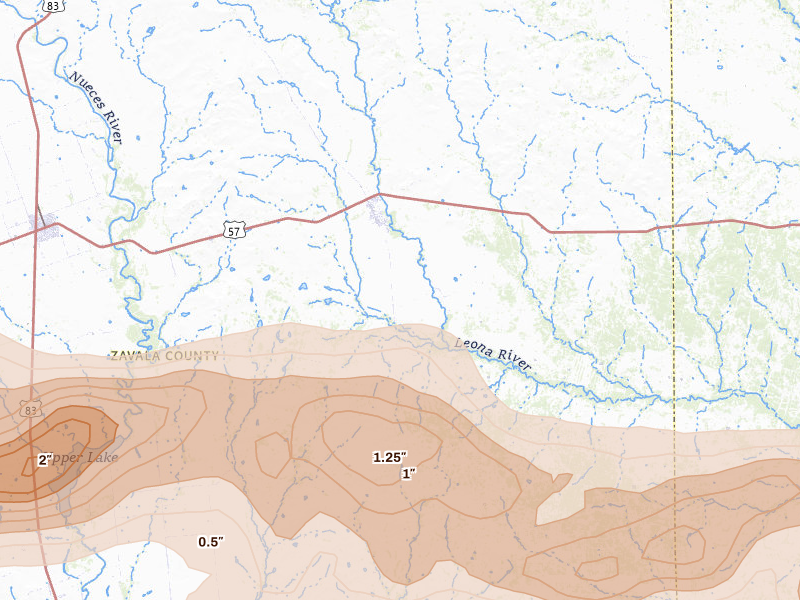
Fulshear, TX 3.5 /10 severity
1.75" peak signal 48 mapped homes No ground reports
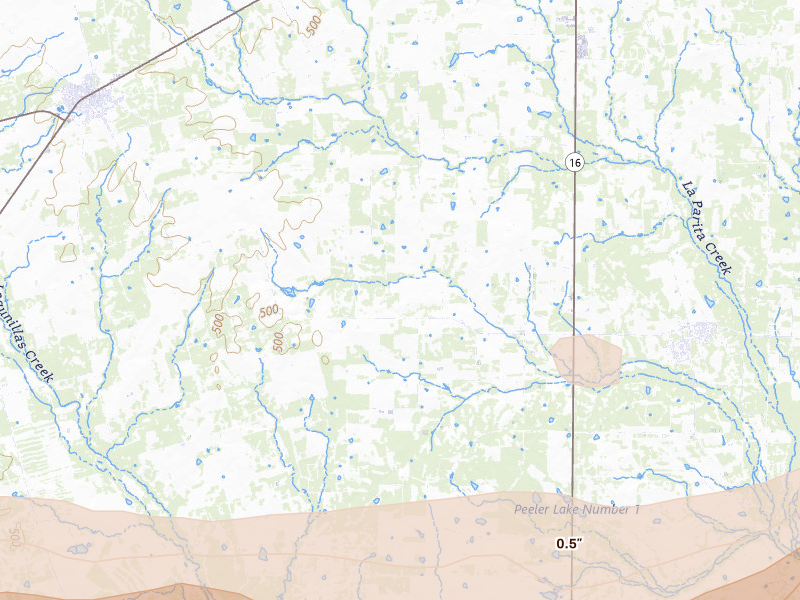
Pasadena, TX 3.4 /10 severity
1" peak signal 6,262 mapped homes No ground reports
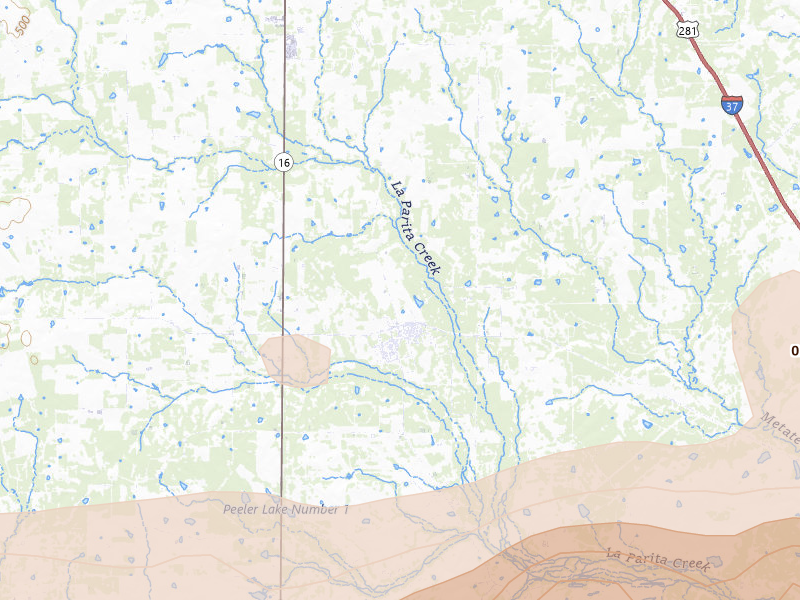
Horseshoe Bay, TX 3.2 /10 severity
1.75" peak signal 13 mapped homes No ground reports
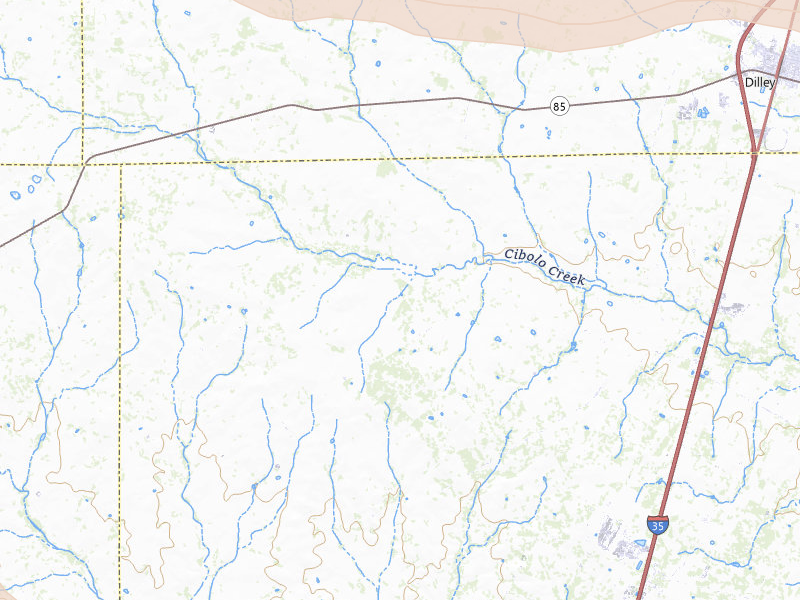
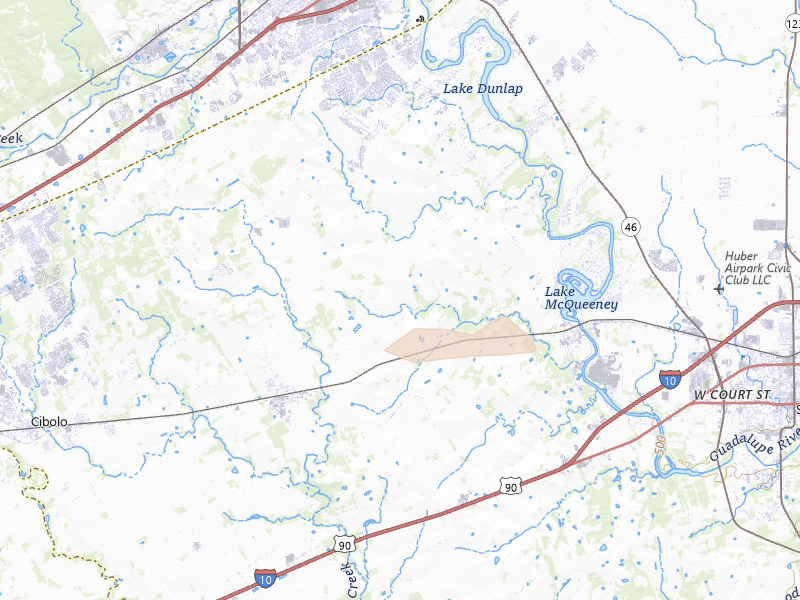
Seguin, TX 3.1 /10 severity
1" peak signal 1,336 mapped homes No ground reports
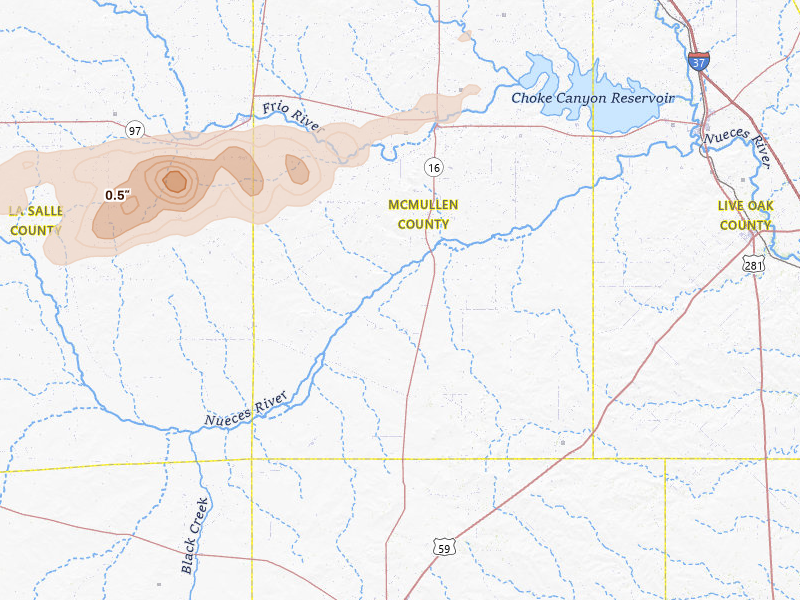
Whitsett, TX 2.8 /10 severity
1.25" peak signal 56 mapped homes No ground reports
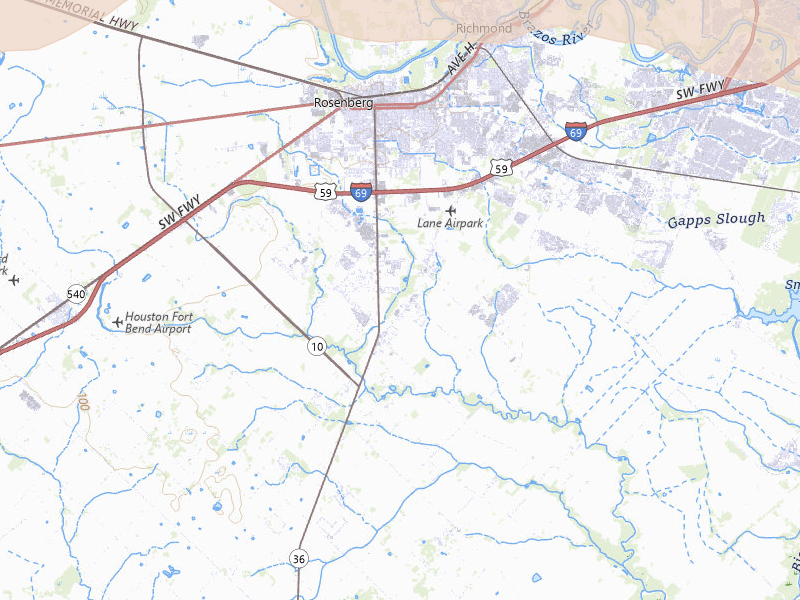
Dripping Springs, TX 2.7 /10 severity
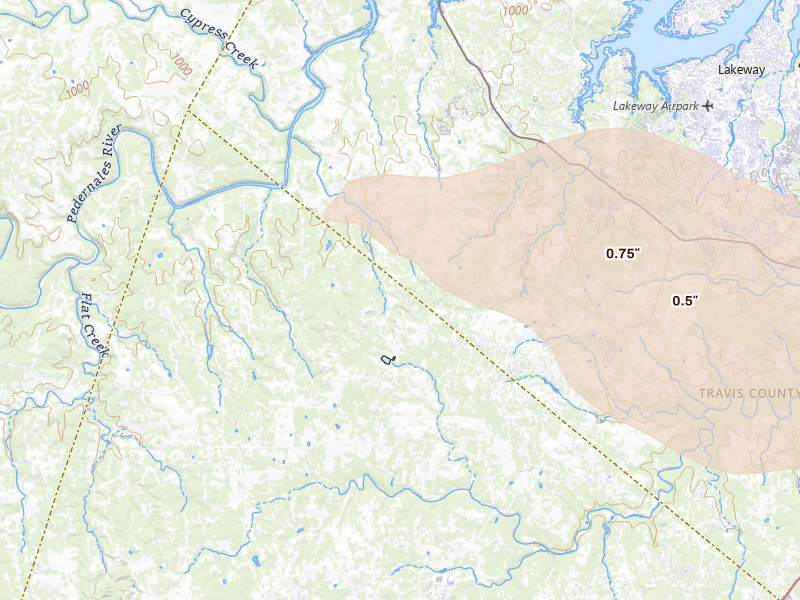
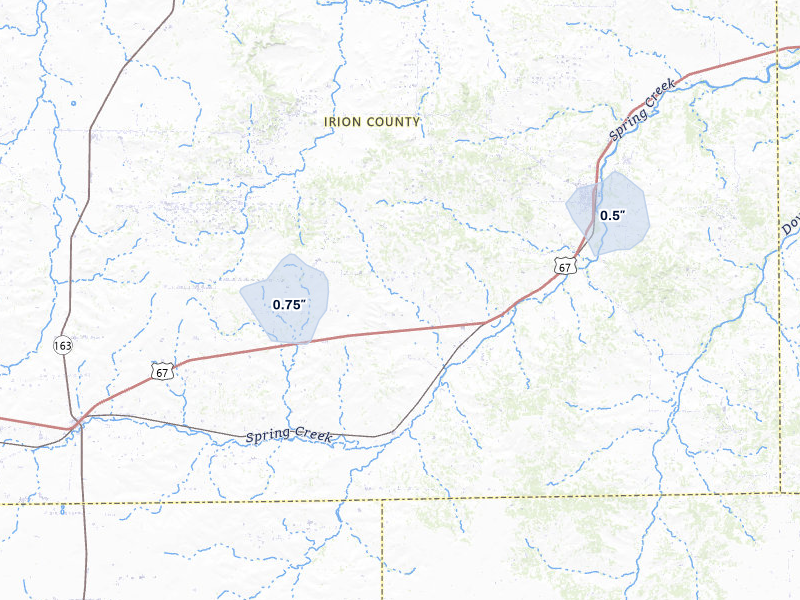
0.75" peak signal 1,144 mapped homes No ground reports
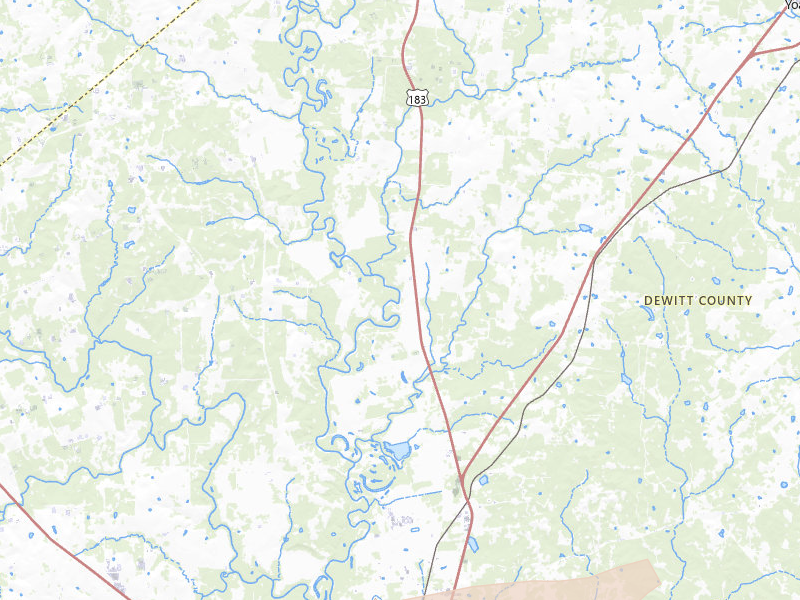
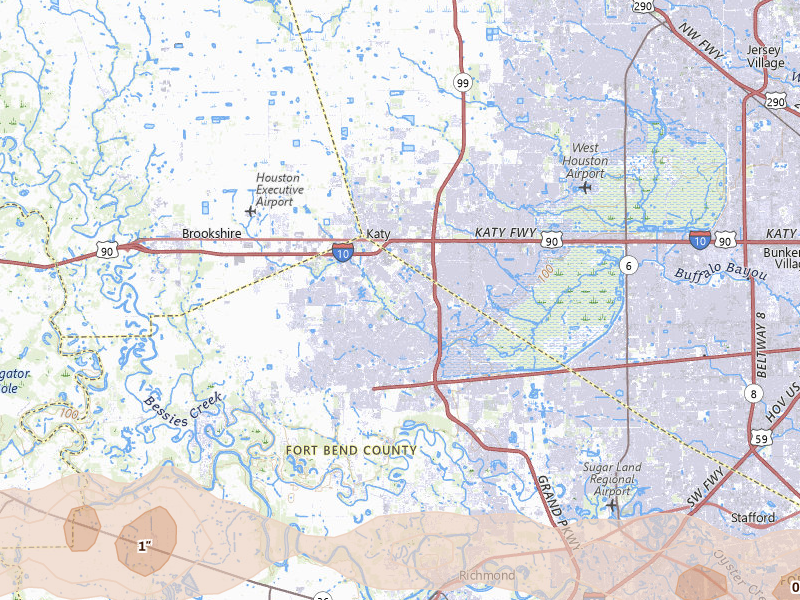
Katy, TX 2.6 /10 severity
1.75" peak signal 0 mapped homes No ground reports
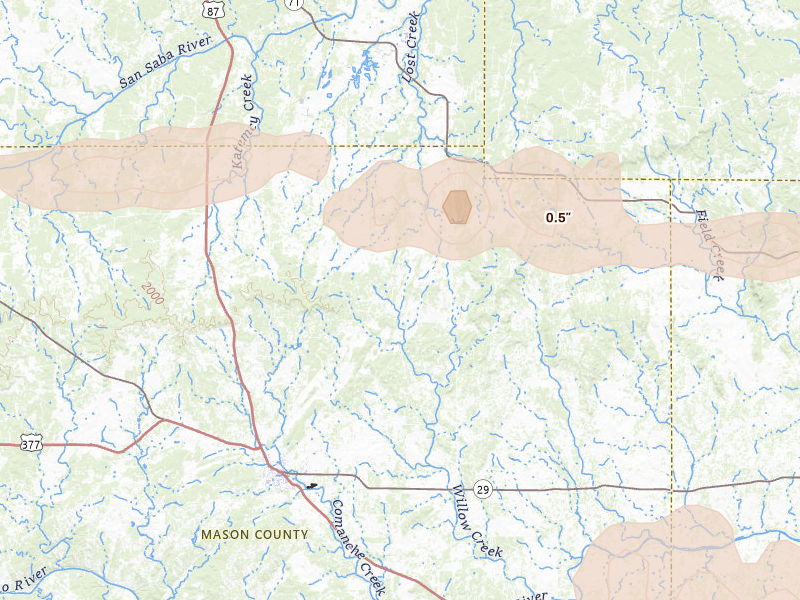
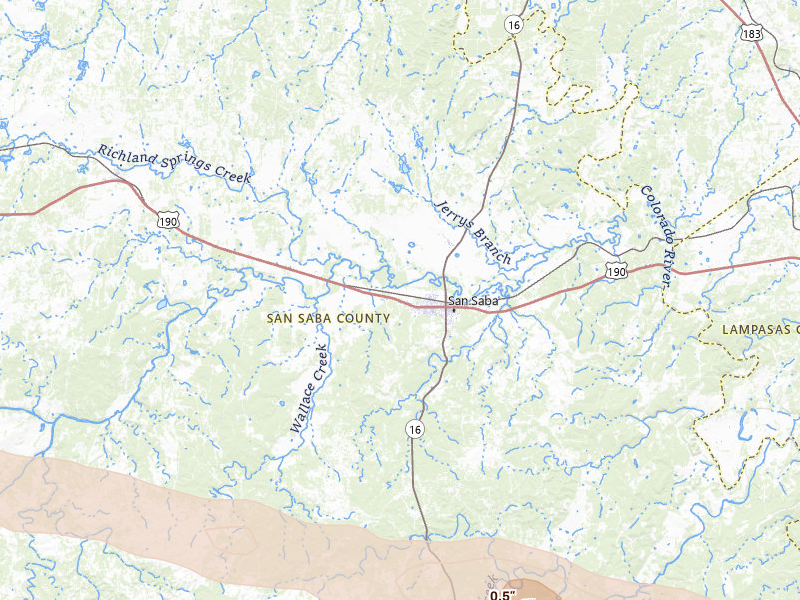
San Saba, TX 2.6 /10 severity
1.25" peak signal 28 mapped homes No ground reports
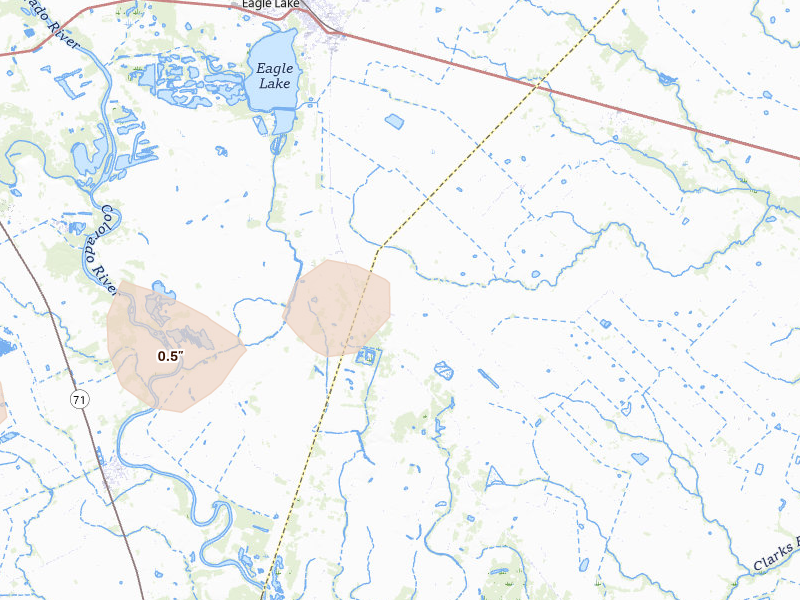
Eagle Lake, TX 2.4 /10 severity
1" peak signal 60 mapped homes No ground reports
Columbus, TX 2.3 /10 severity
1" peak signal 32 mapped homes No ground reports
Cedar Creek, TX 2.2 /10 severity
0.5" peak signal 903 mapped homes No ground reports
Garwood, TX 2.2 /10 severity
1" peak signal 24 mapped homes No ground reports
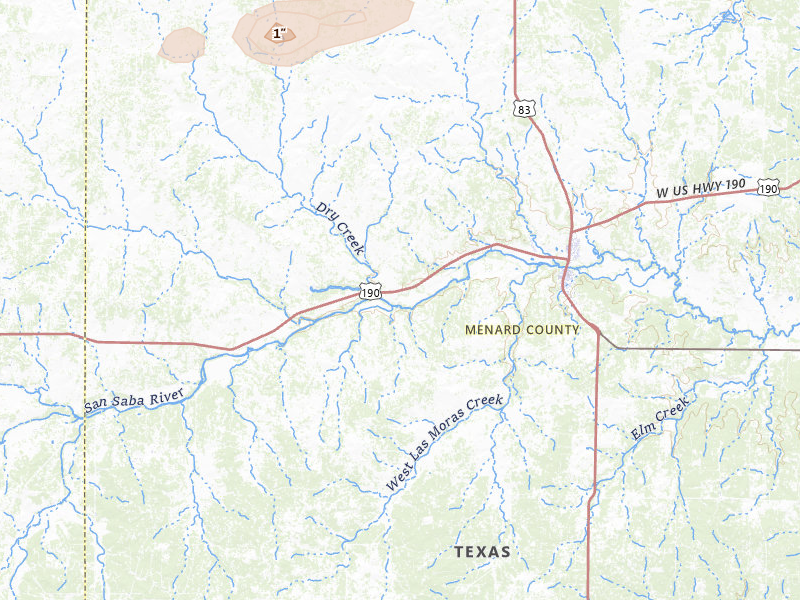
Menard, TX 2.2 /10 severity
1" peak signal 27 mapped homes No ground reports
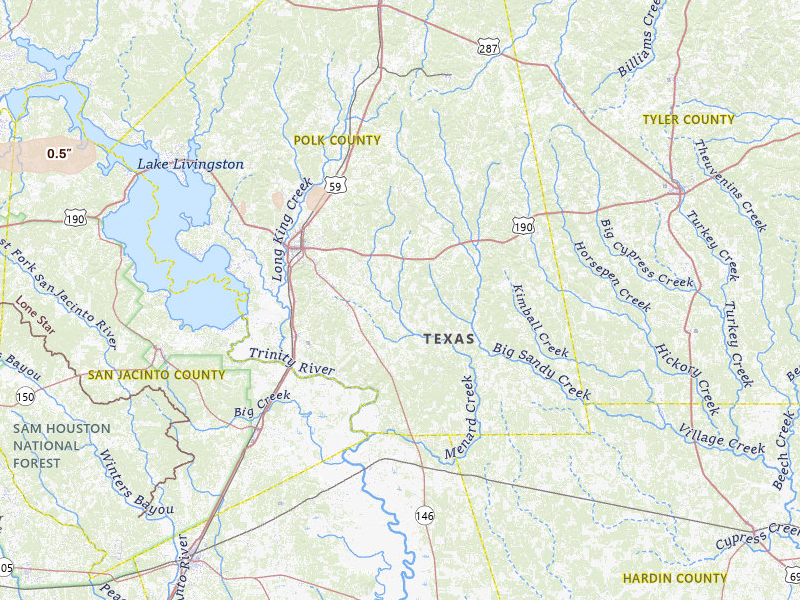
Livingston, TX 2.1 /10 severity
0.75" peak signal 91 mapped homes No ground reports
Marion, TX 2.1 /10 severity
1" peak signal 18 mapped homes No ground reports
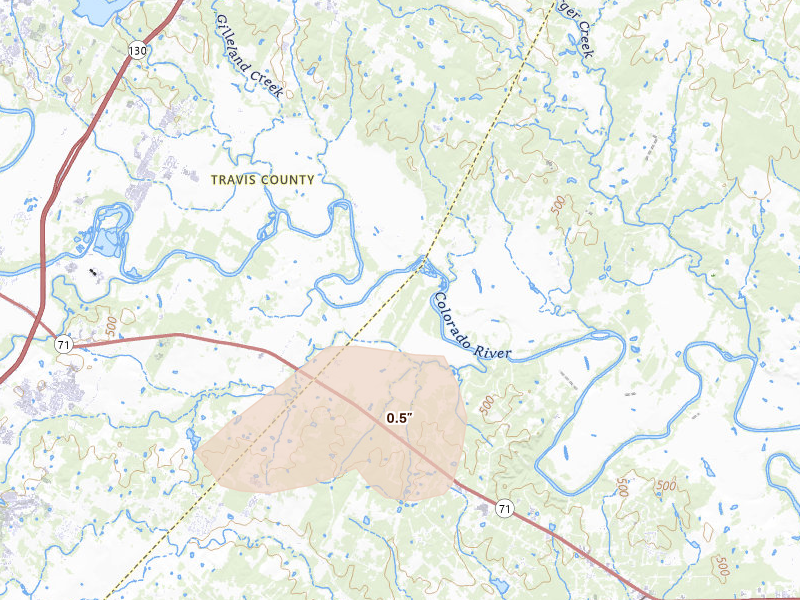
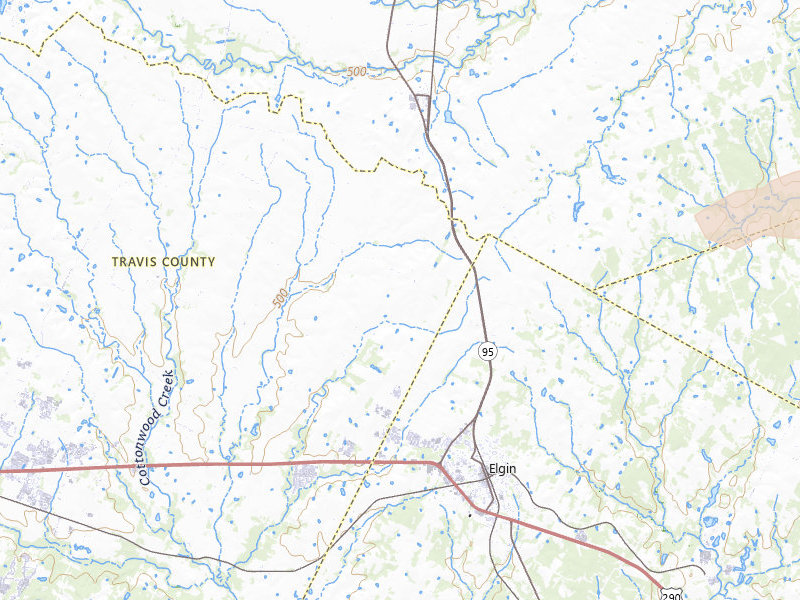
Elgin, TX 1.8 /10 severity
0.5" peak signal 137 mapped homes No ground reports
Mertzon, TX 1.8 /10 severity
0.5" peak signal 103 mapped homes No ground reports
Onalaska, TX 1.5 /10 severity
0.75" peak signal 4 mapped homes No ground reports
Richmond, TX 1.5 /10 severity
1" peak signal 0 mapped homes No ground reports
Tomball, TX 1.5 /10 severity
1" peak signal 0 mapped homes No ground reports
Johnson City, TX 1.1 /10 severity
0.5" peak signal 5 mapped homes No ground reports
Woodville, TX 1.0 /10 severity
0.5" peak signal 2 mapped homes No ground reports
Del Rio, TX 0.8 /10 severity
0.5" peak signal 0 mapped homes No ground reports
Fluvanna, TX 0.8 /10 severity
0.5" peak signal 0 mapped homes No ground reports
Hockley, TX 0.0 /10 severity
0" peak signal 0 mapped homes No ground reports
Humble, TX 0.0 /10 severity
0" peak signal 0 mapped homes No ground reports

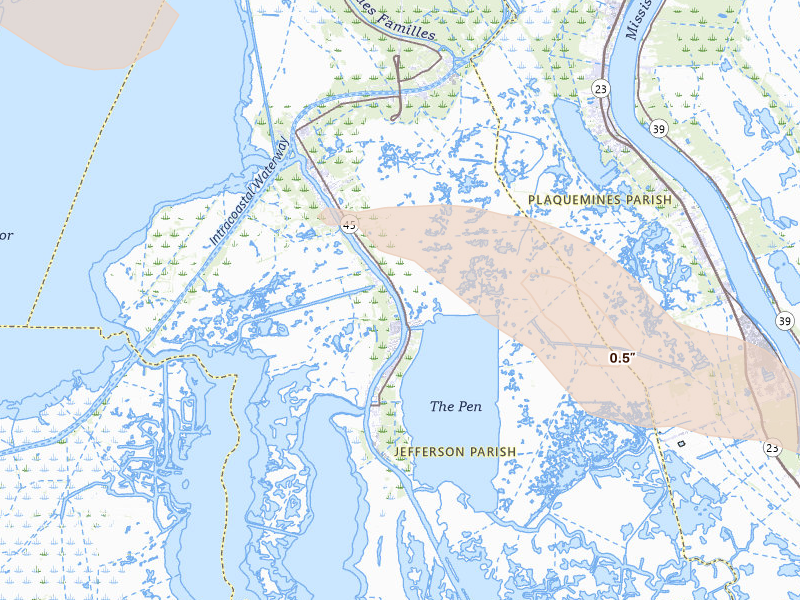
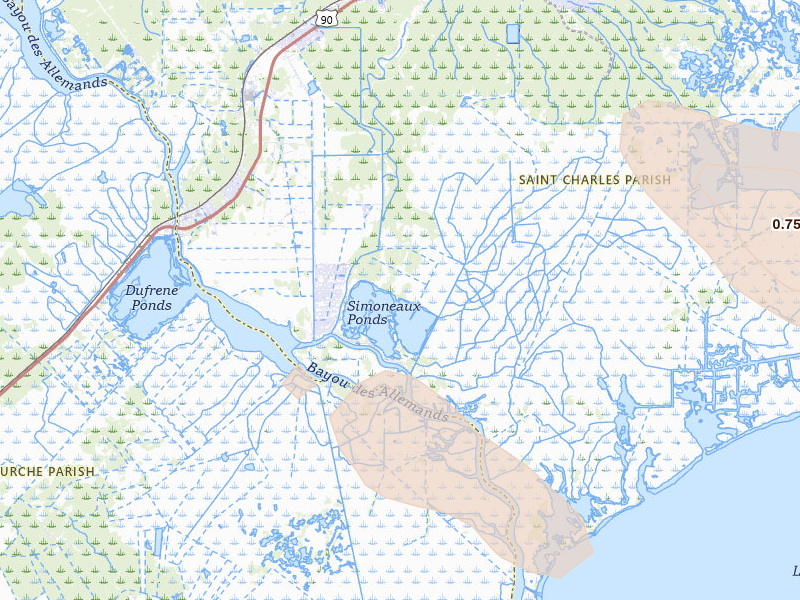
Louisiana

3 cities · up to 1.75" · 1,066 mapped homes
South Carolina

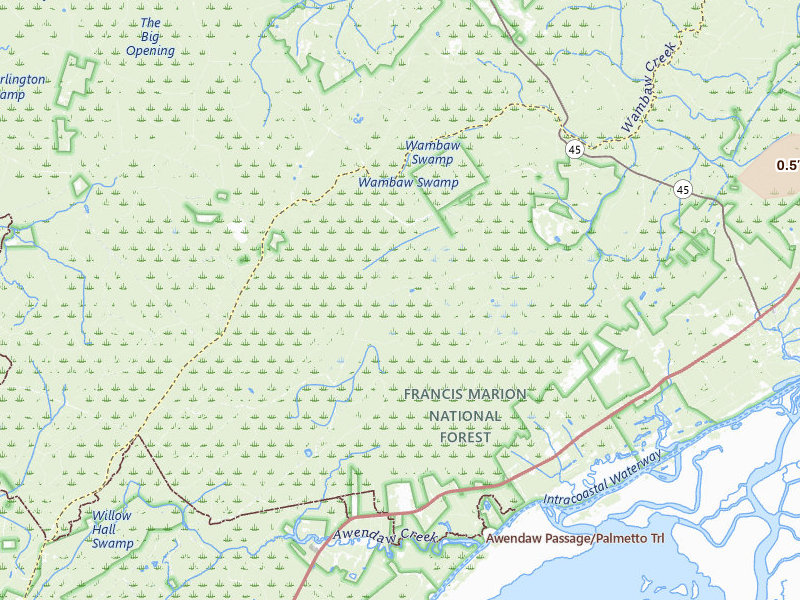
1 city · up to 1" · 27 mapped homes
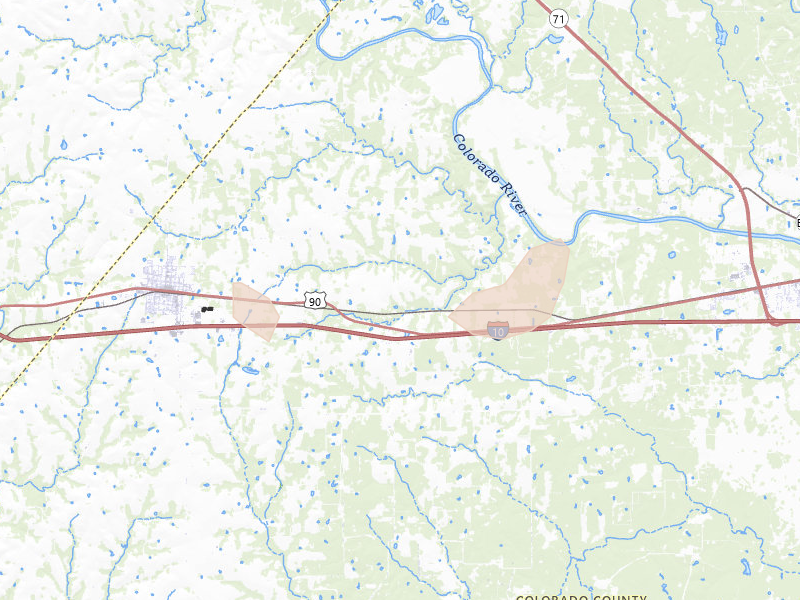
Colorado

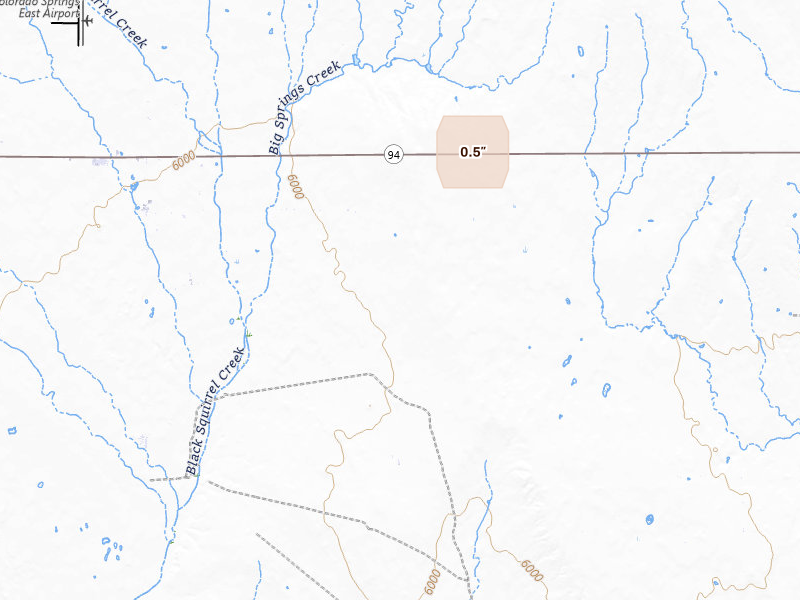
1 city · up to 0.5" · 12 mapped homes
← All storm days

Overview Pro · iPhone + web

One app for your prospecting day.

The hail map, your next recommended area, and the tools to work it. Start on your own; the same subscription also includes access for up to 4 team members.

Overview Pro

One plan · iPhone + web

Monthly · US App Store

$149.99 / month

5,000 new addresses per user each month on Pro. Put your 200 trial addresses to work before another week goes to guesswork.

Optional outreach

+ $0.21 per contact returned
Available homeowner names and phone numbers, with freshness and DNC flags.
+ $0.75 per postcard mailed
Print, postage, and delivery tracking included.

What's included

Get recommended places to prospect, or draw your own. The same plan gives you the tools to work either one.

  • Hail maps, storm history, and live radar
  • Curated prospecting recommendations and Quests
  • Canvassing sessions and navigation
  • Door outcomes, notes, and photos
  • Visit history and follow-up Quests
  • Alerts for your saved territories
  • Polygon and hexagon draw tools
  • Saved work areas and address lists
  • CSV exports for your dialer or CRM
  • XP, levels, and the leaderboard
  • Access on iPhone and the web
  • Up to 4 team members

7-day free trial in the iPhone app. No card required to start.

Choose whether to subscribe when your trial ends. Paid subscriptions renew monthly. Manage or cancel in your Apple Account settings.

See all pricing and billing details →
Start free trial

Web trial: 7 days free. Card required. $150/month after the trial unless cancelled.

The next storm won’t wait for you.

Set your territory and alerts today. When hail hits, use Overview to choose your streets and get moving.

Download on the App Store

7-day free trial in the iPhone app. No card required to start.

For iPhone. Android coming soon.

Open Apr 30 on the live map → Start free trial

Web trial: 7 days free. Card required. $150/month after the trial unless cancelled.

Storm days are convective days (noon-to-noon UTC). Cities and counts are the set Overview tracks, not every place hail fell. Ground reports are public-domain observations from the NOAA Storm Prediction Center; radar sizes are detections and estimates, not confirmed damage.