Hail storms on May 1, 2026

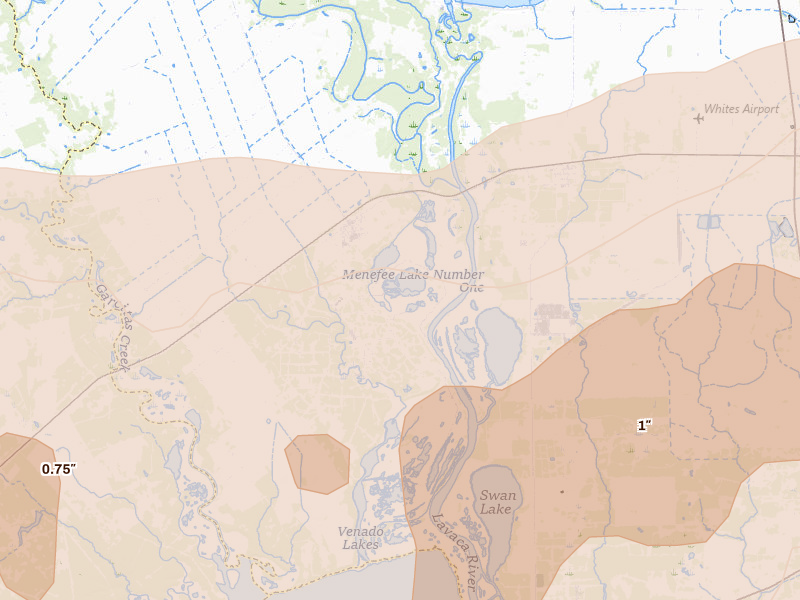
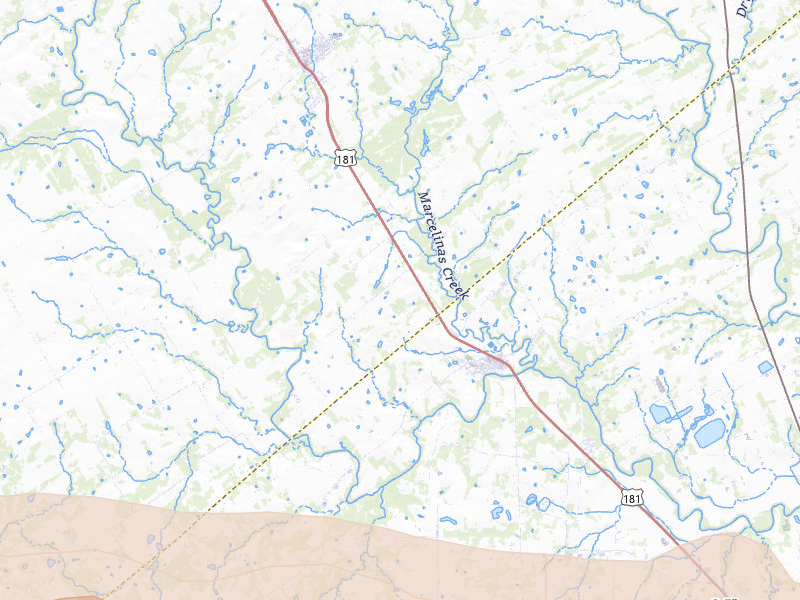
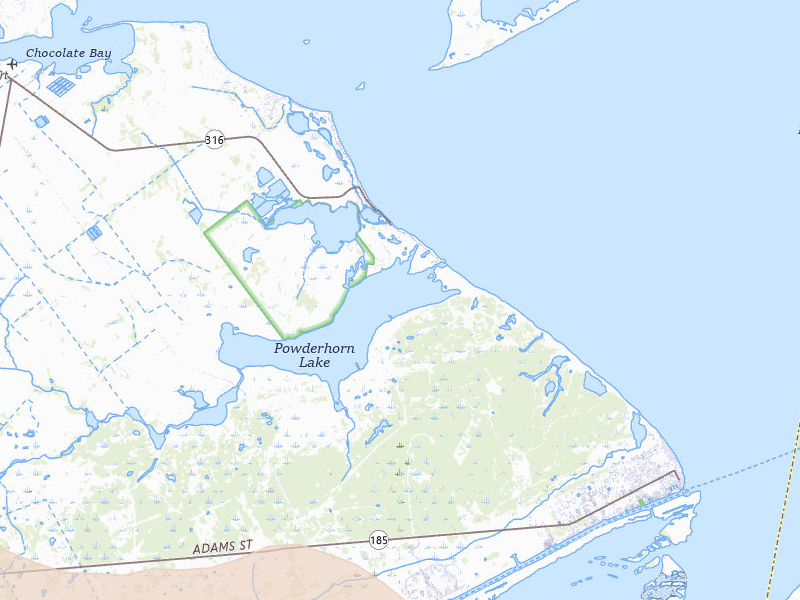
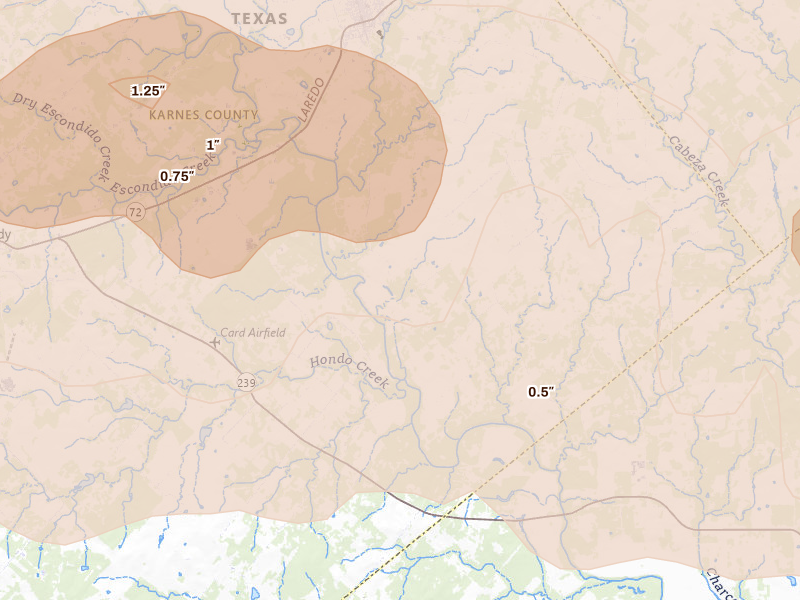
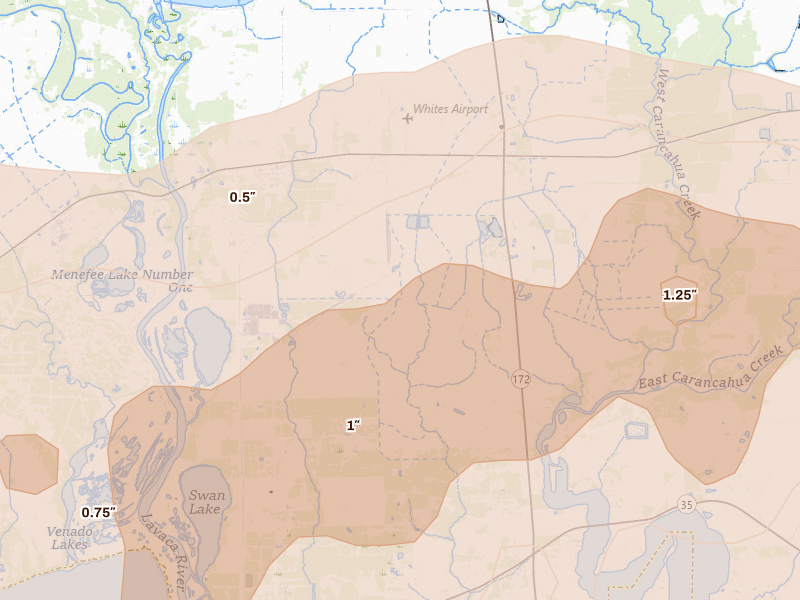
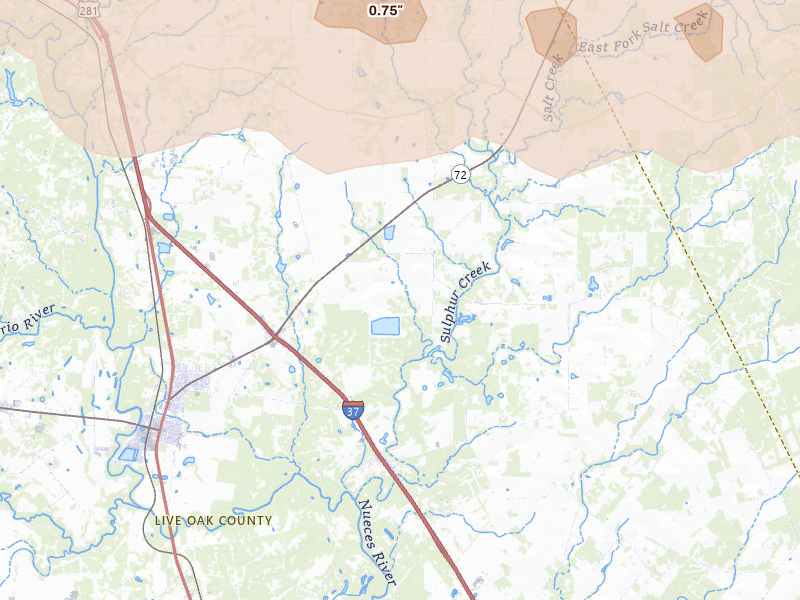
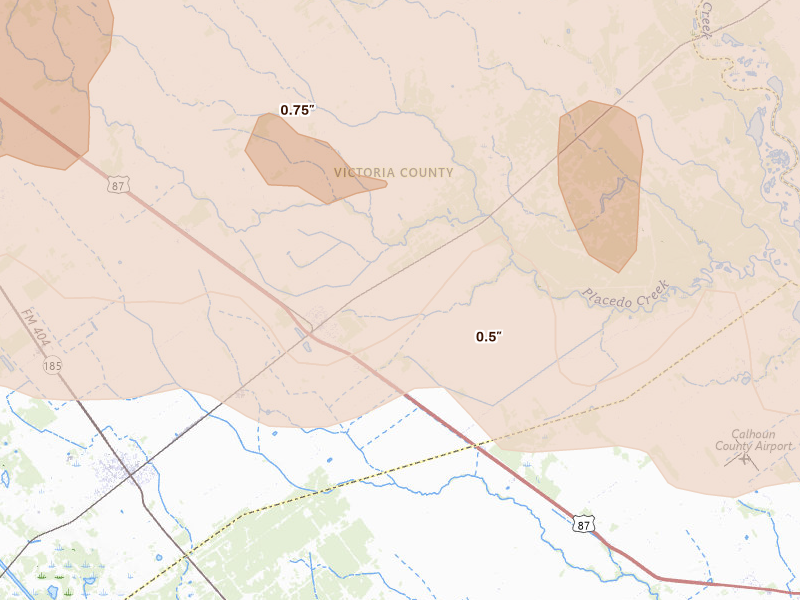
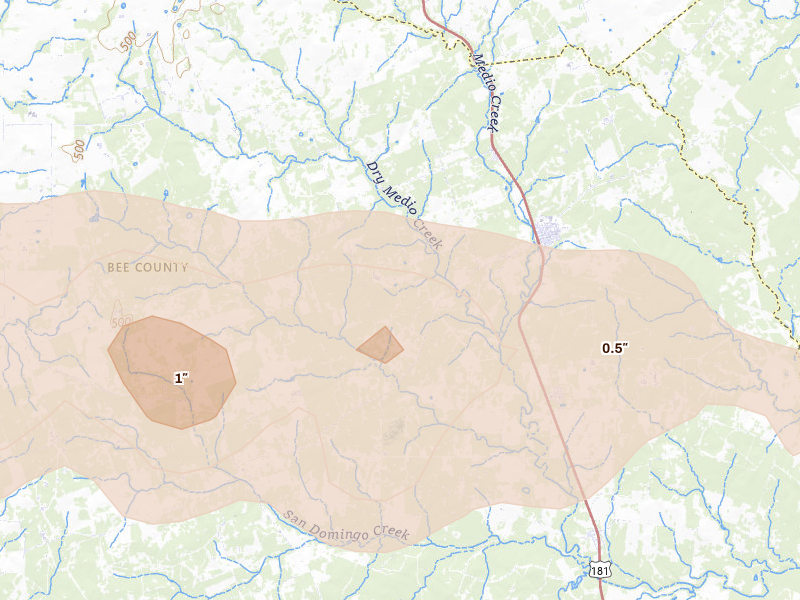
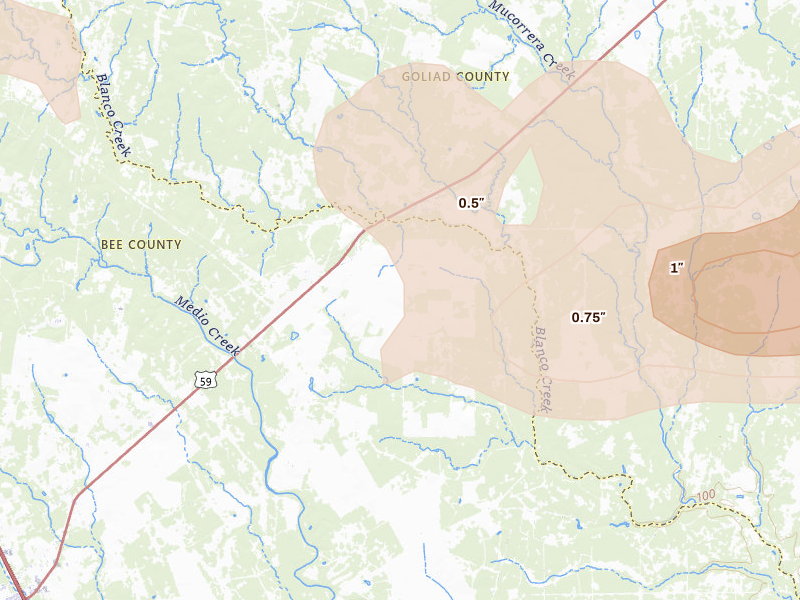
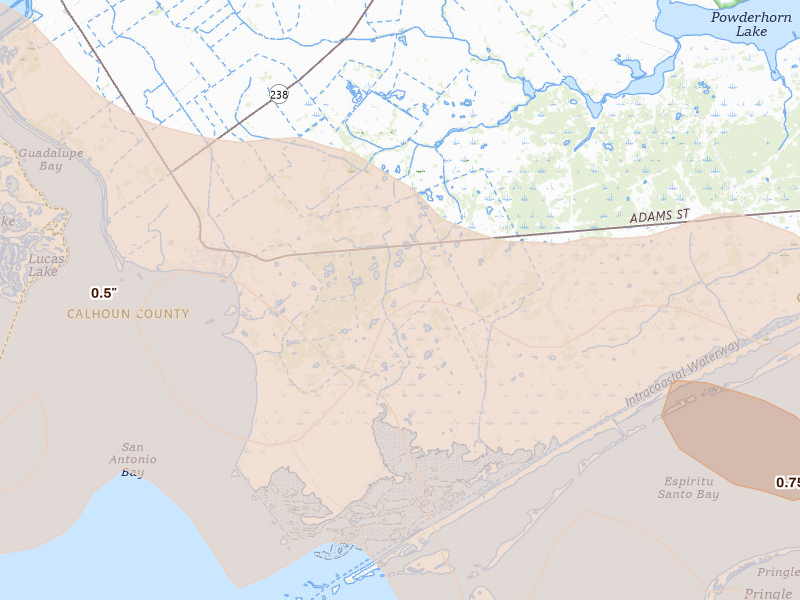
51 cities across 4 states recorded hail on May 1, 2026 — a multi-state outbreak. The peak radar-indicated size reached 4" over Tivoli — about the size of a softball or larger. That is a severe hail signal, not property-level damage confirmation.

Download on the App Store

7-day free trial in the iPhone app. No card required to start.

For iPhone. Android coming soon.

Web trial: 7 days free. Card required. $150/month after the trial unless cancelled.

Cities hit 51 across 4 states
Peak hail signal 4" ≈ softball or larger · Tivoli
Homes in footprints 19,186
Ground reports 12

May 1, 2026 · Tivoli, TX: 4" peak radar signal · NEXRAD + radar-estimated size maps

Mapped cities, by state

Every tracked city with a hail signal on May 1, 2026

51 cities · up to 4" · 19,186 mapped homes · noon-to-noon UTC

Every tracked city that recorded hail on this convective day, biggest signal first. Each row opens that city's full storm record.

How to read this day

A storm day on Overview is a convective day — it runs from noon to noon UTC, so late-night hail is grouped with the afternoon storm that spawned it rather than split across two calendar dates. Everything below happened inside the May 1, 2026 convective day. Across those footprints sit roughly 19,186 homes, and 12 ground reports were filed with the National Weather Service.

The cities are listed with the biggest storm first, measured by Overview's severity score. Each row links through to that city's own storm page, where you'll find the radar surfaces, every ground report filed, and the hail footprint drawn on the map.

The counts here are the size of the set of cities Overview tracks — never "every US city" — so read a quiet day as "quiet among the places we watch," not as proof nothing happened elsewhere.

Texas

43 cities · up to 4" · 18,282 mapped homes
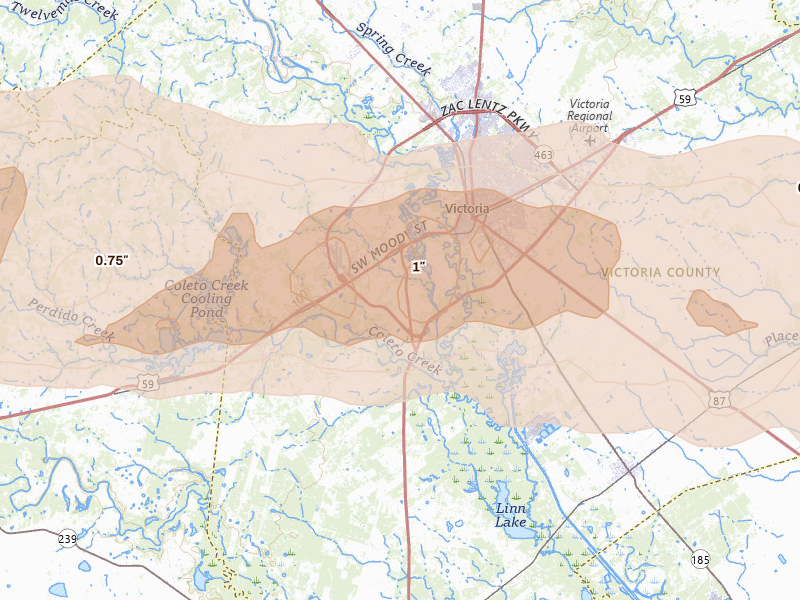
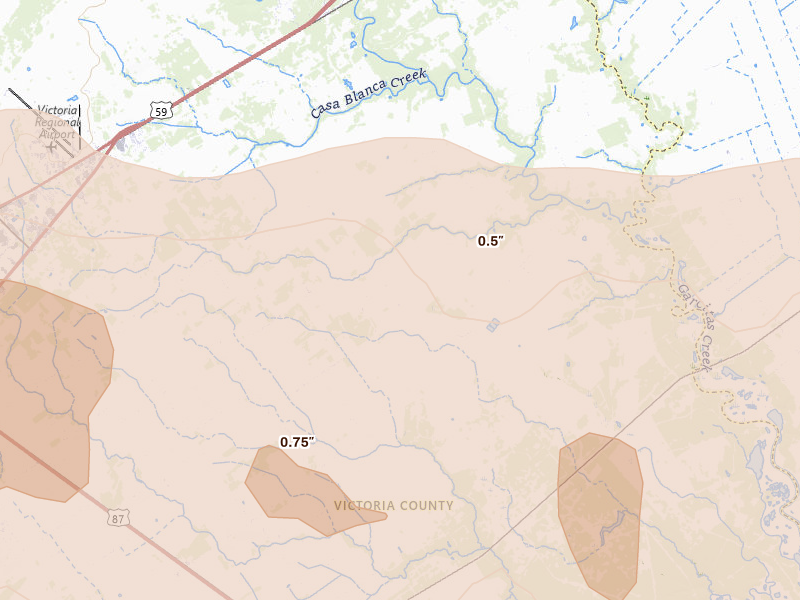
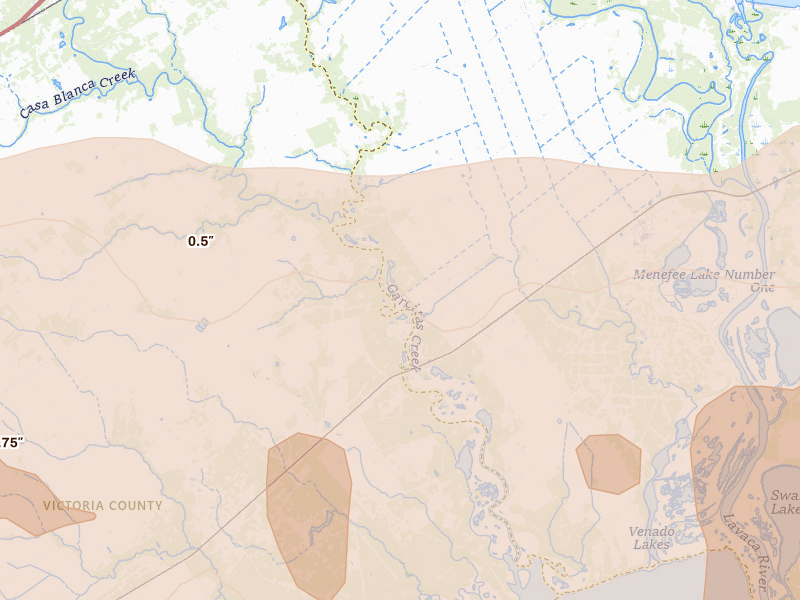
Victoria, TX 8.5 /10 severity
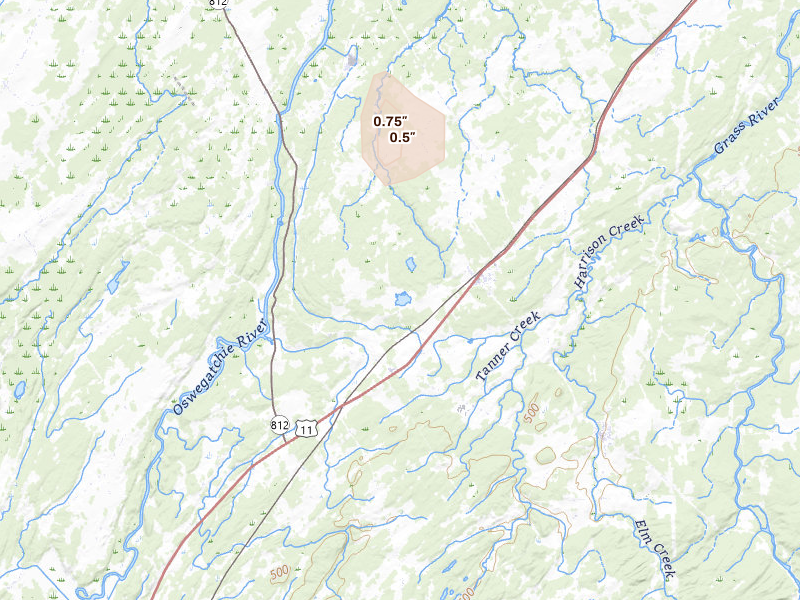
3.75" peak signal 4,823 mapped homes 3 ground reports
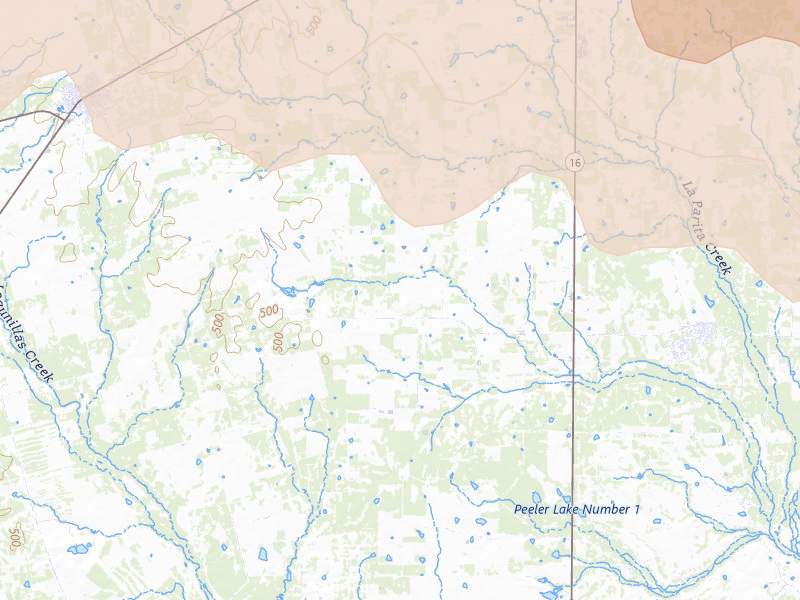
Tivoli, TX 7.5 /10 severity
4" peak signal 278 mapped homes 1 ground report
Jourdanton, TX 6.7 /10 severity
3.5" peak signal 830 mapped homes No ground reports
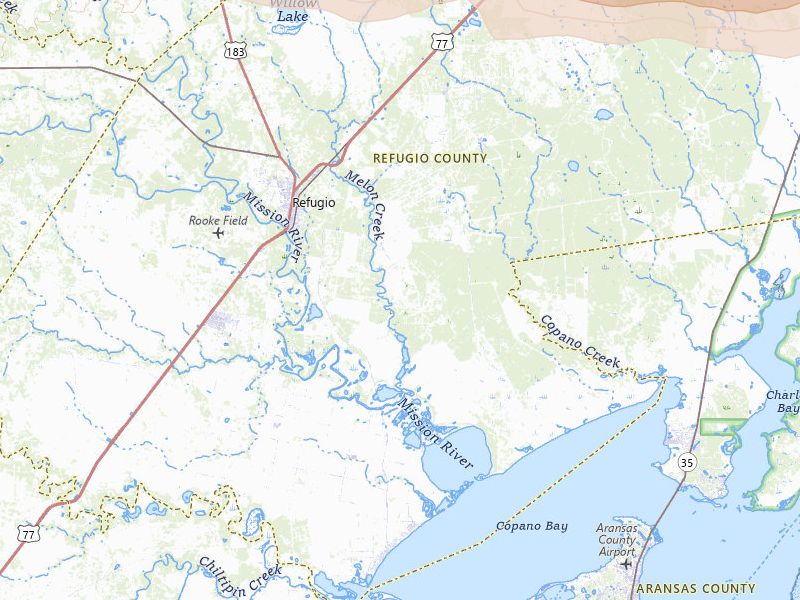
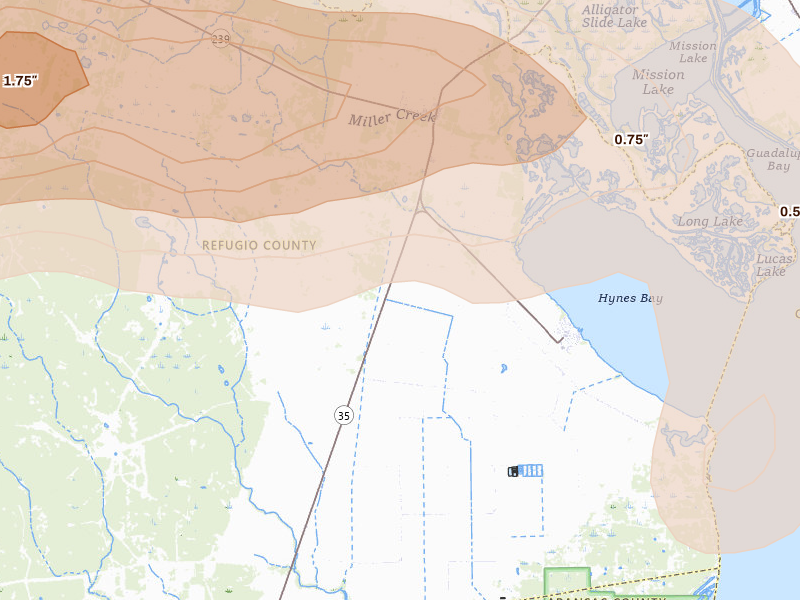
Refugio, TX 6.7 /10 severity
4" peak signal 21 mapped homes No ground reports
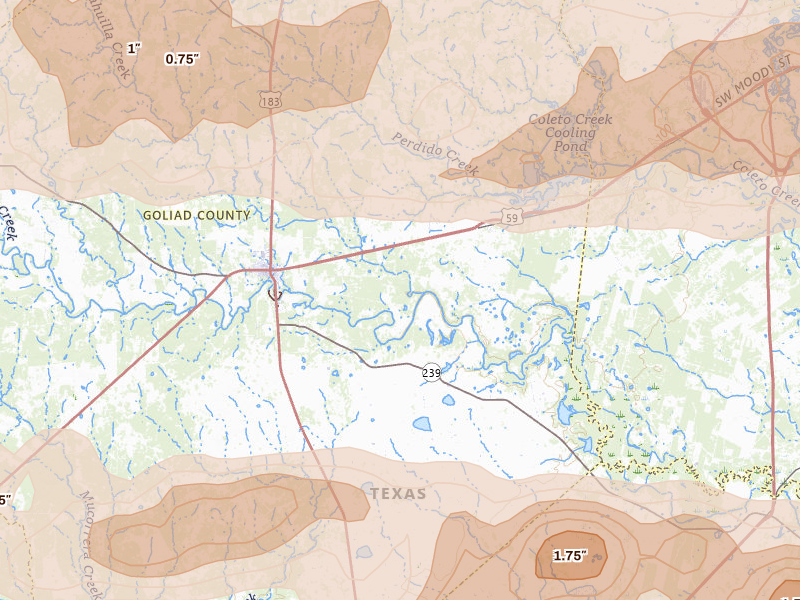
Goliad, TX 6.6 /10 severity
3.5" peak signal 489 mapped homes No ground reports
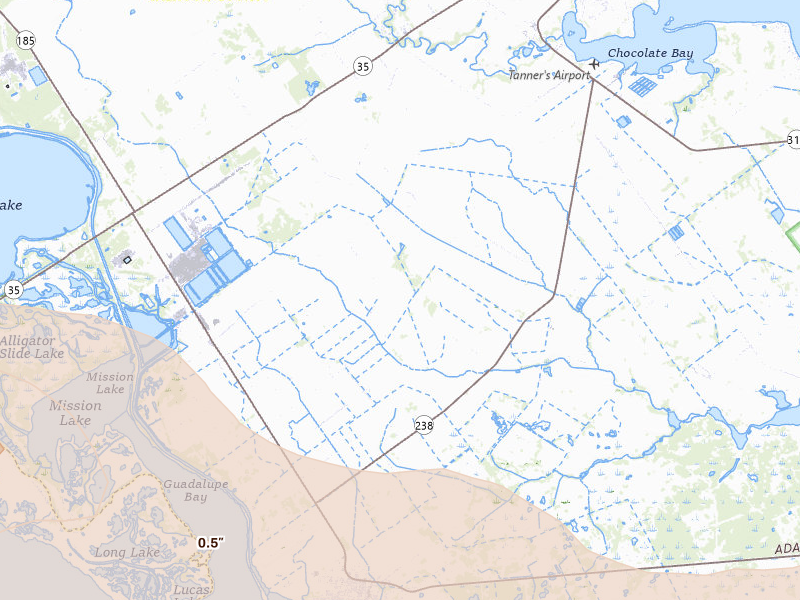
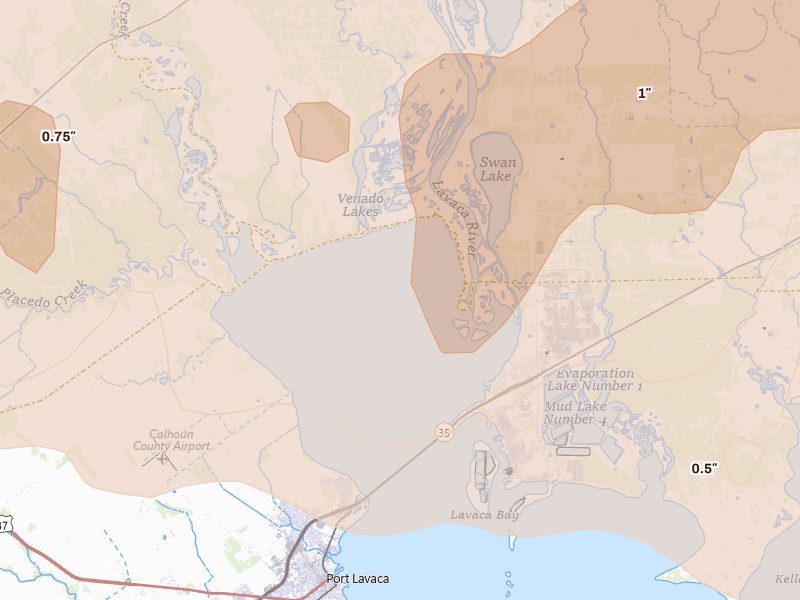
Port Lavaca, TX 5.9 /10 severity
3" peak signal 191 mapped homes 1 ground report
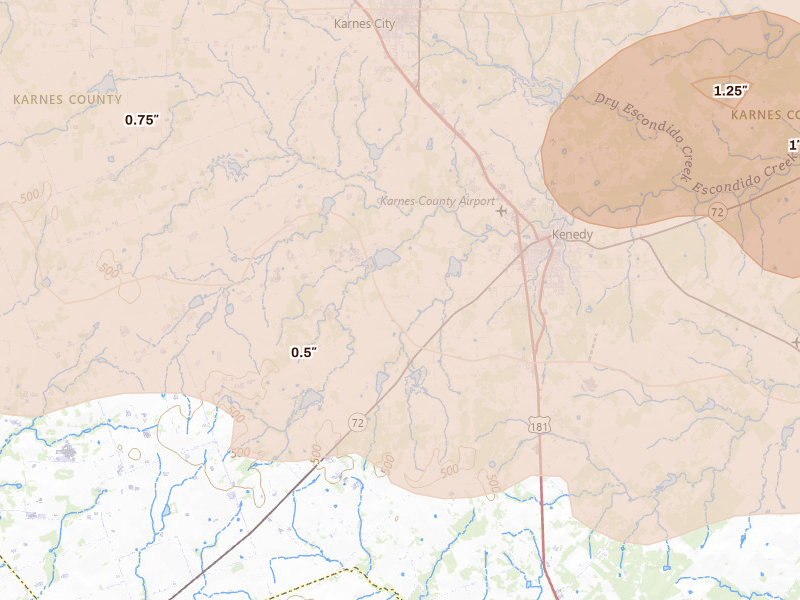
Kenedy, TX 5.7 /10 severity
2.5" peak signal 2,126 mapped homes 1 ground report
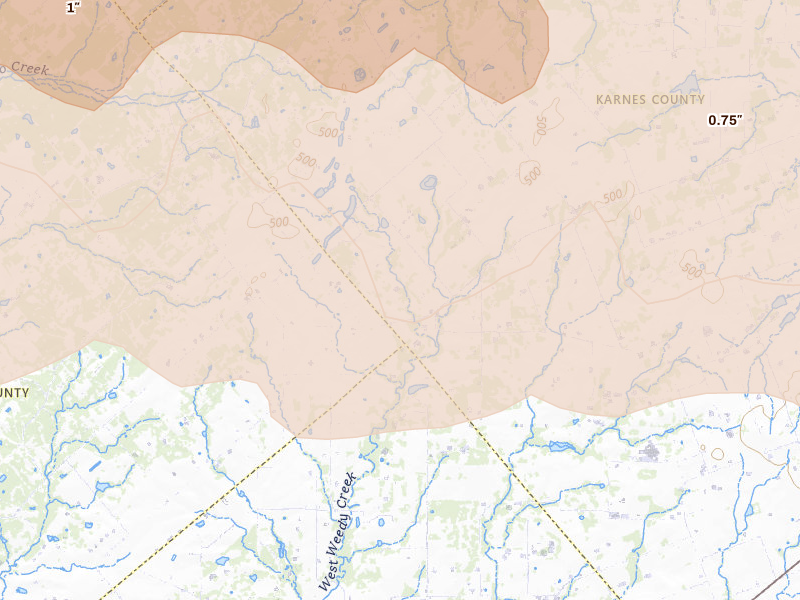
Karnes City, TX 5.6 /10 severity
2.5" peak signal 1,862 mapped homes 1 ground report
Point Comfort, TX 5.6 /10 severity
3" peak signal 41 mapped homes 1 ground report
Pleasanton, TX 5.5 /10 severity
2.75" peak signal 670 mapped homes No ground reports
Vanderbilt, TX 5.5 /10 severity
3" peak signal 98 mapped homes No ground reports
Falls City, TX 5.4 /10 severity
2.75" peak signal 421 mapped homes No ground reports
Port O Connor, TX 5.2 /10 severity
2.5" peak signal 790 mapped homes No ground reports
Runge, TX 5.2 /10 severity
2.5" peak signal 700 mapped homes No ground reports
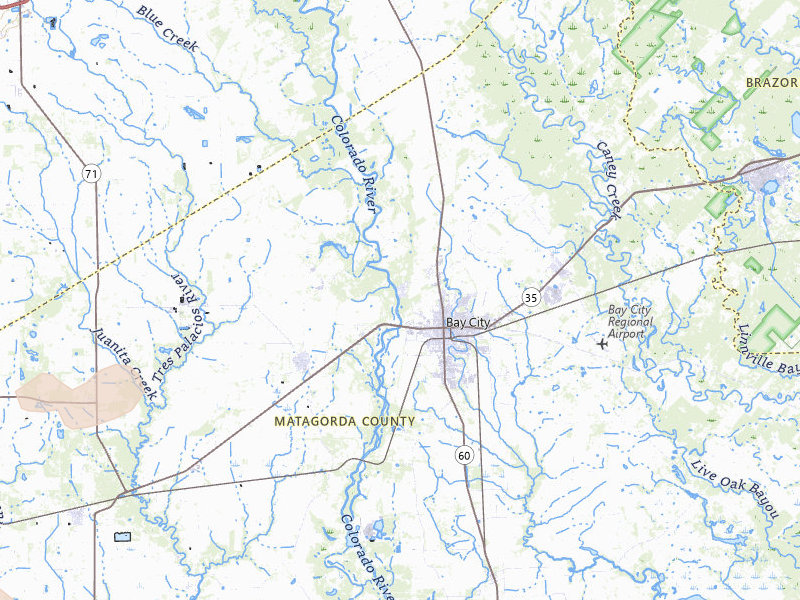
Bay City, TX 5.0 /10 severity
2" peak signal 1,010 mapped homes 2 ground reports
Inez, TX 5.0 /10 severity
2.75" peak signal 64 mapped homes No ground reports
La Salle, TX 5.0 /10 severity
2.75" peak signal 51 mapped homes No ground reports
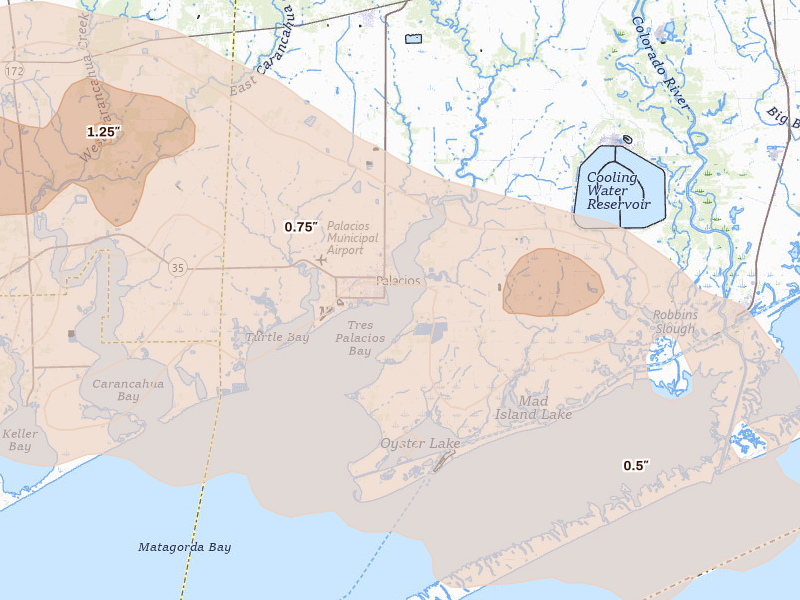
Palacios, TX 5.0 /10 severity
2" peak signal 1,070 mapped homes 2 ground reports
Lolita, TX 4.7 /10 severity
2.5" peak signal 66 mapped homes No ground reports
Three Rivers, TX 4.7 /10 severity
2.5" peak signal 96 mapped homes No ground reports
Hobson, TX 4.6 /10 severity
2.25" peak signal 234 mapped homes No ground reports
Placedo, TX 4.6 /10 severity
2.5" peak signal 60 mapped homes No ground reports
Pettus, TX 4.4 /10 severity
2.25" peak signal 103 mapped homes No ground reports
Beeville, TX 4.2 /10 severity
2.25" peak signal 40 mapped homes No ground reports
Seadrift, TX 4.1 /10 severity
2" peak signal 182 mapped homes No ground reports
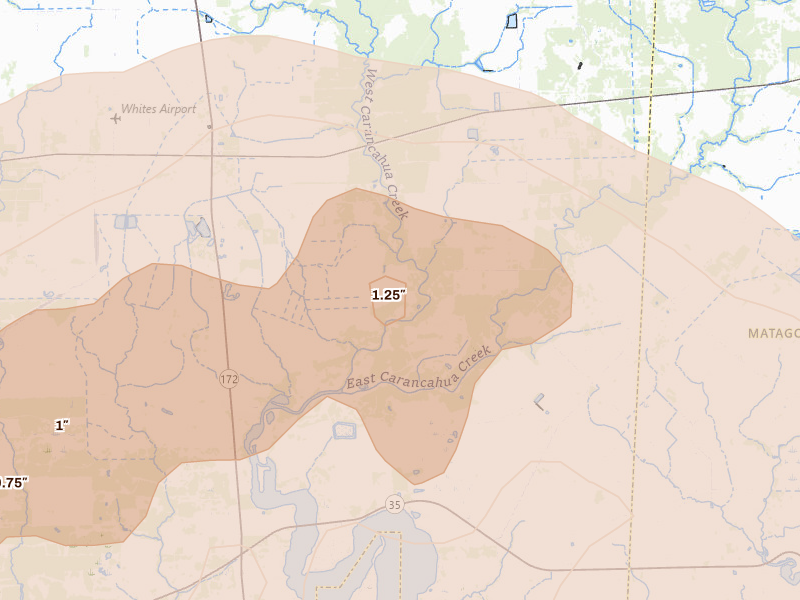
La Ward, TX 3.8 /10 severity
2" peak signal 43 mapped homes No ground reports
Bigfoot, TX 3.7 /10 severity
1.75" peak signal 147 mapped homes No ground reports
Charlotte, TX 3.5 /10 severity
1.75" peak signal 62 mapped homes No ground reports
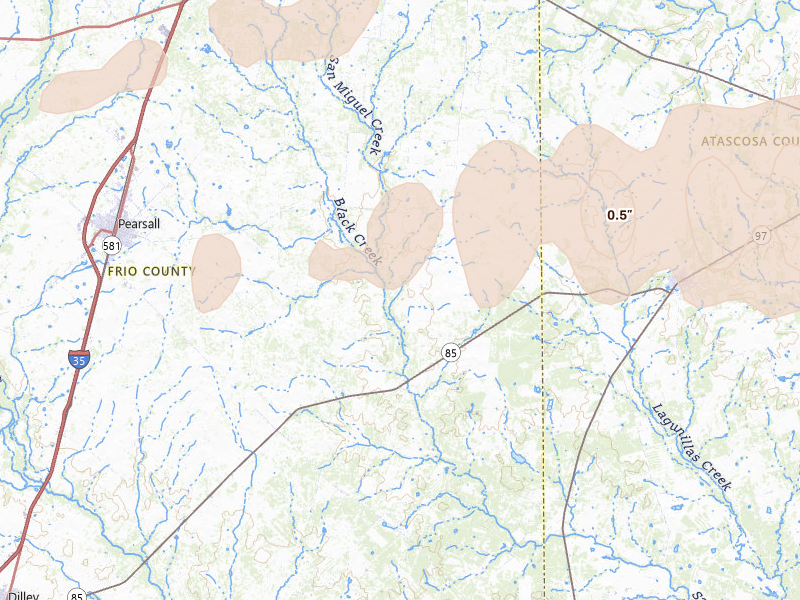
Yorktown, TX 3.5 /10 severity
1.75" peak signal 57 mapped homes No ground reports
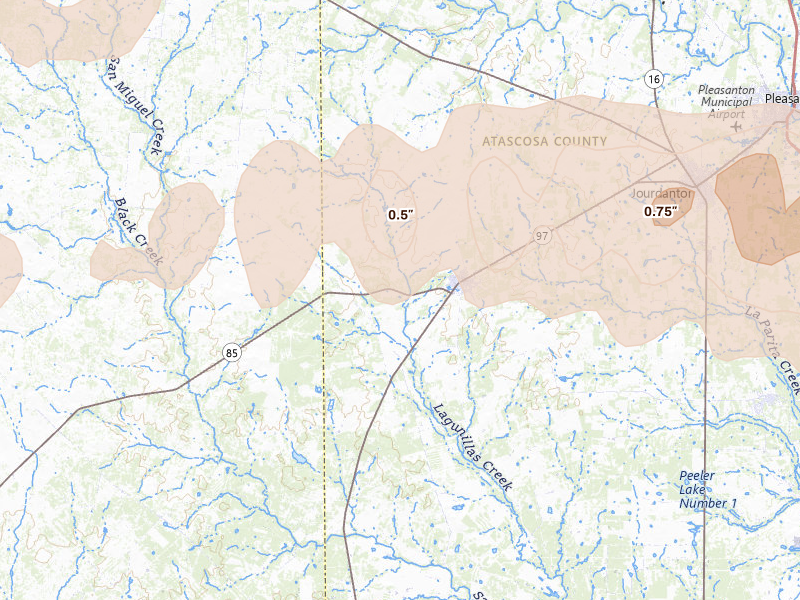
La Pryor, TX 3.2 /10 severity
1.25" peak signal 521 mapped homes No ground reports
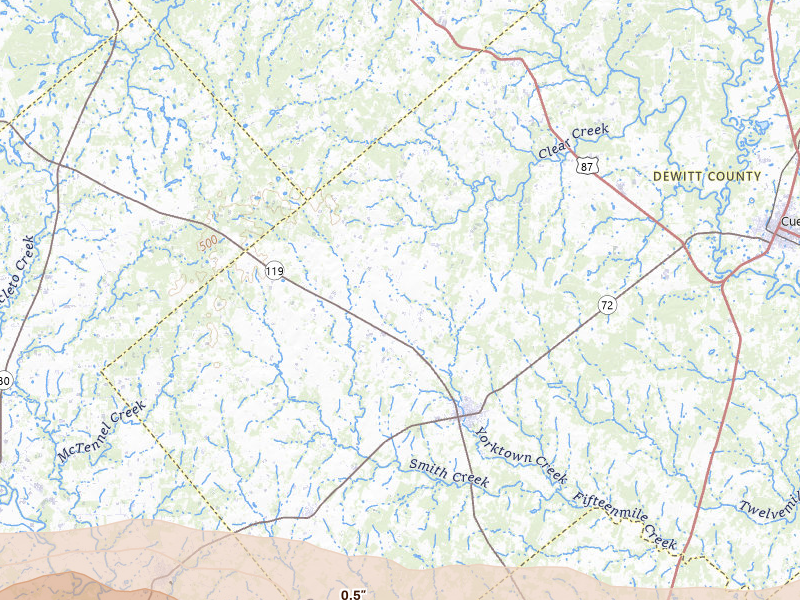
Moore, TX 2.8 /10 severity
1.25" peak signal 70 mapped homes No ground reports
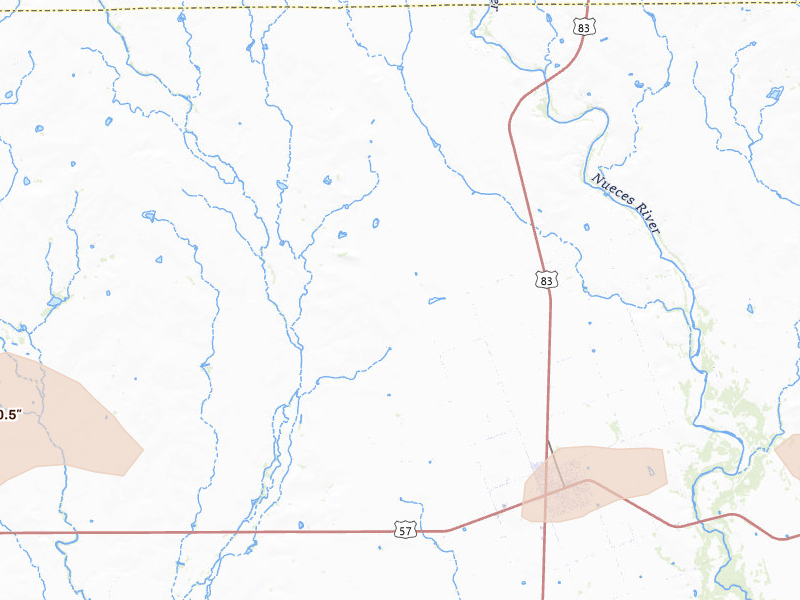
Pearsall, TX 2.7 /10 severity
1.25" peak signal 37 mapped homes No ground reports
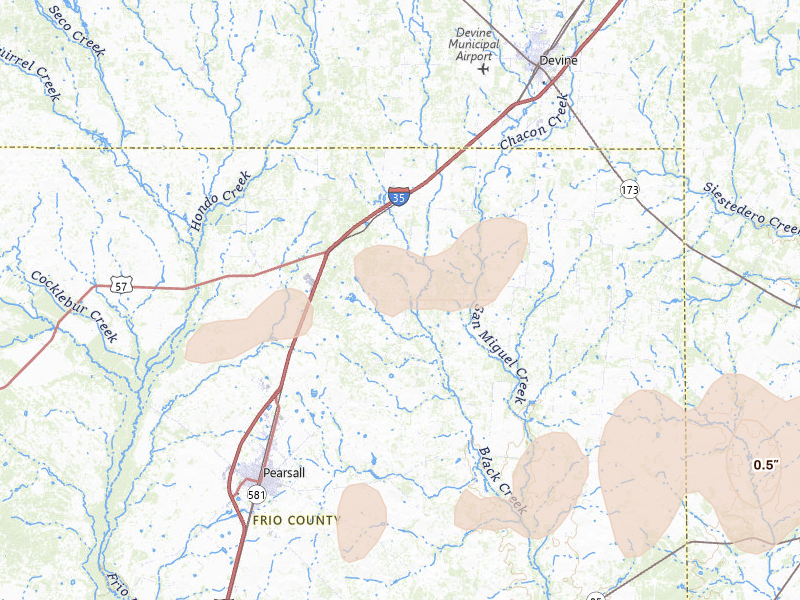
Whitsett, TX 2.6 /10 severity
1.25" peak signal 29 mapped homes No ground reports
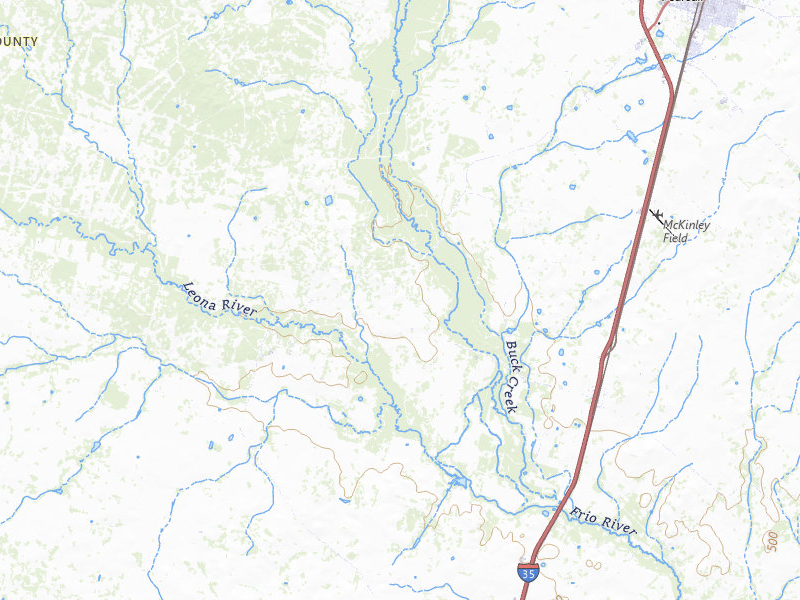
El Campo, TX 2.5 /10 severity
1" peak signal 86 mapped homes No ground reports
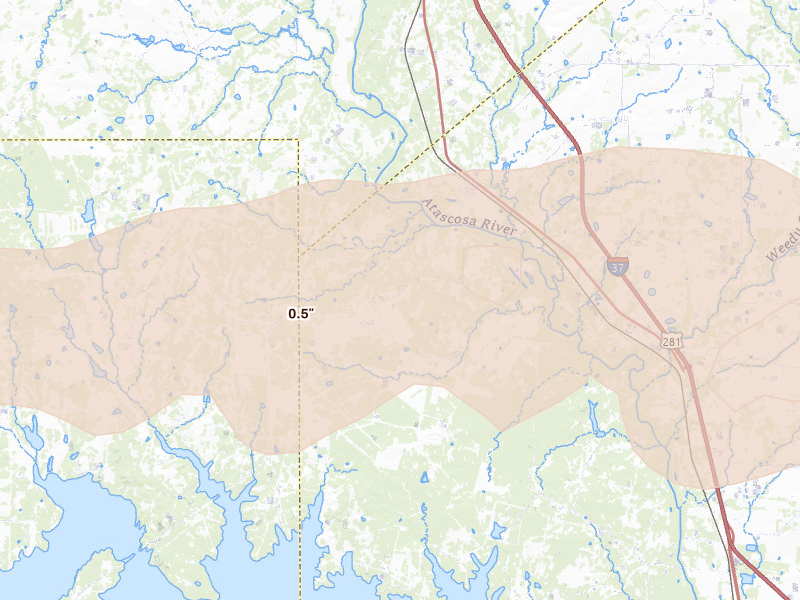
Blessing, TX 2.4 /10 severity
1" peak signal 64 mapped homes No ground reports
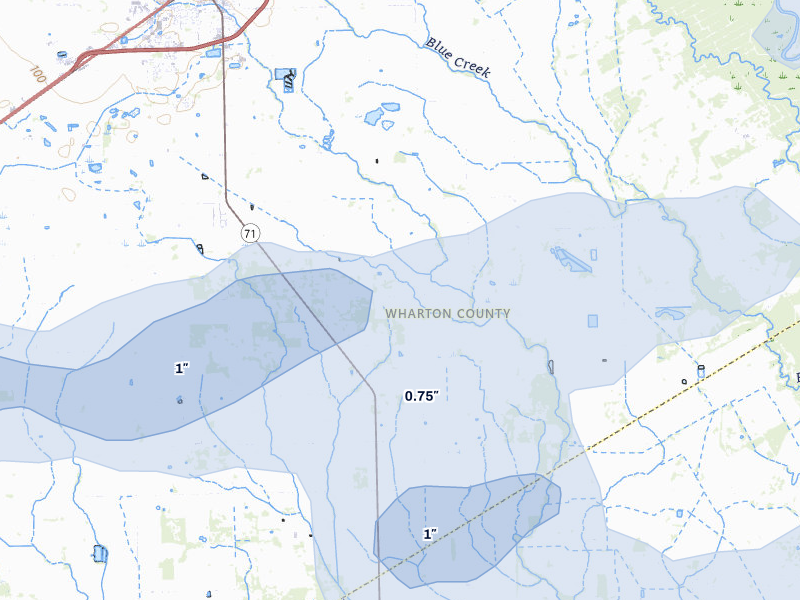
Beasley, TX 2.3 /10 severity
0.75" peak signal 239 mapped homes No ground reports
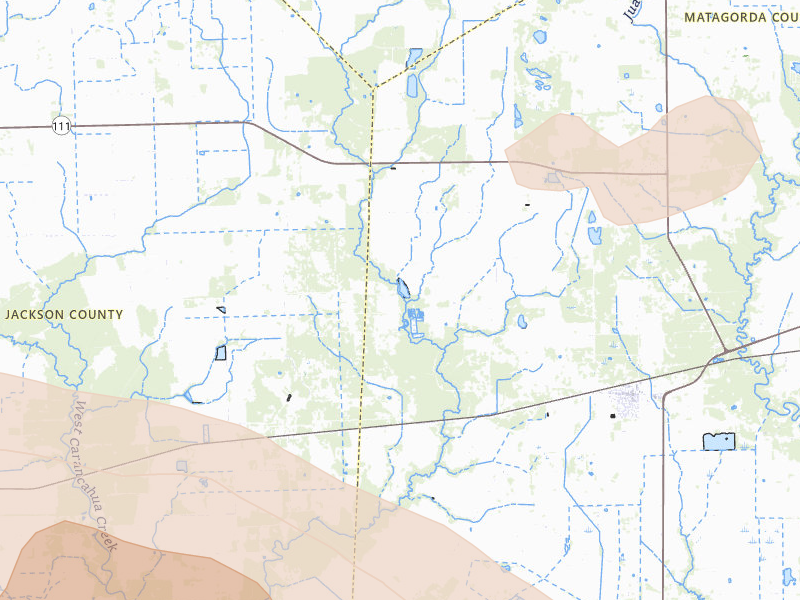
Wharton, TX 2.3 /10 severity
0.75" peak signal 217 mapped homes No ground reports
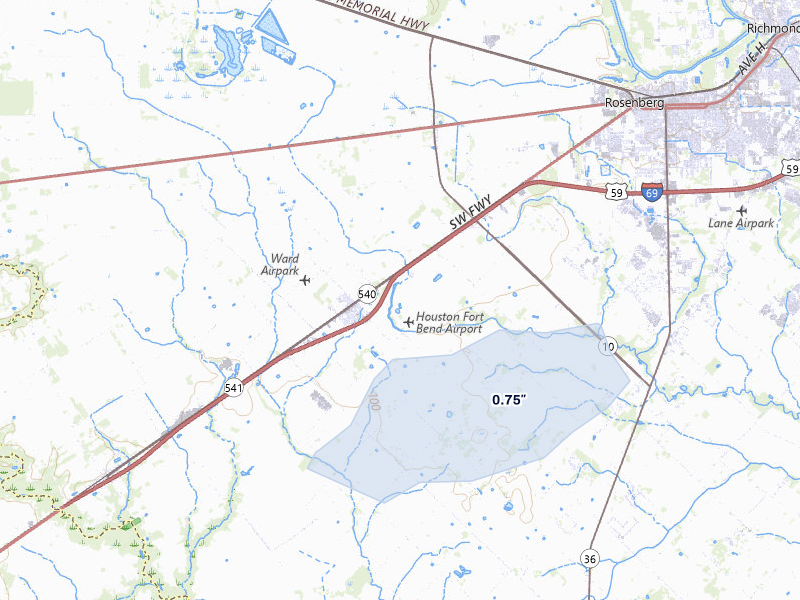
Hallettsville, TX 2.2 /10 severity
0.75" peak signal 151 mapped homes No ground reports
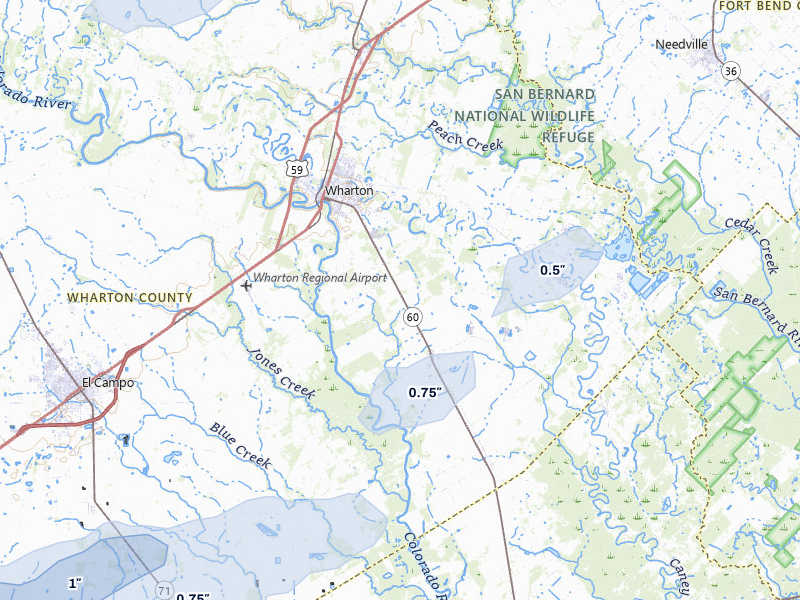
Boling, TX 1.9 /10 severity
0.5" peak signal 216 mapped homes No ground reports
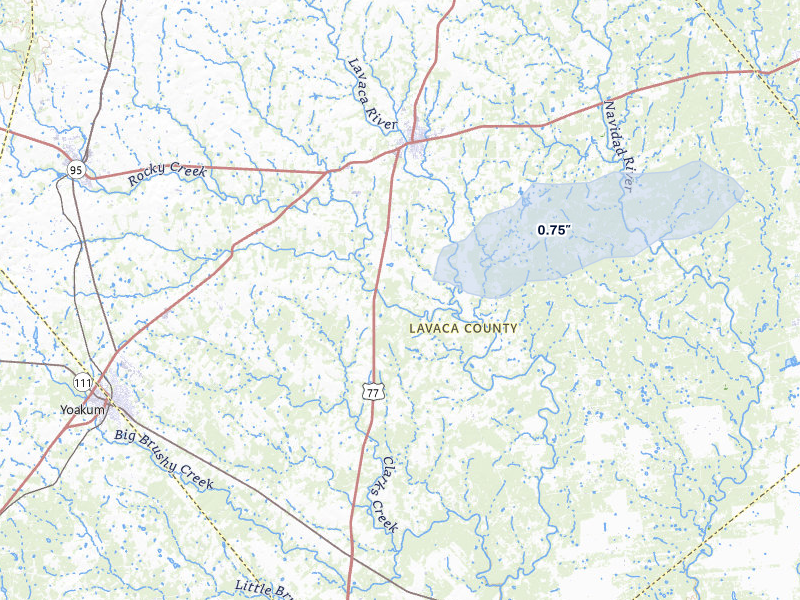
Garwood, TX 1.7 /10 severity
0.75" peak signal 12 mapped homes No ground reports
Sabinal, TX 1.7 /10 severity
0.75" peak signal 14 mapped homes No ground reports
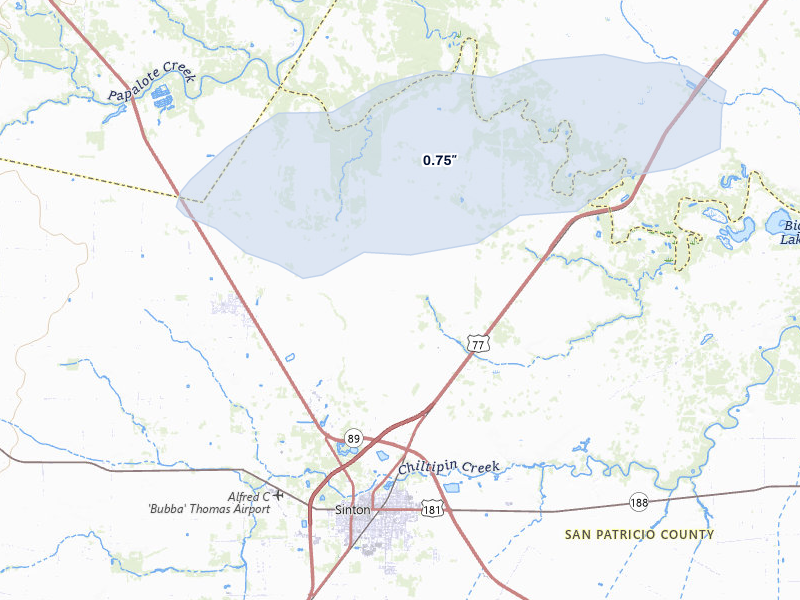
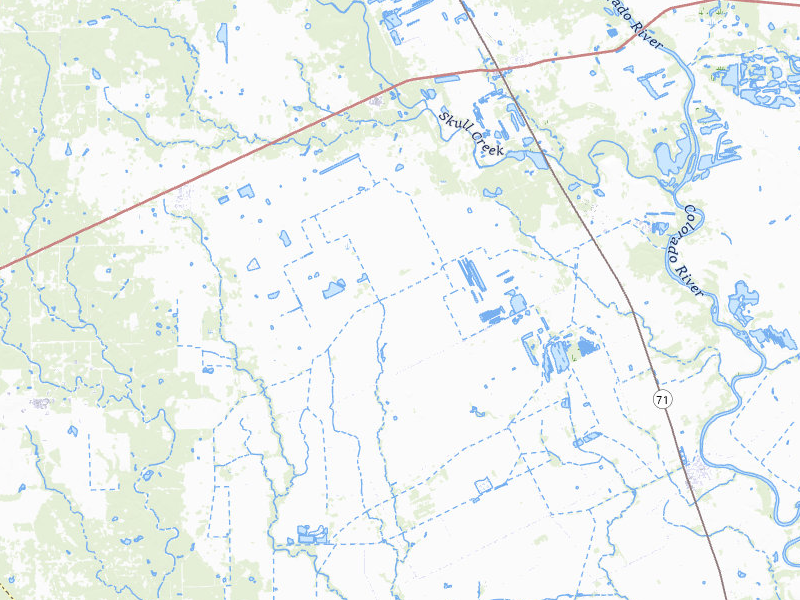
Sinton, TX 1.3 /10 severity
0.75" peak signal 1 mapped homes No ground reports
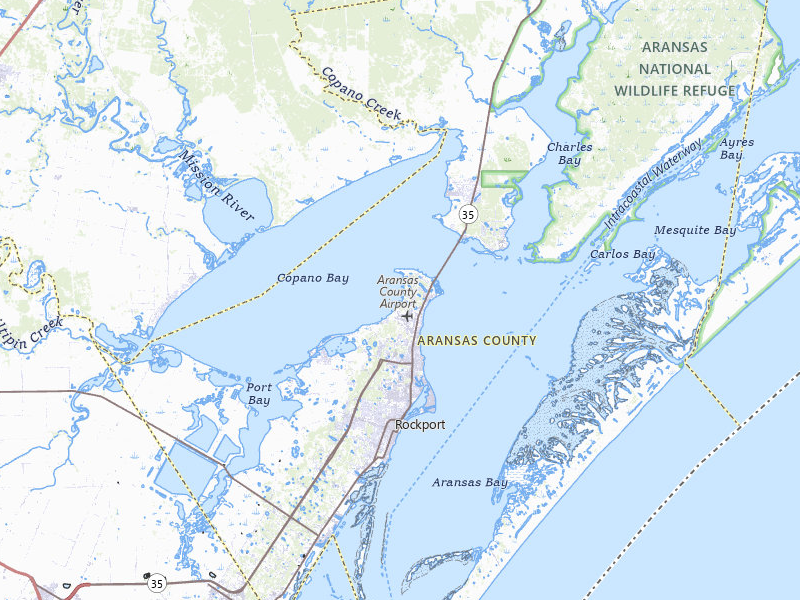
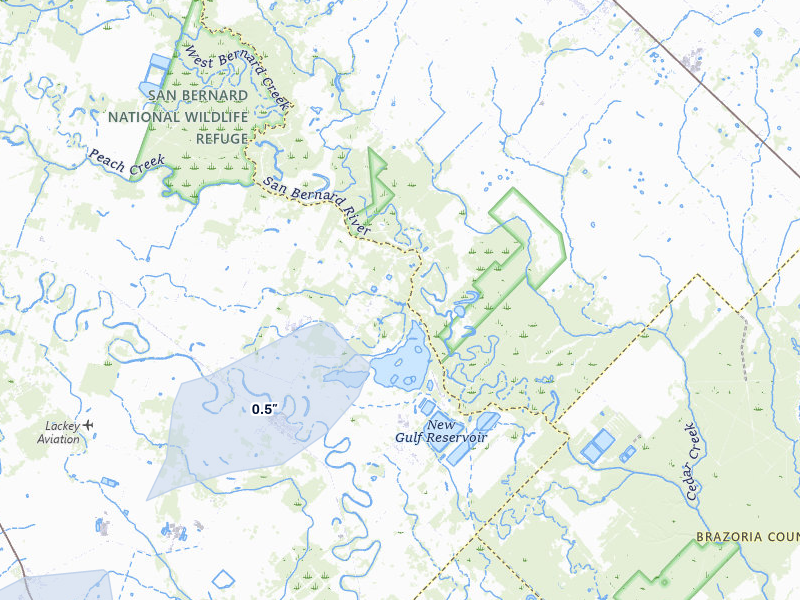
Rockport, TX 0.8 /10 severity
0.5" peak signal 0 mapped homes No ground reports

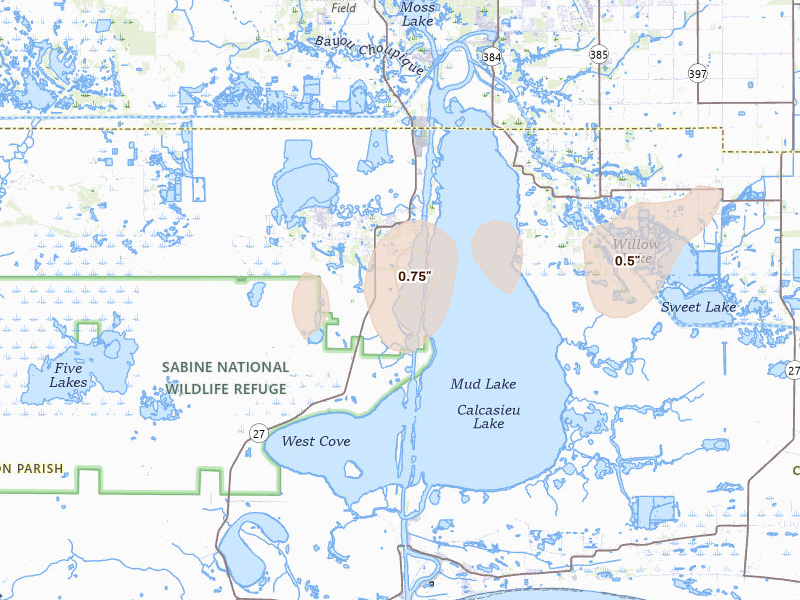
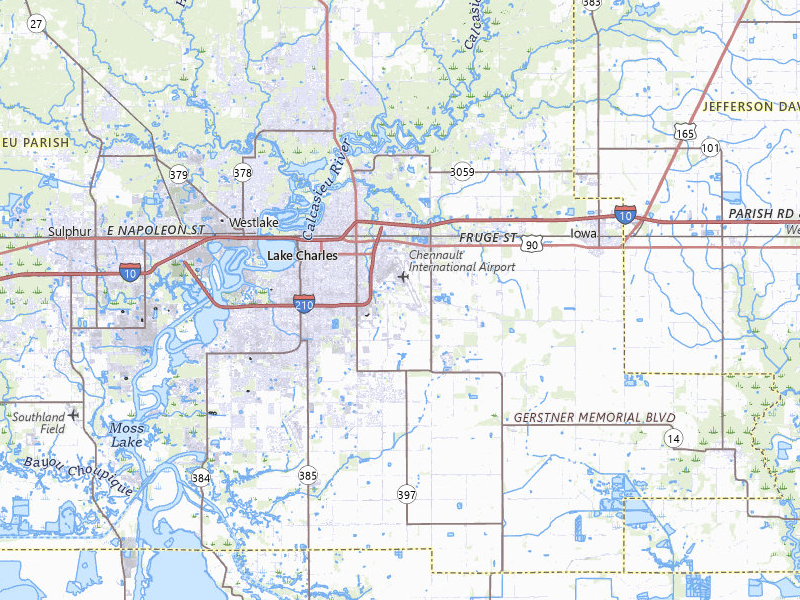
Louisiana

3 cities · up to 2" · 202 mapped homes
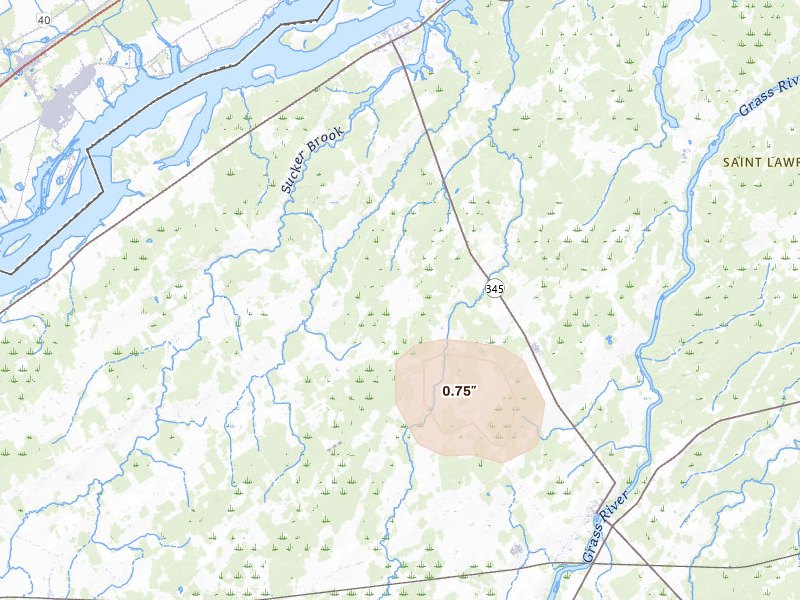
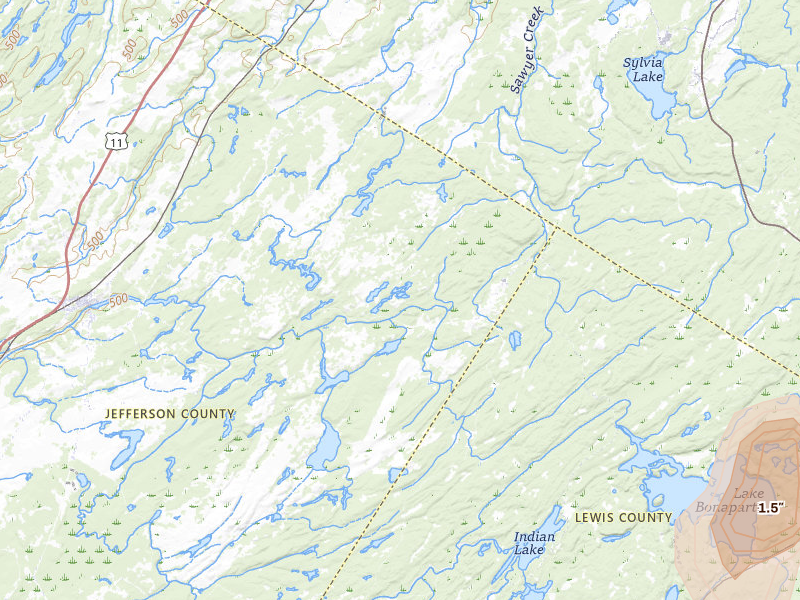
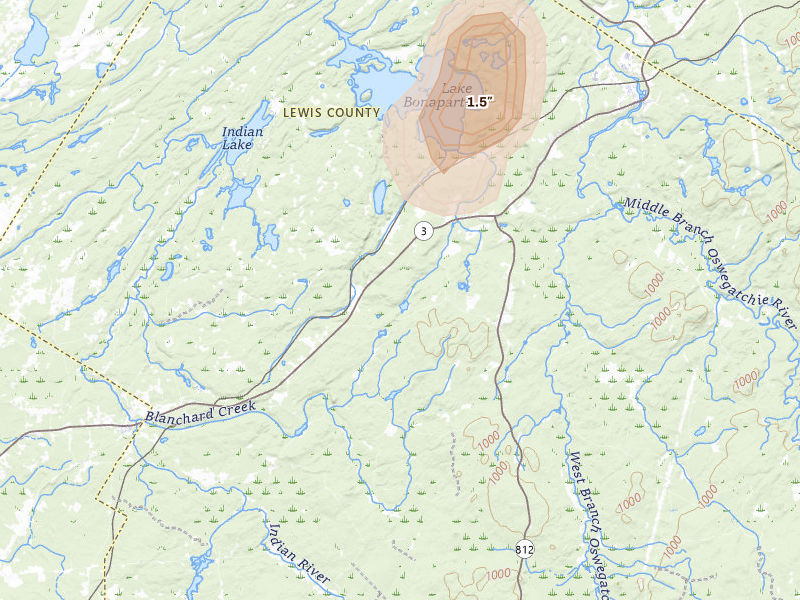
New York

4 cities · up to 1.5" · 702 mapped homes
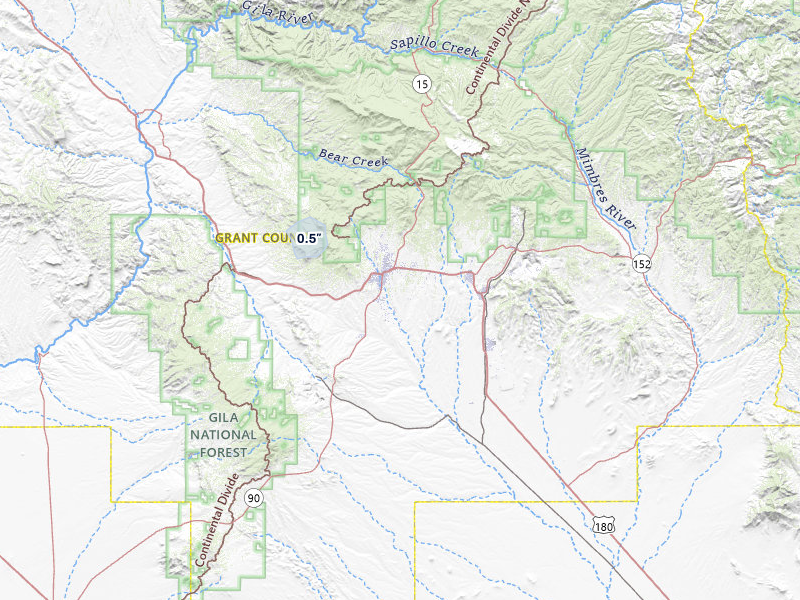
New Mexico

1 city · up to 0.5" · 0 mapped homes
← All storm days

Overview Pro · iPhone + web

One app for your prospecting day.

The hail map, your next recommended area, and the tools to work it. Start on your own; the same subscription also includes access for up to 4 team members.

Overview Pro

One plan · iPhone + web

Monthly · US App Store

$149.99 / month

5,000 new addresses per user each month on Pro. Put your 200 trial addresses to work before another week goes to guesswork.

Optional outreach

+ $0.21 per contact returned
Available homeowner names and phone numbers, with freshness and DNC flags.
+ $0.75 per postcard mailed
Print, postage, and delivery tracking included.

What's included

Get recommended places to prospect, or draw your own. The same plan gives you the tools to work either one.

  • Hail maps, storm history, and live radar
  • Curated prospecting recommendations and Quests
  • Canvassing sessions and navigation
  • Door outcomes, notes, and photos
  • Visit history and follow-up Quests
  • Alerts for your saved territories
  • Polygon and hexagon draw tools
  • Saved work areas and address lists
  • CSV exports for your dialer or CRM
  • XP, levels, and the leaderboard
  • Access on iPhone and the web
  • Up to 4 team members

7-day free trial in the iPhone app. No card required to start.

Choose whether to subscribe when your trial ends. Paid subscriptions renew monthly. Manage or cancel in your Apple Account settings.

See all pricing and billing details →
Start free trial

Web trial: 7 days free. Card required. $150/month after the trial unless cancelled.

The next storm won’t wait for you.

Set your territory and alerts today. When hail hits, use Overview to choose your streets and get moving.

Download on the App Store

7-day free trial in the iPhone app. No card required to start.

For iPhone. Android coming soon.

Open May 1 on the live map → Start free trial

Web trial: 7 days free. Card required. $150/month after the trial unless cancelled.

Storm days are convective days (noon-to-noon UTC). Cities and counts are the set Overview tracks, not every place hail fell. Ground reports are public-domain observations from the NOAA Storm Prediction Center; radar sizes are detections and estimates, not confirmed damage.