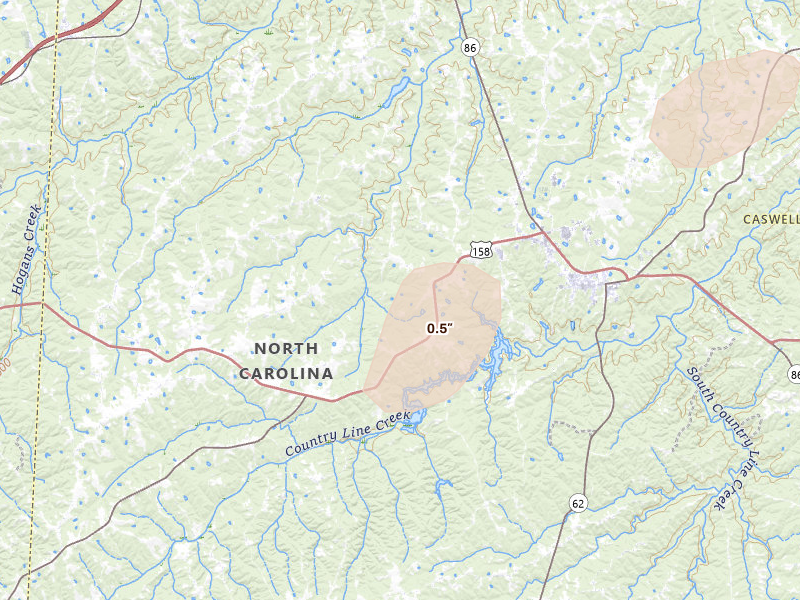
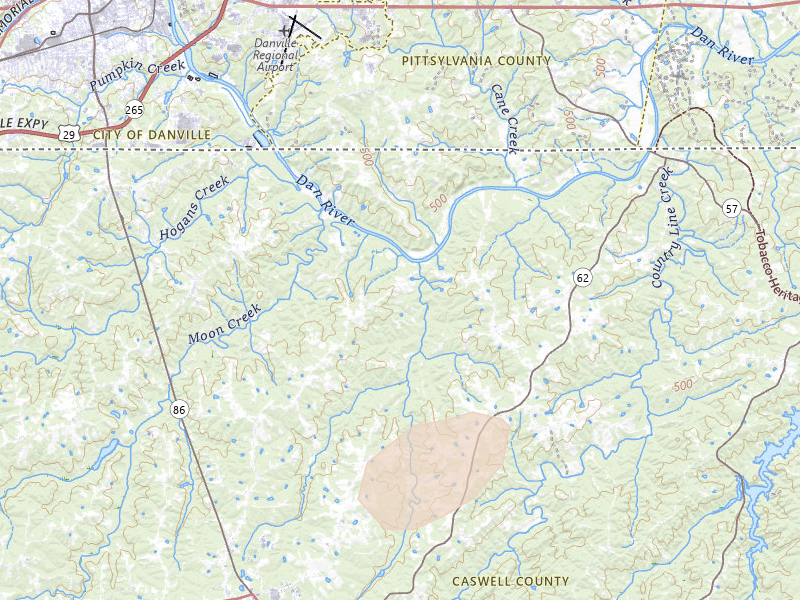
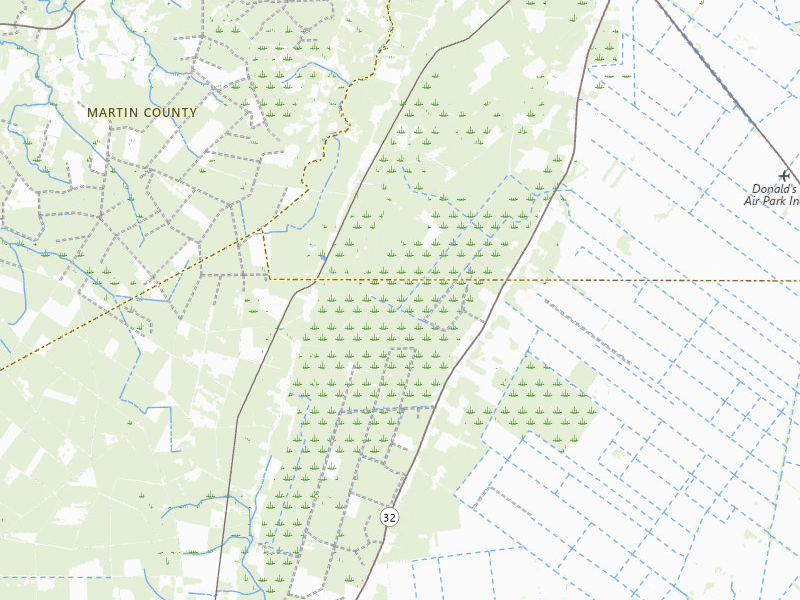
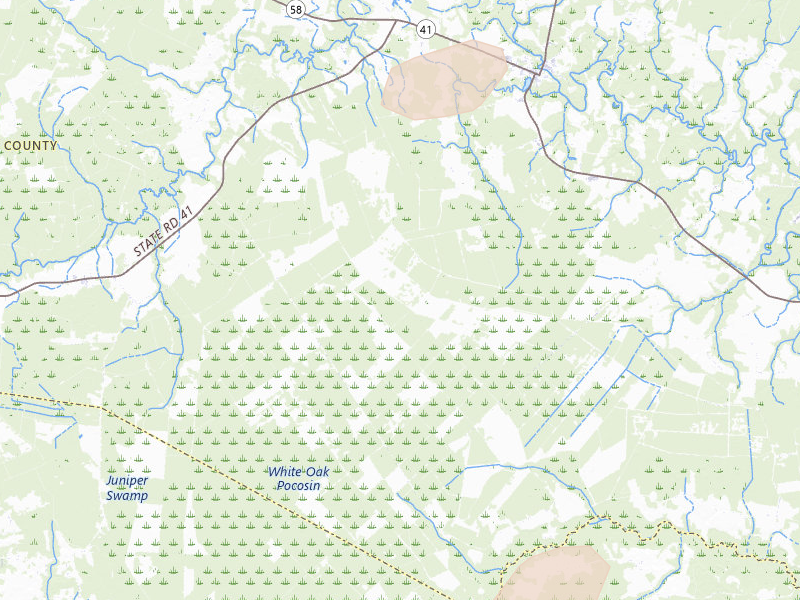
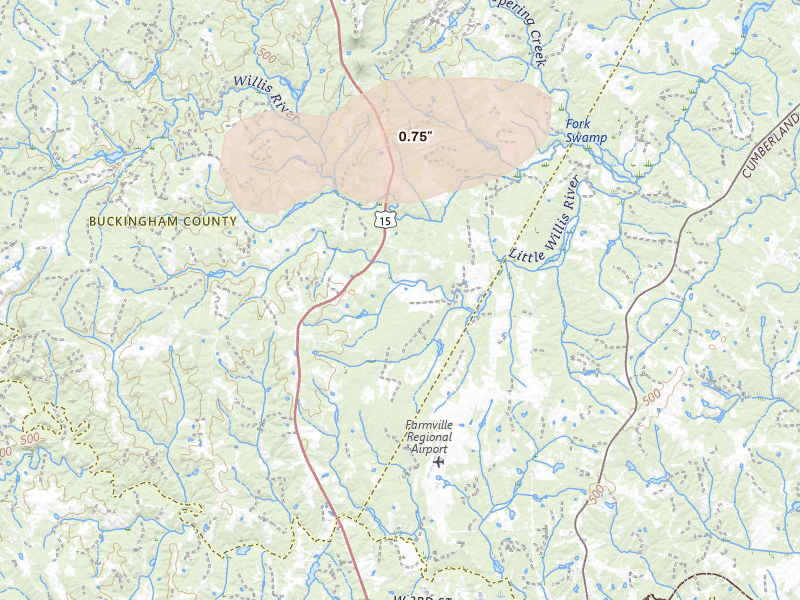
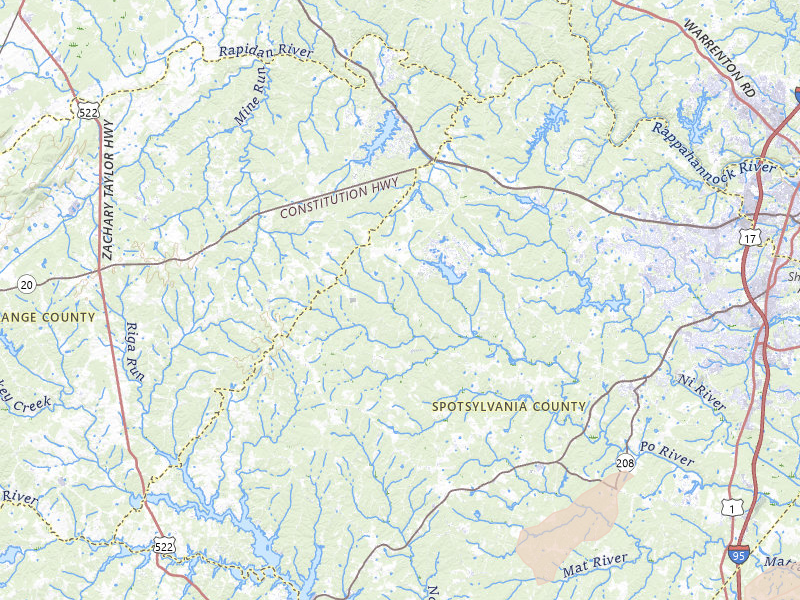
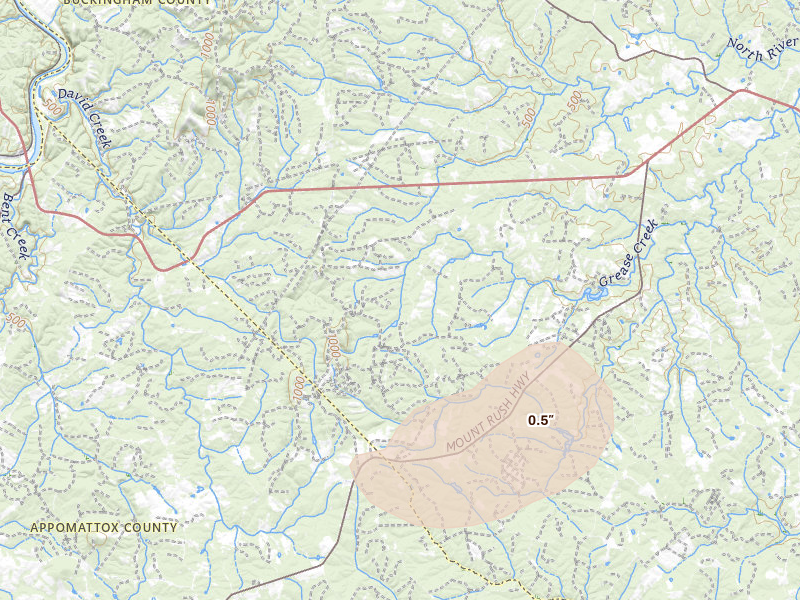
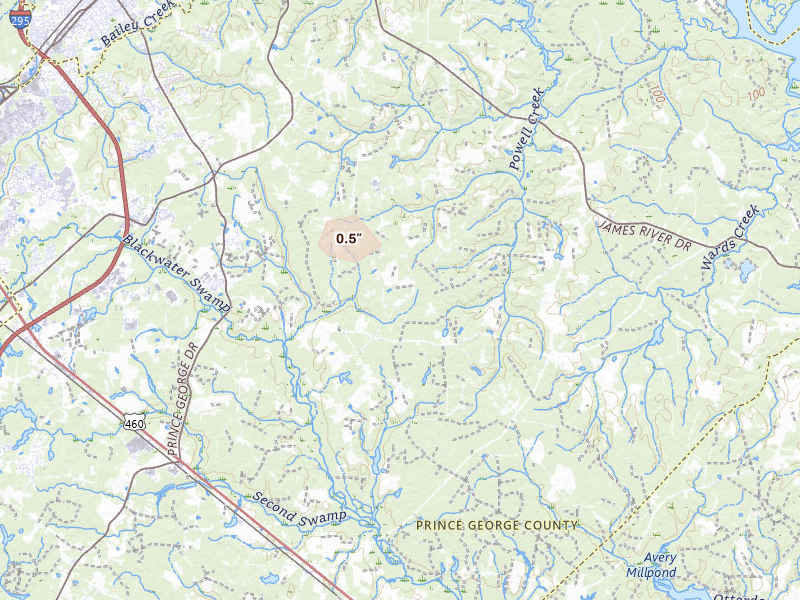
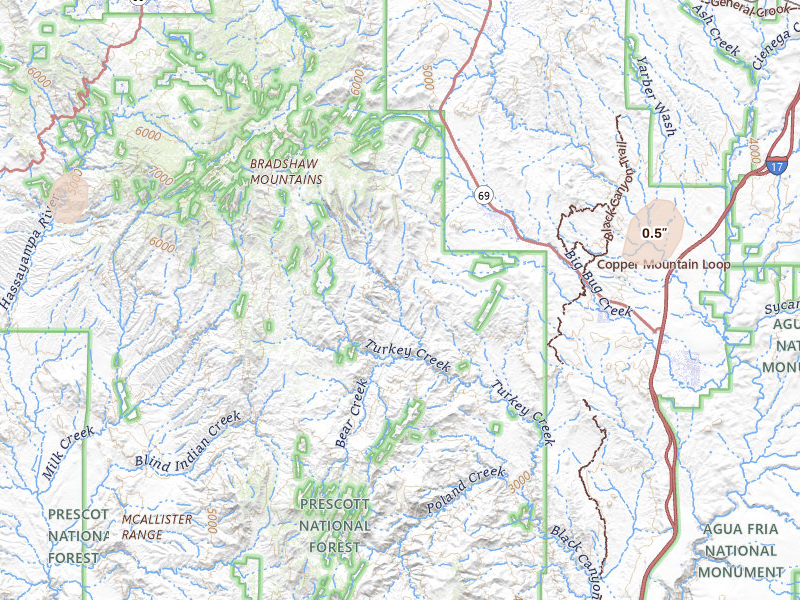
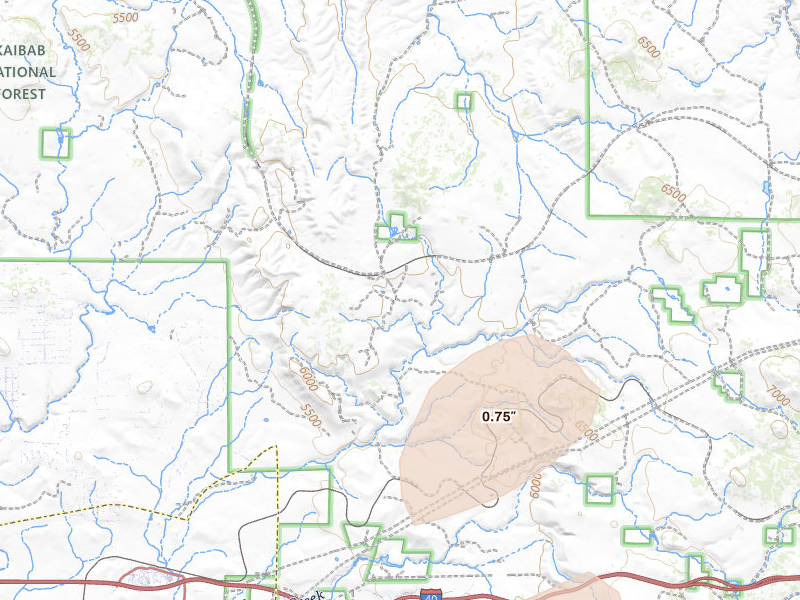
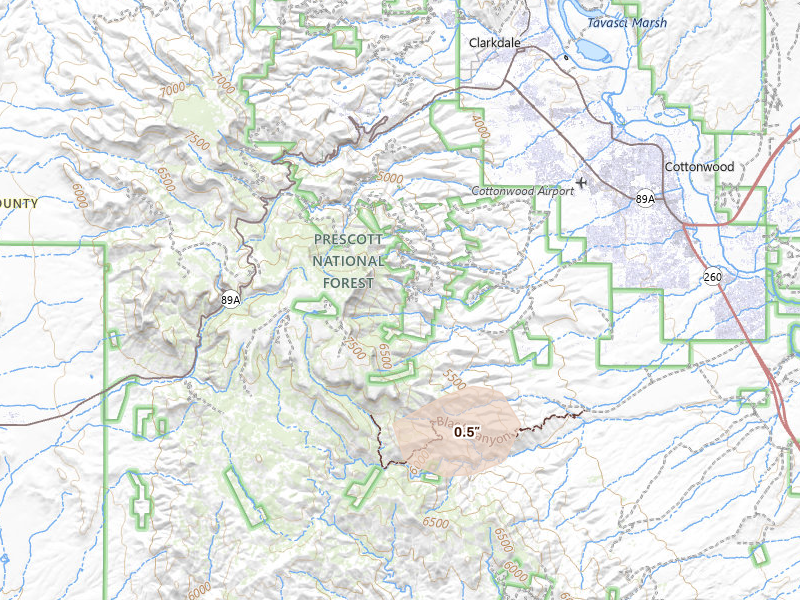
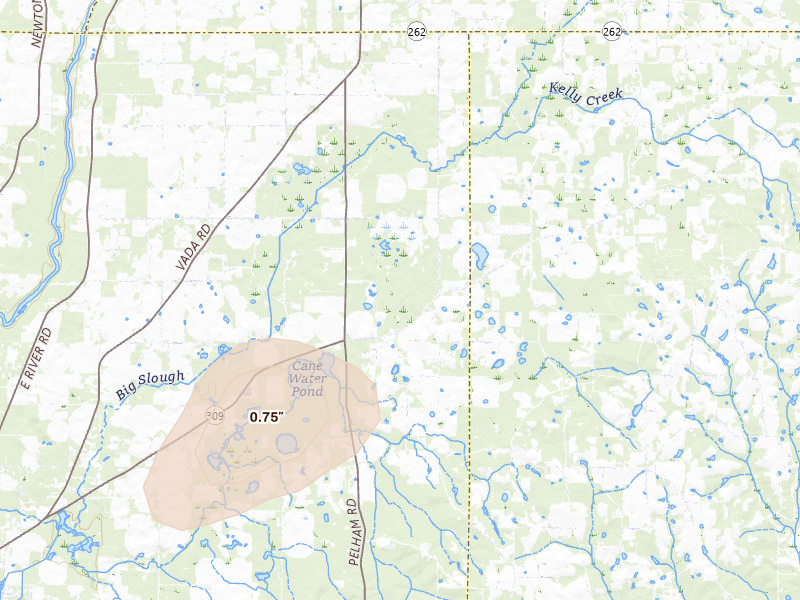
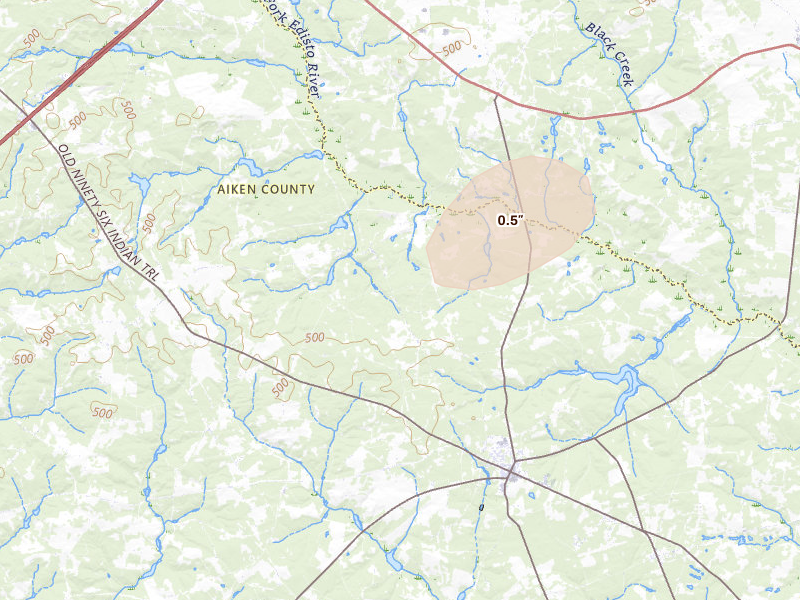
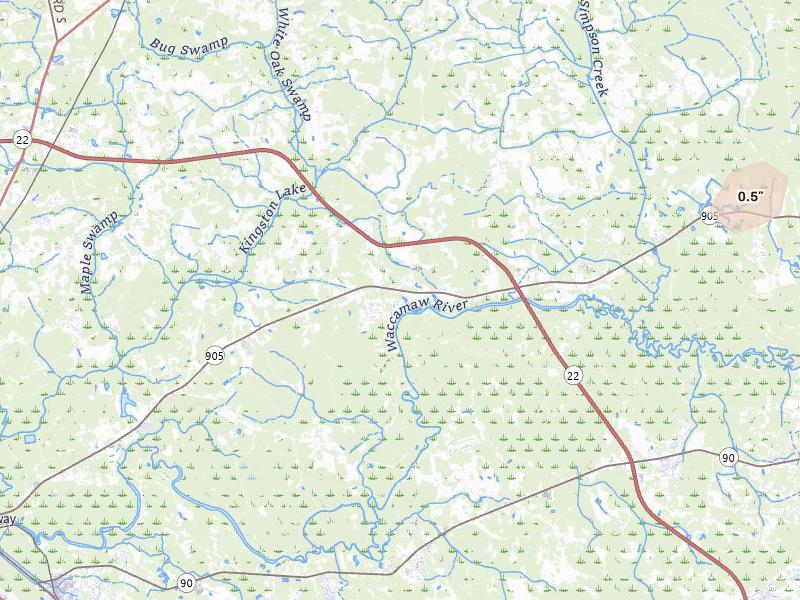
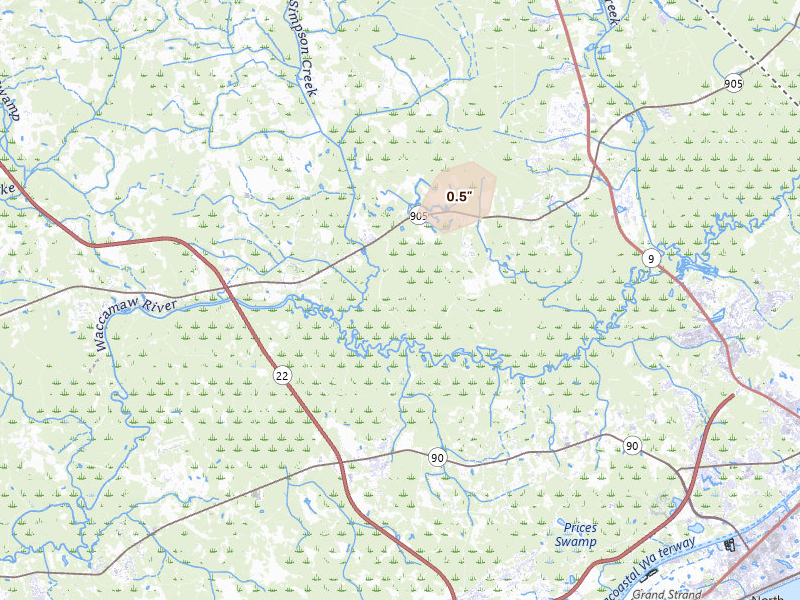
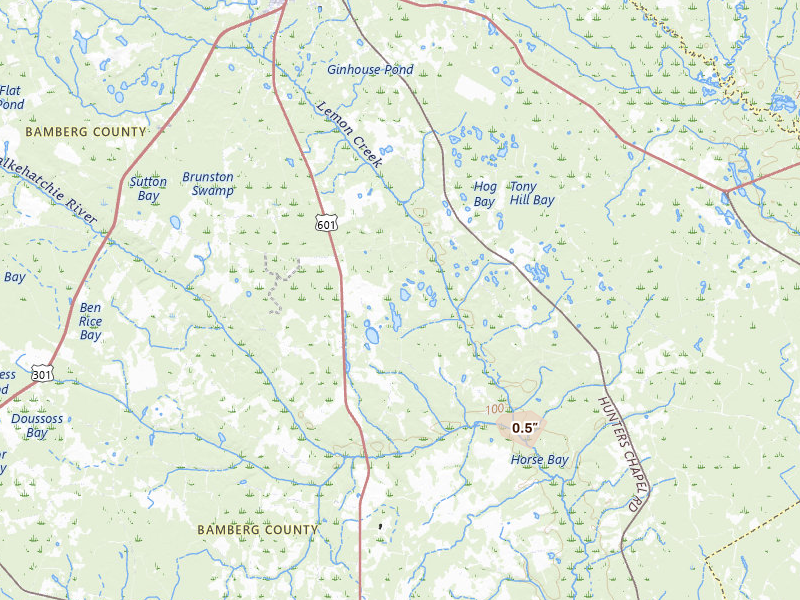
Hail storms on Jun 14, 2026

145 cities across 18 states recorded hail on Jun 14, 2026 — a multi-state outbreak. The peak radar-indicated size reached 1.75" over Welcome, about golf ball.

Download on the App Store

7-day free trial in the iPhone app. No card required to start.

For iPhone. Android coming soon.

Web trial: 7 days free. Card required. $150/month after the trial unless cancelled.

Cities hit 145 across 18 states
Peak hail signal 1.75" ≈ golf ball · Welcome
Homes in footprints 138,149
Ground reports 21

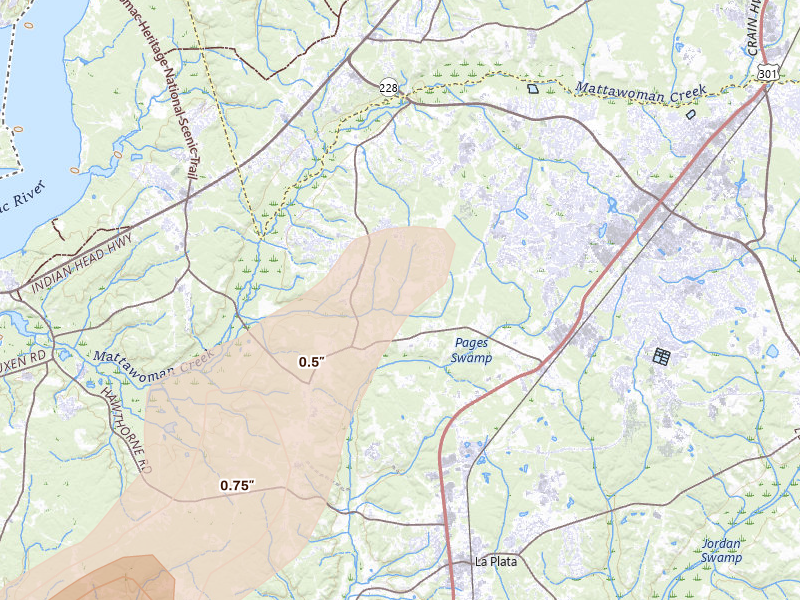
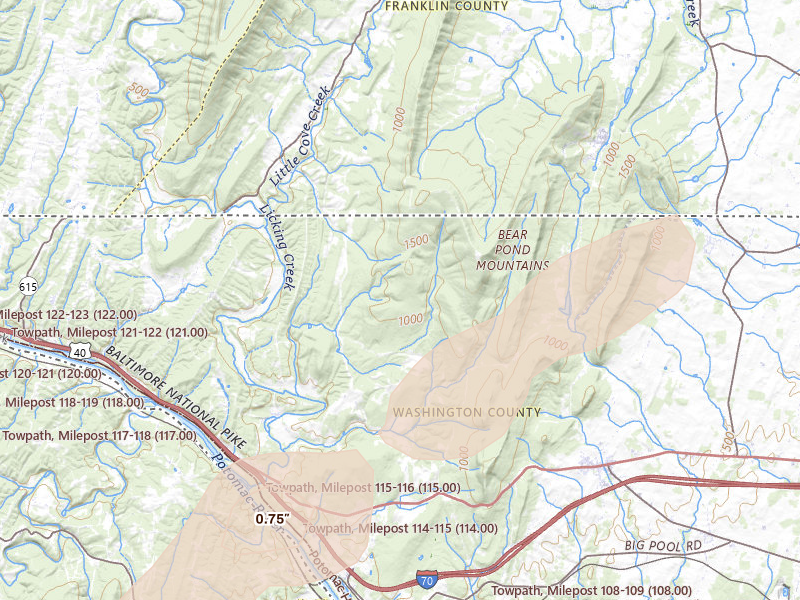
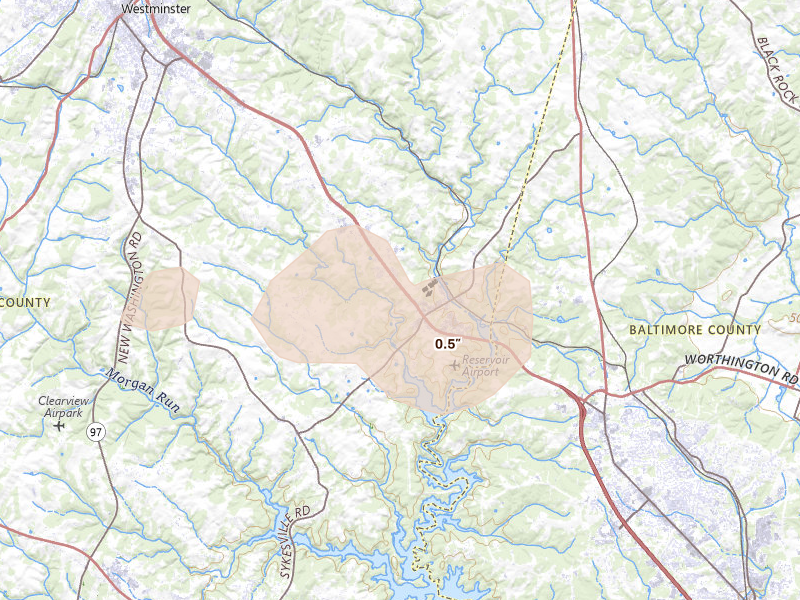
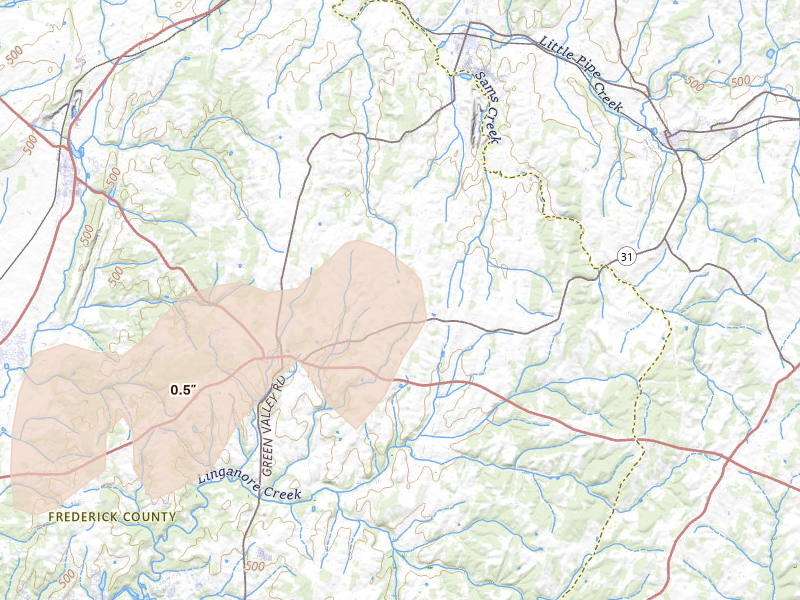
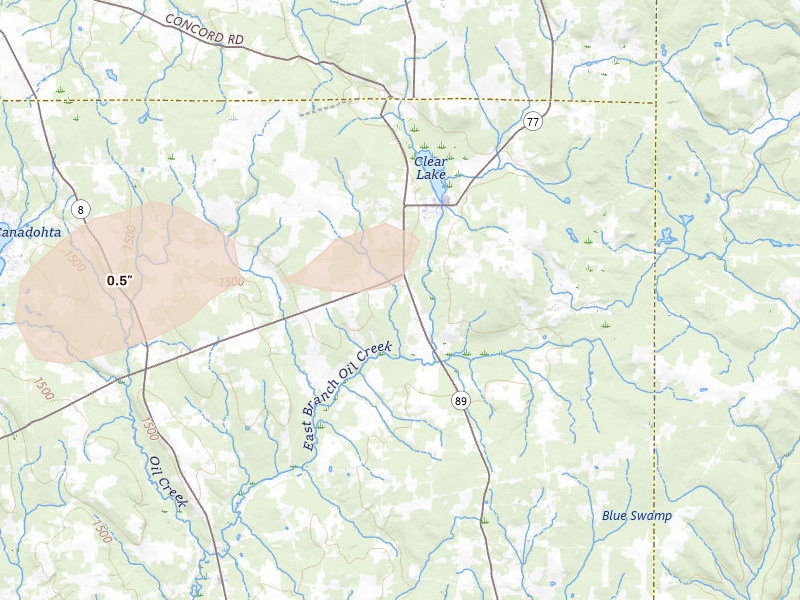
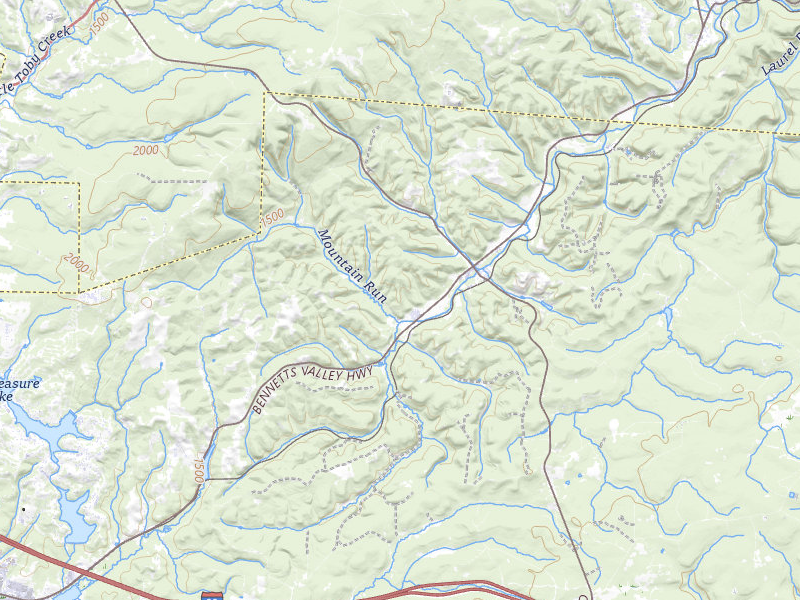
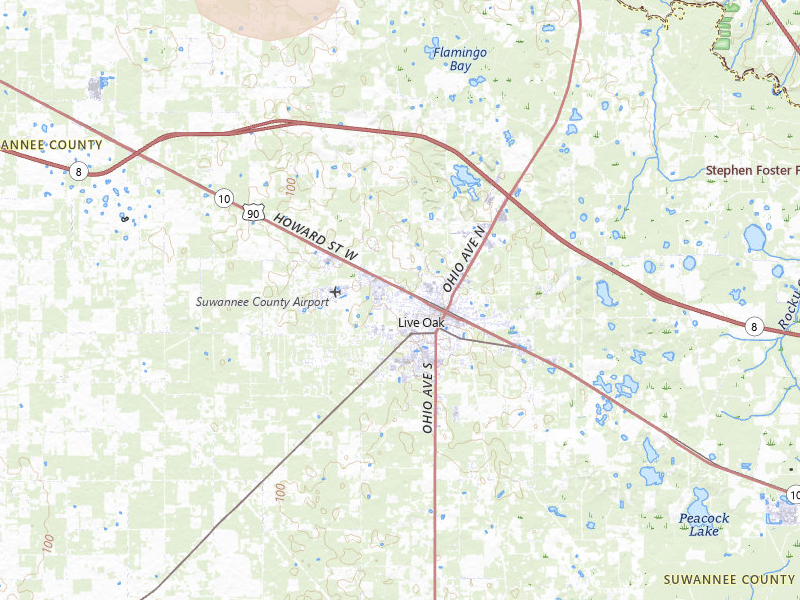
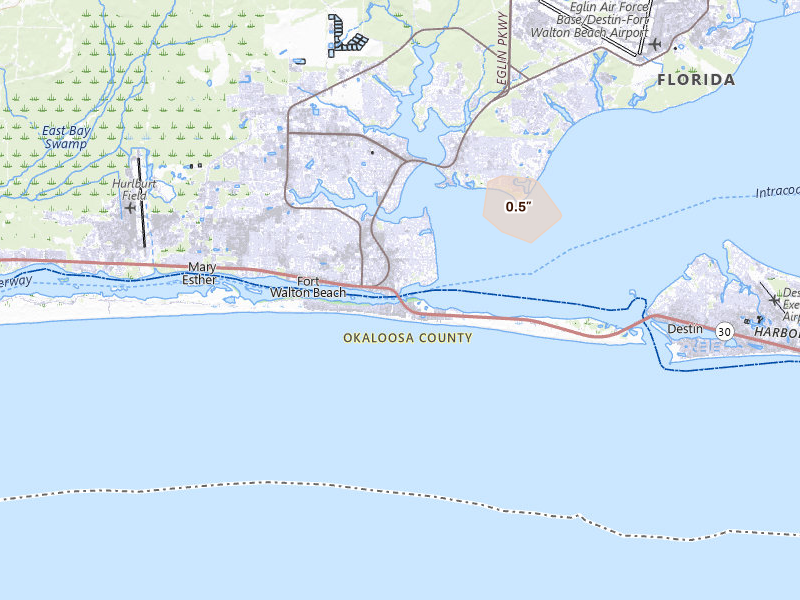
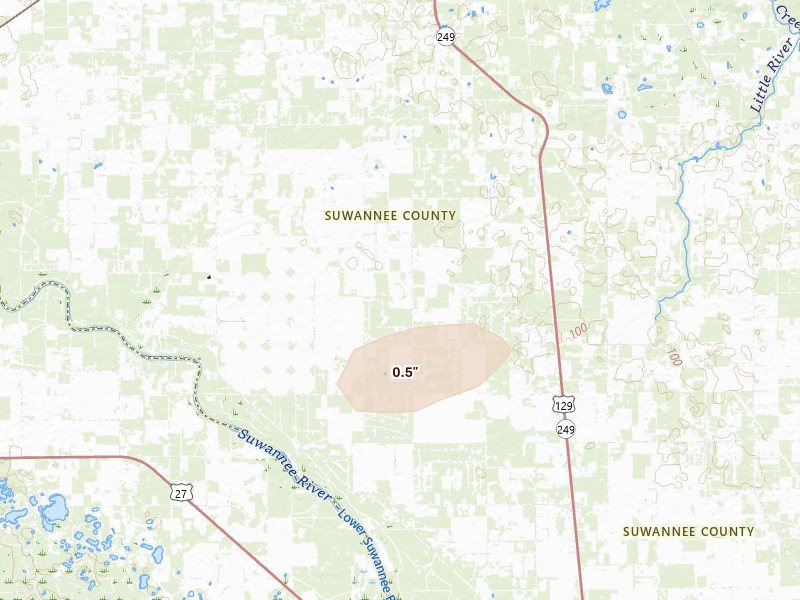
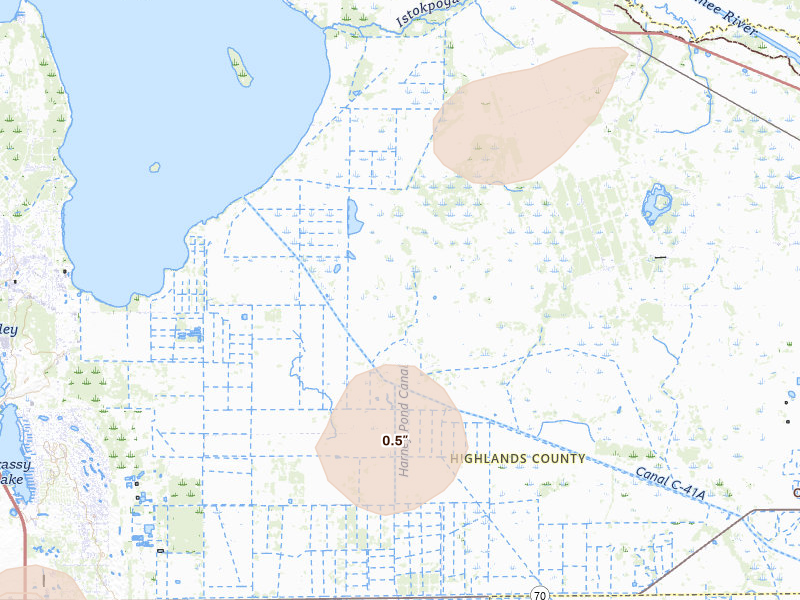
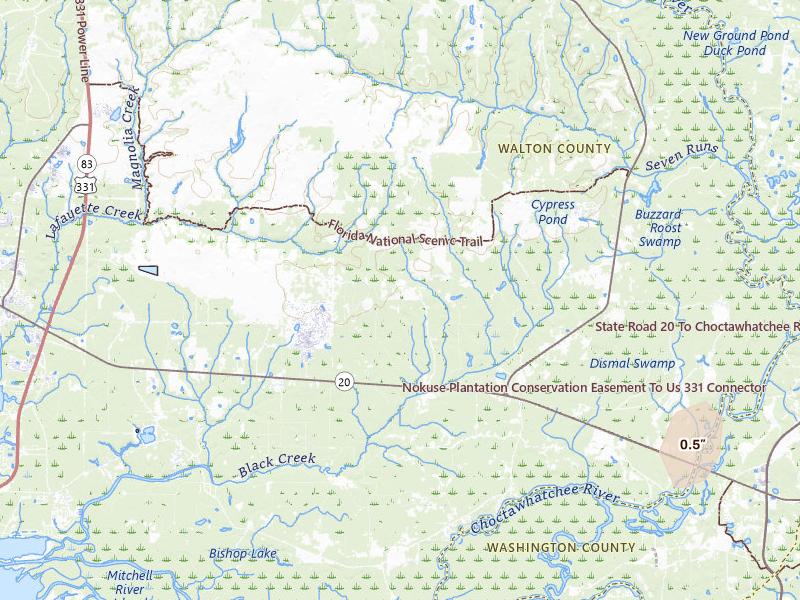
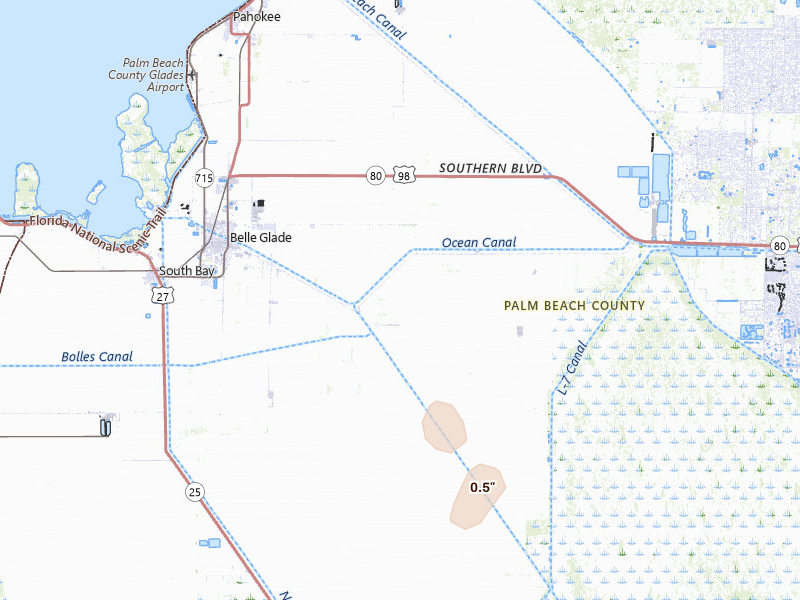
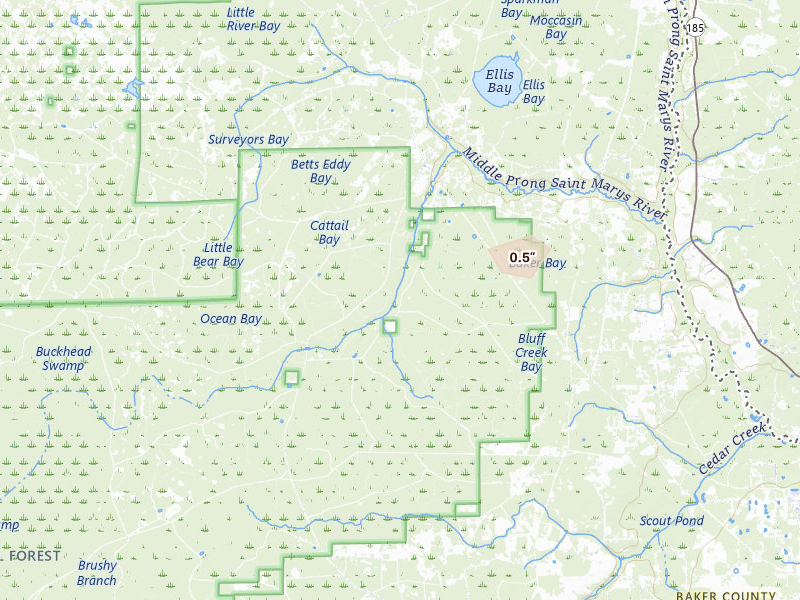
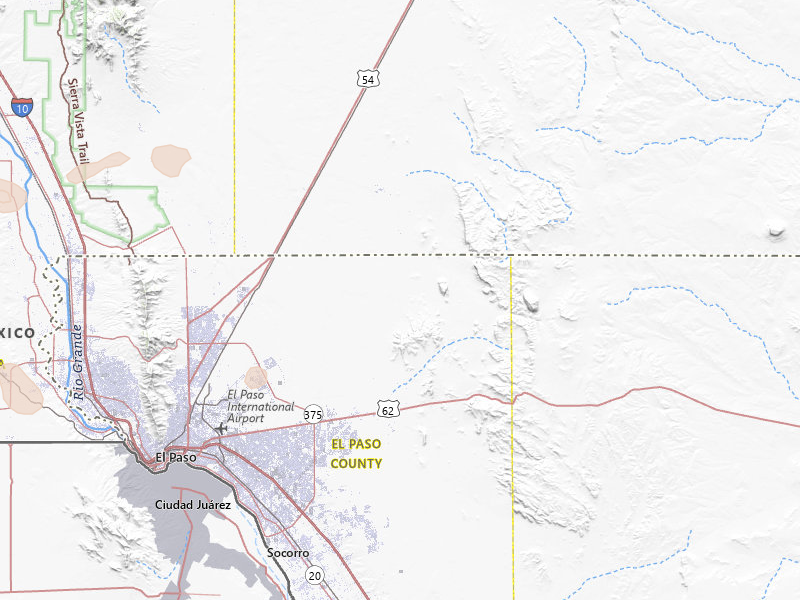
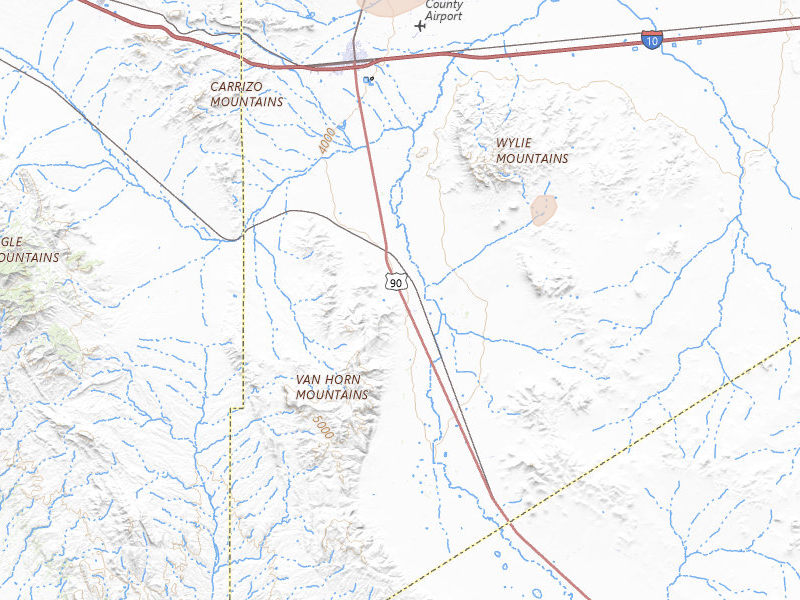
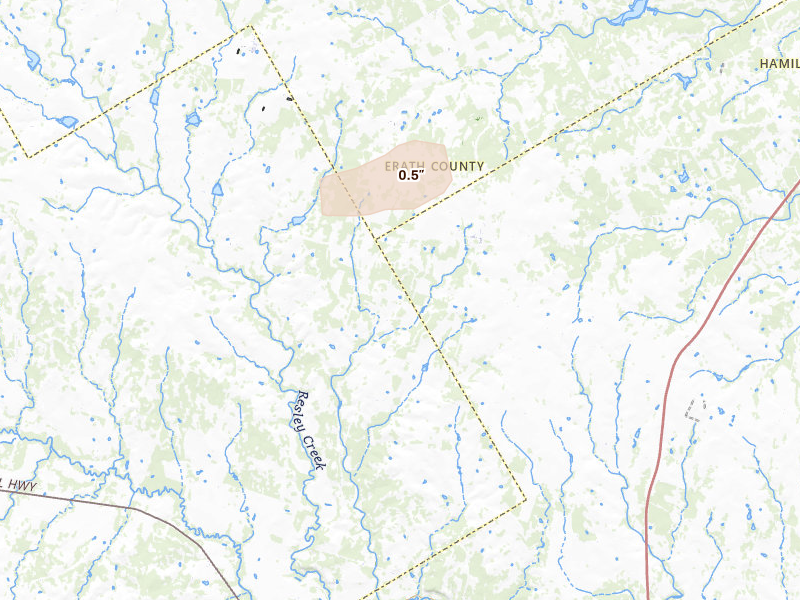
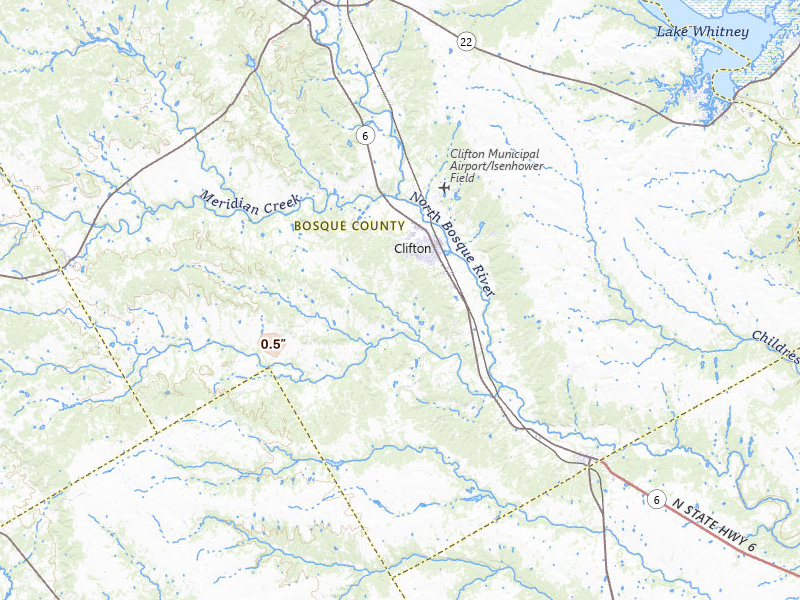
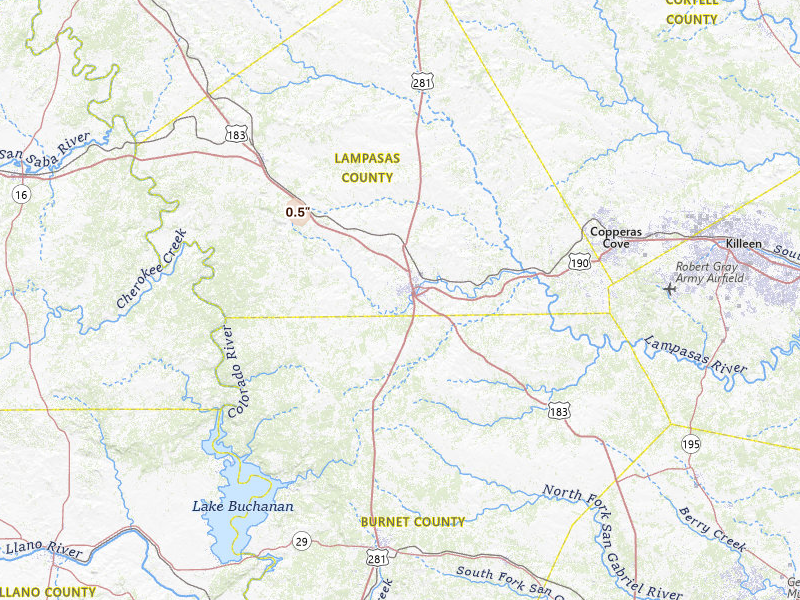
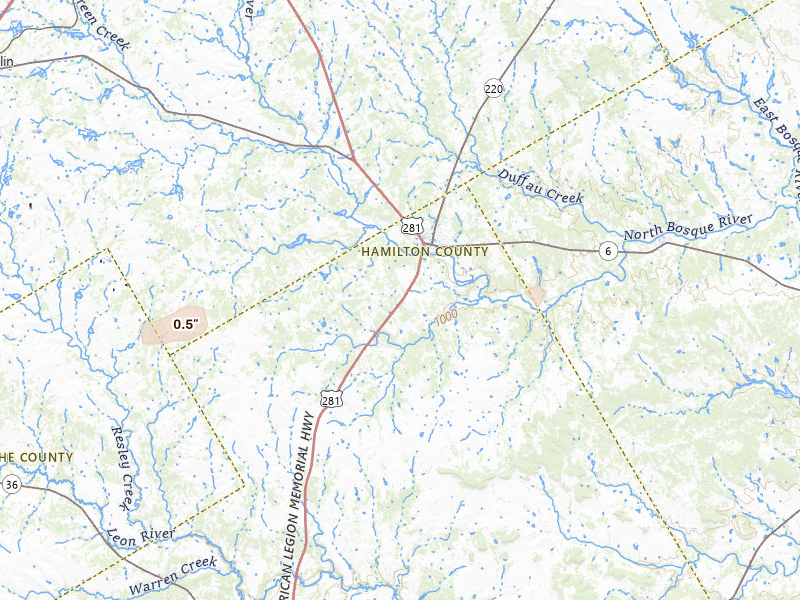
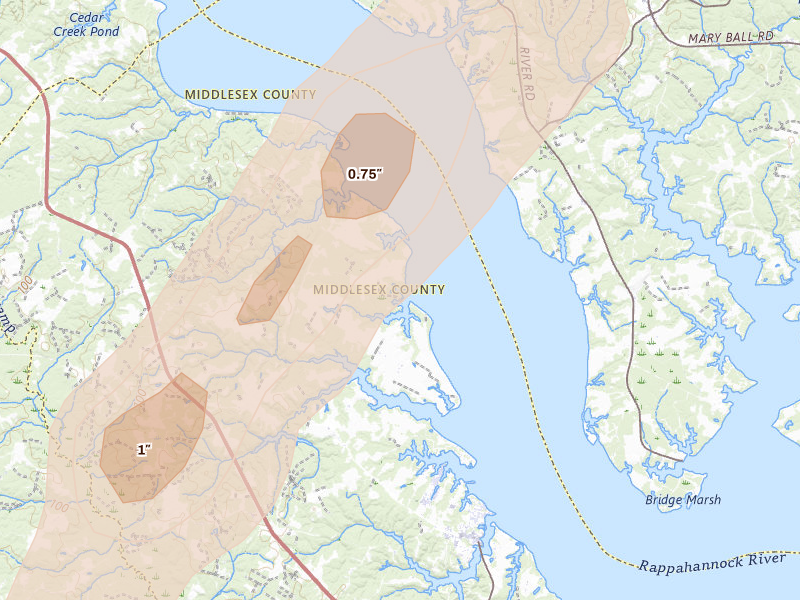
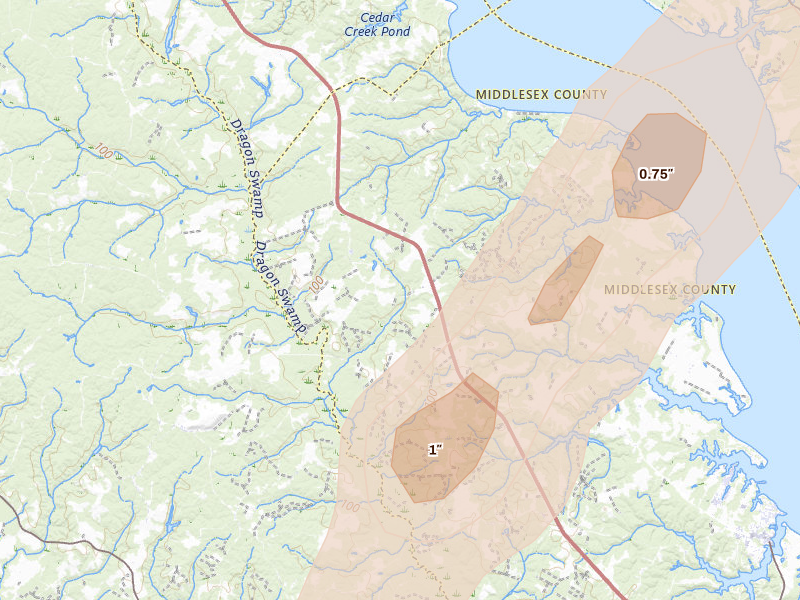
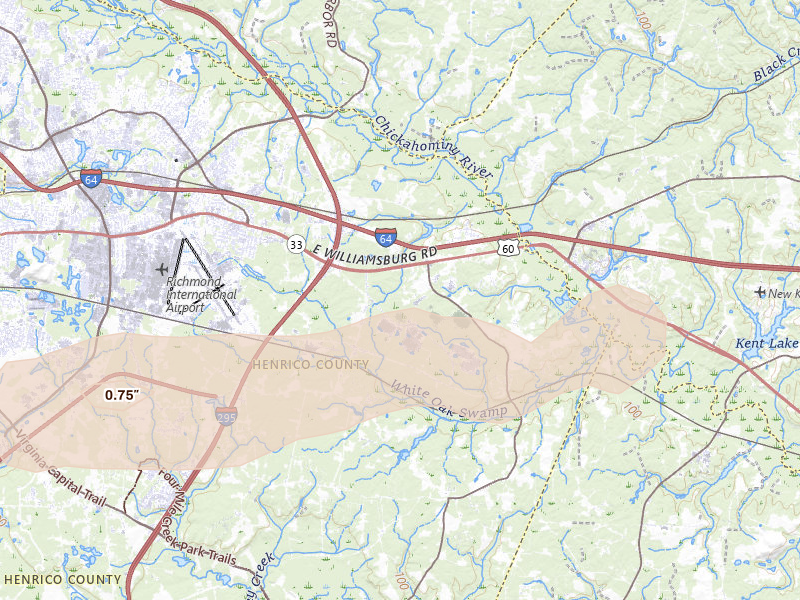
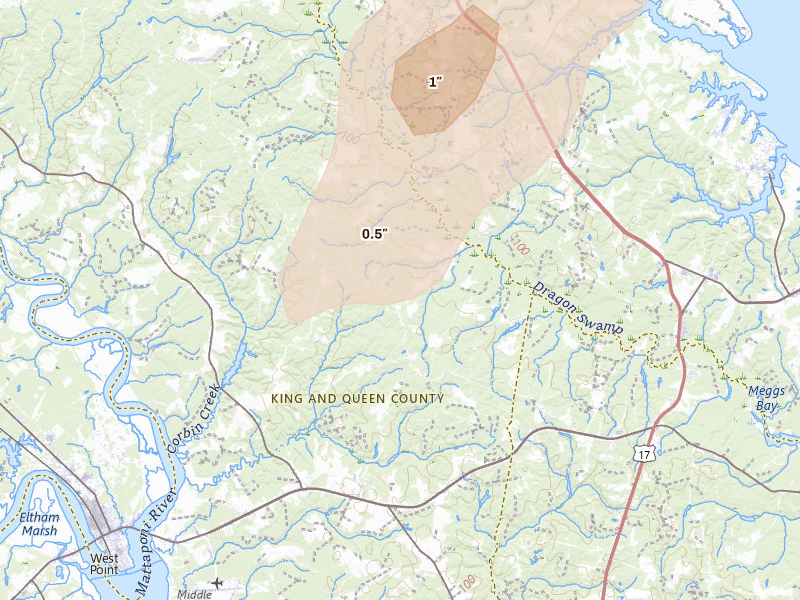
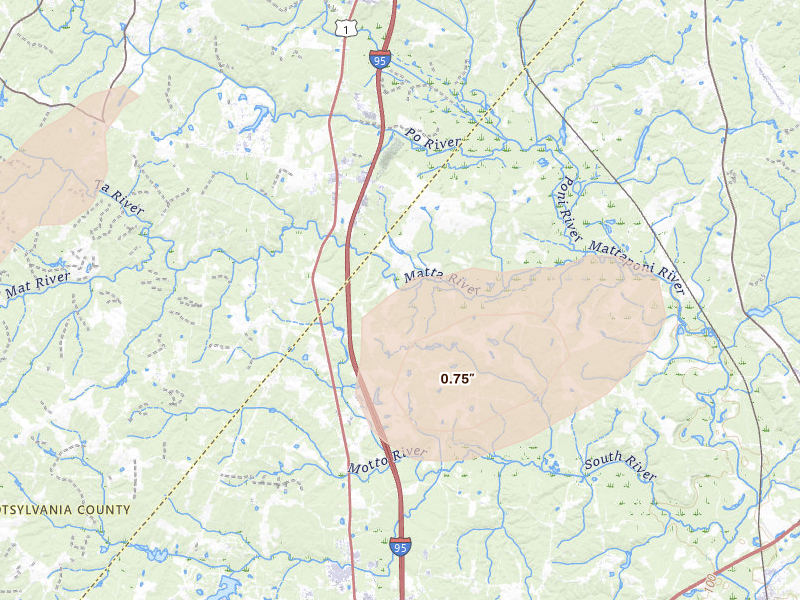
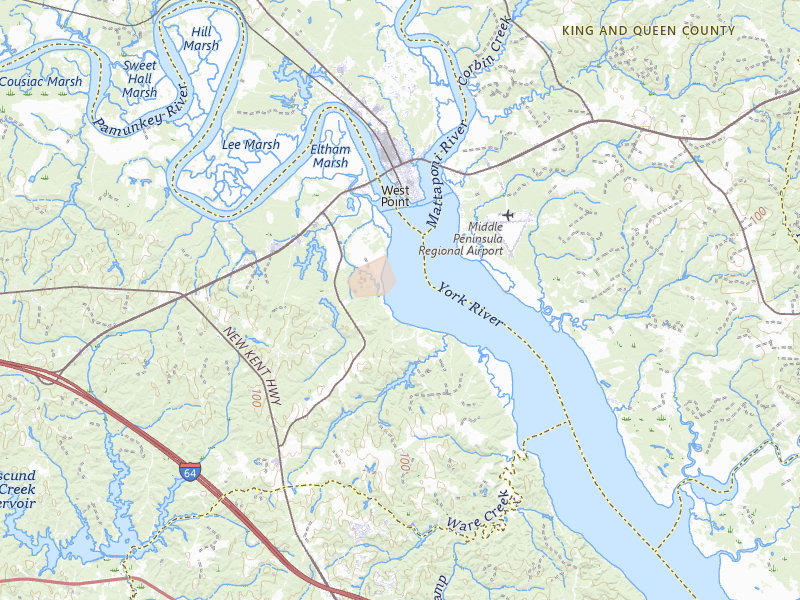
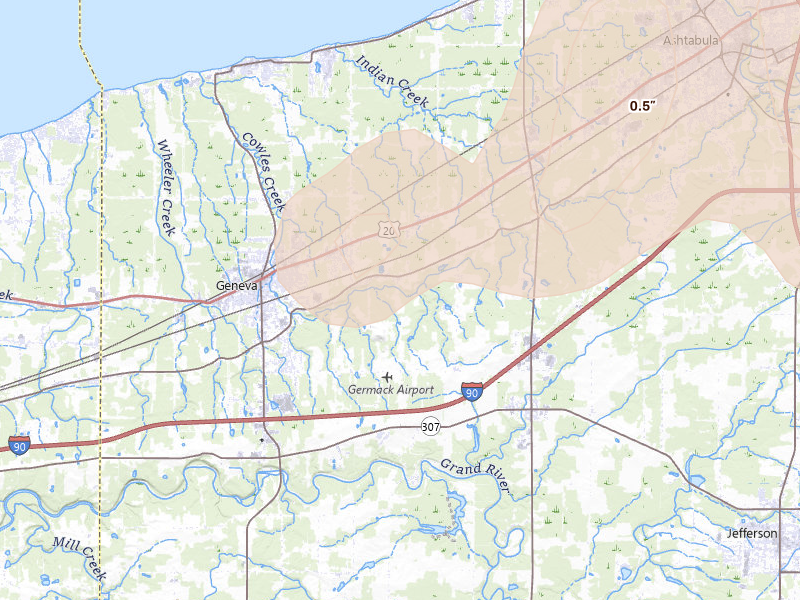
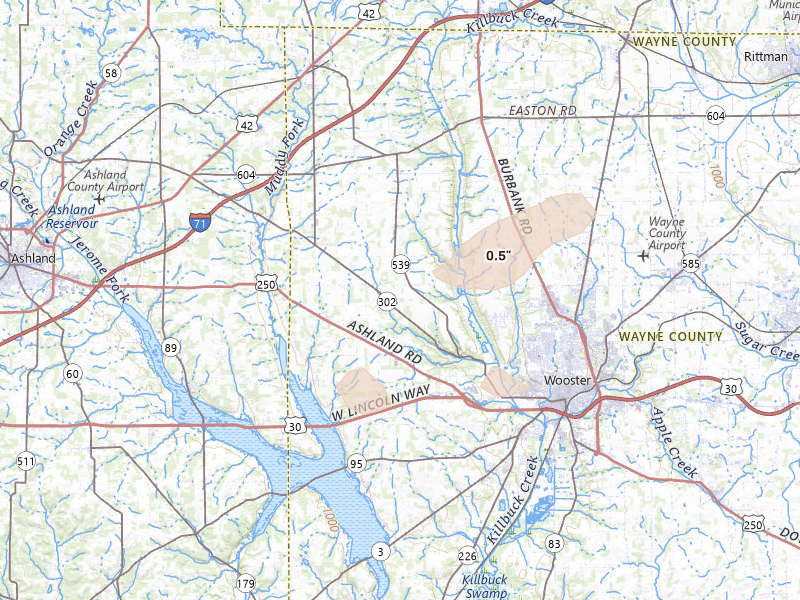
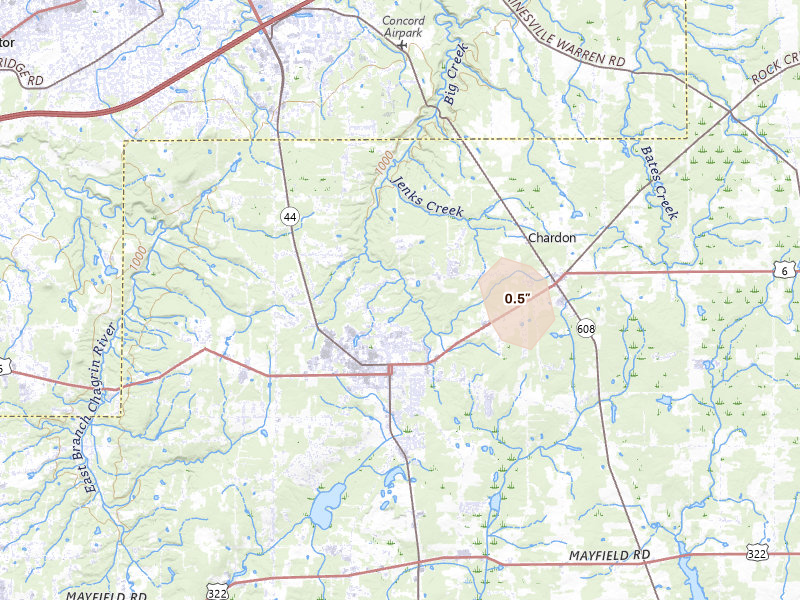
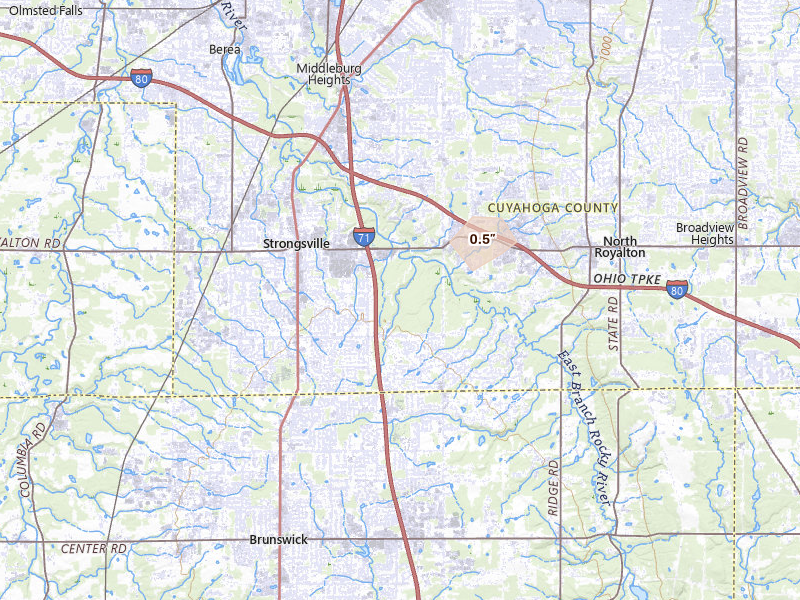
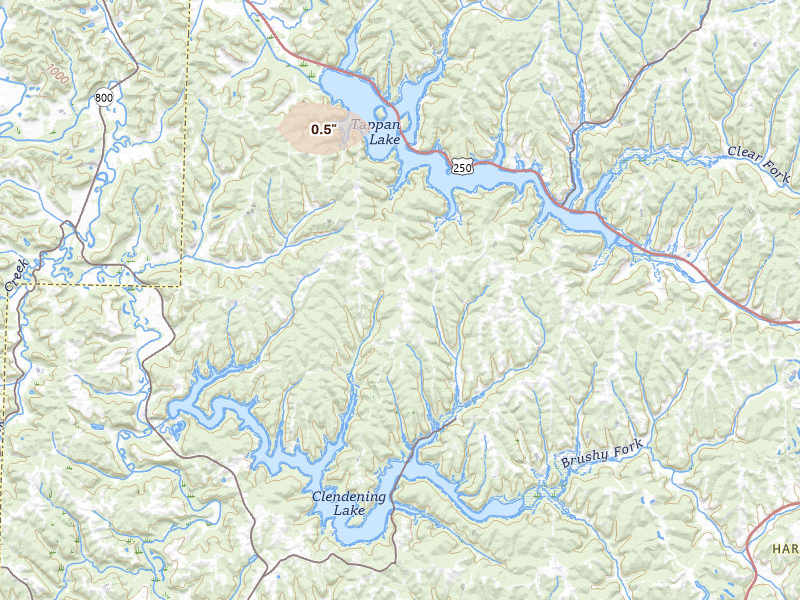
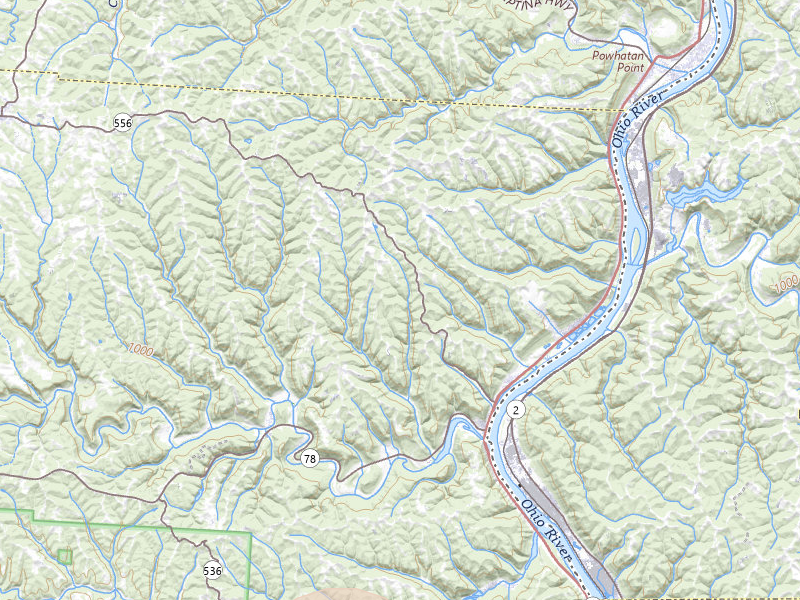
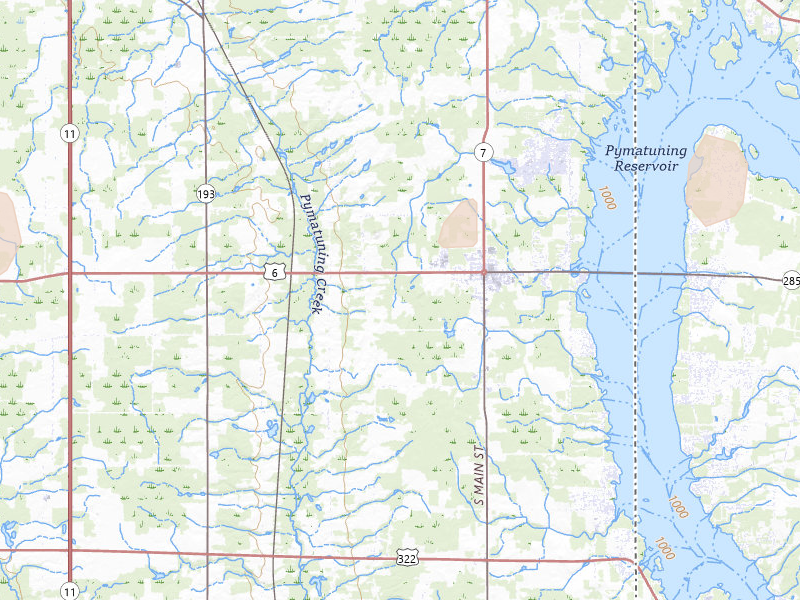
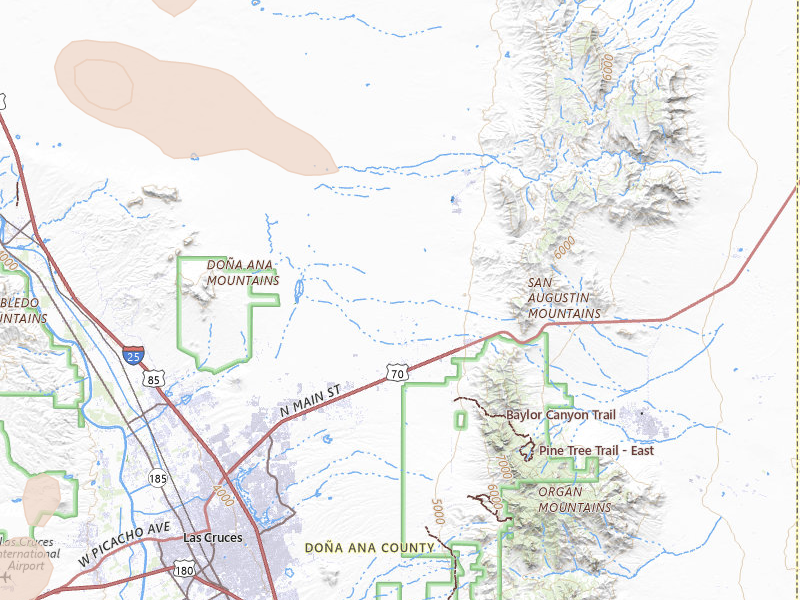
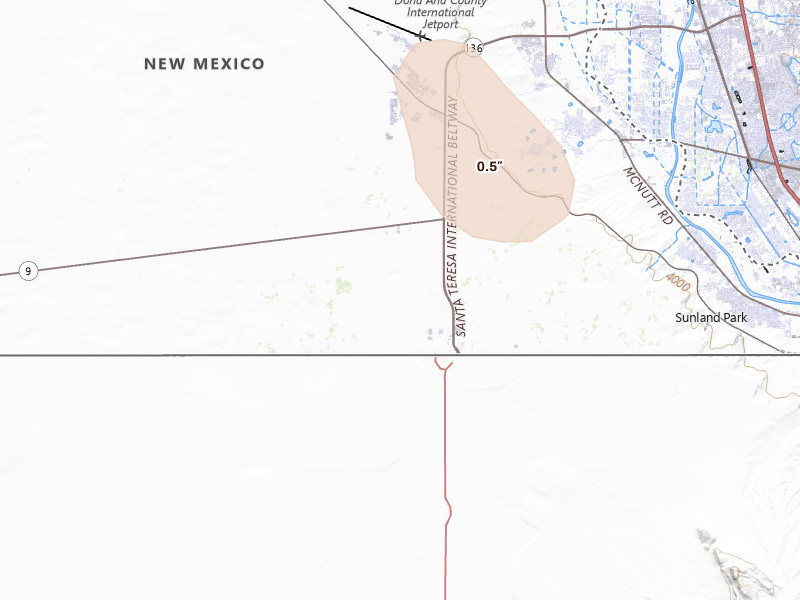
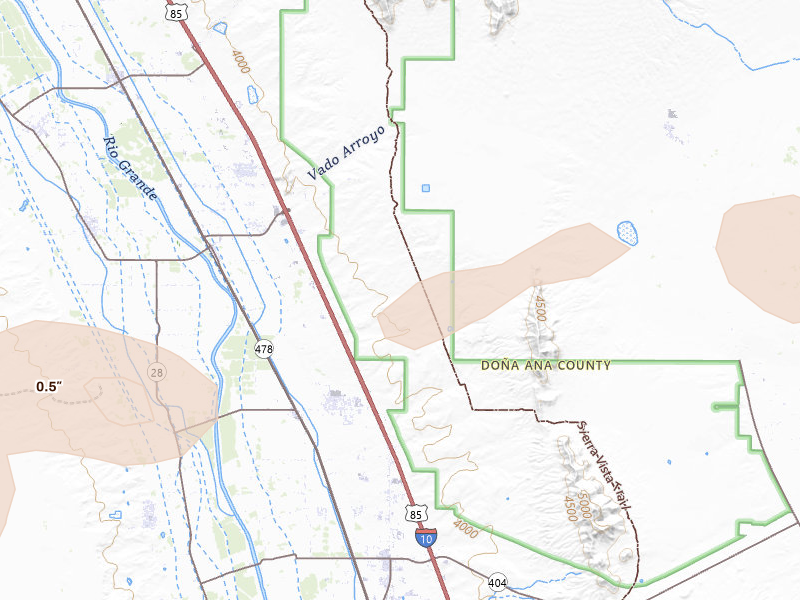
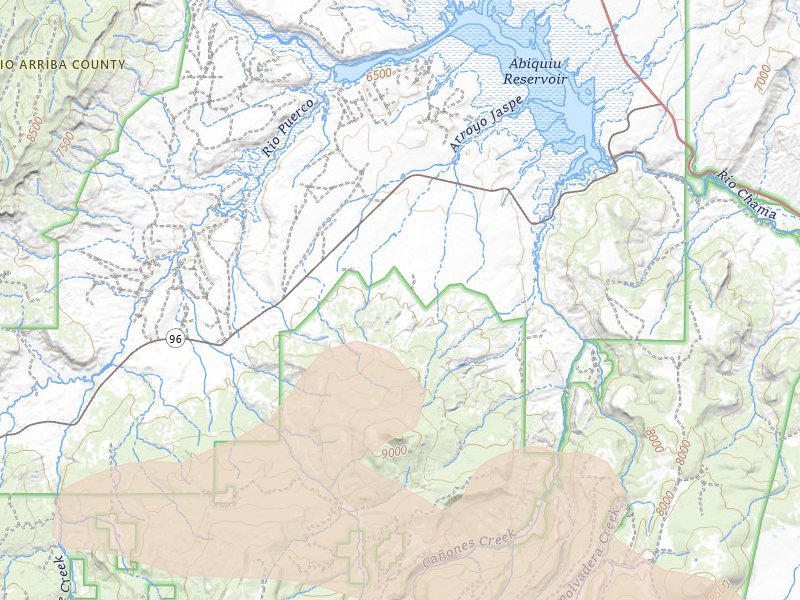
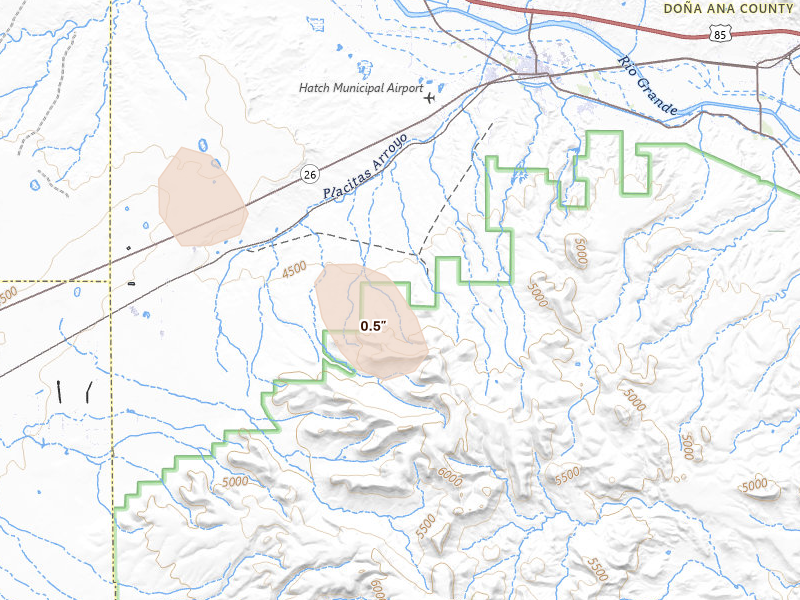
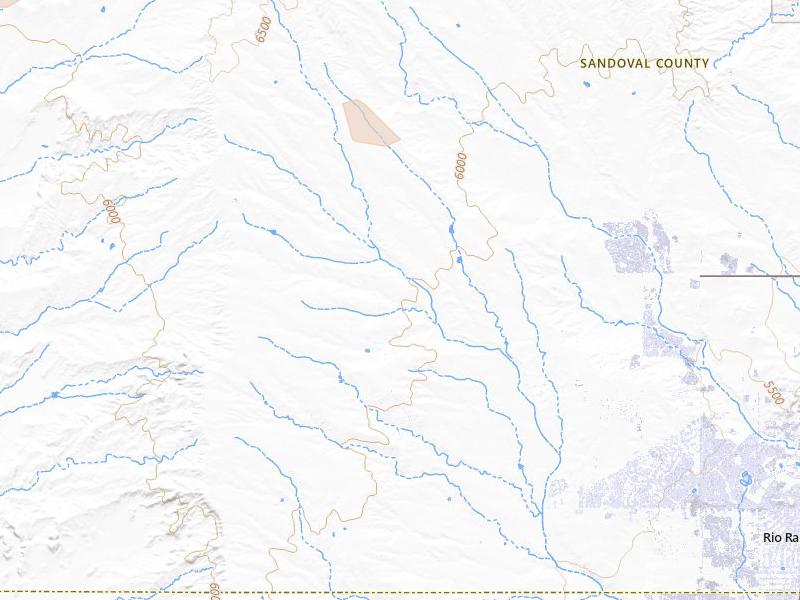
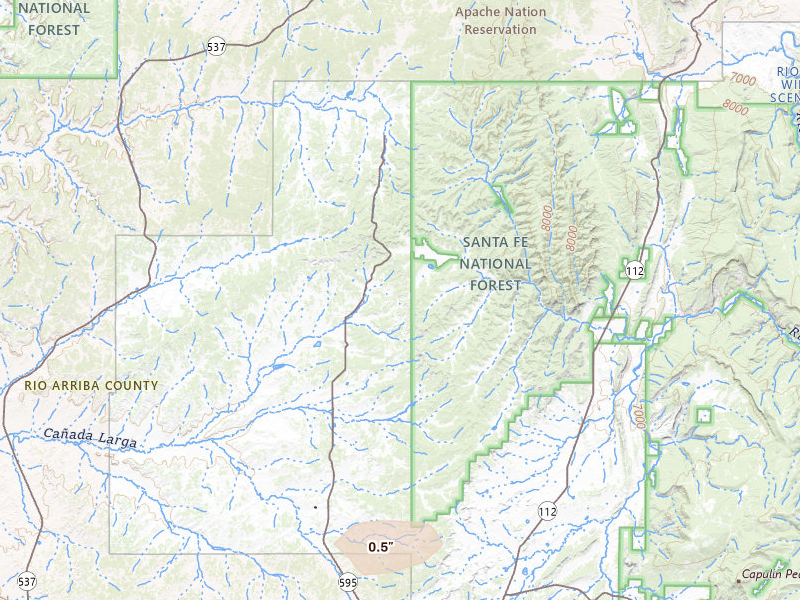
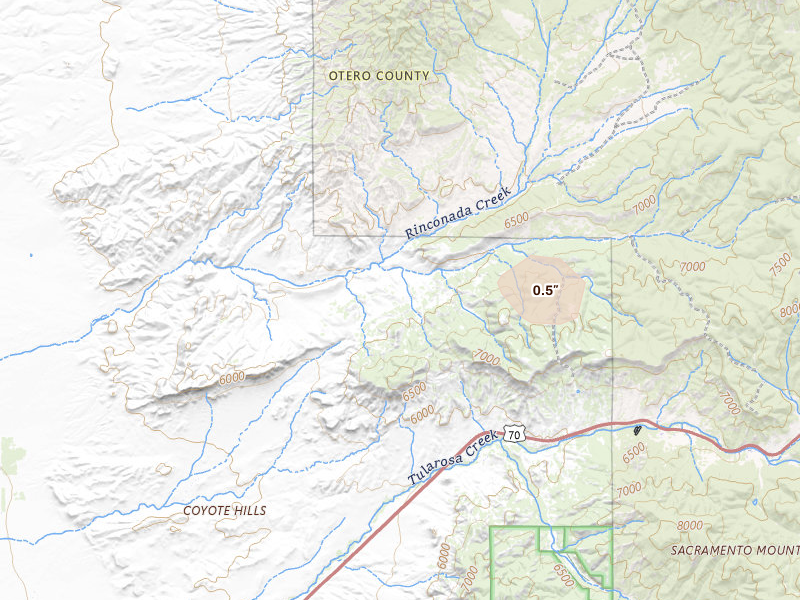
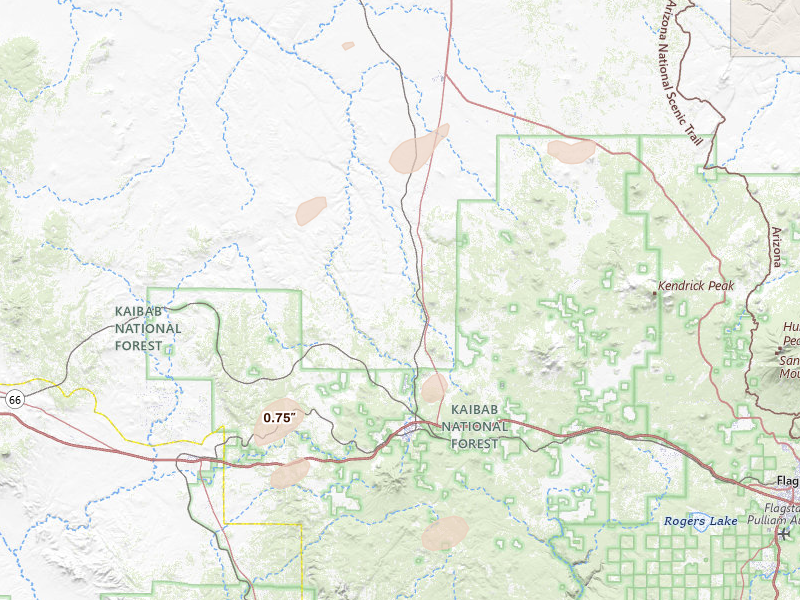
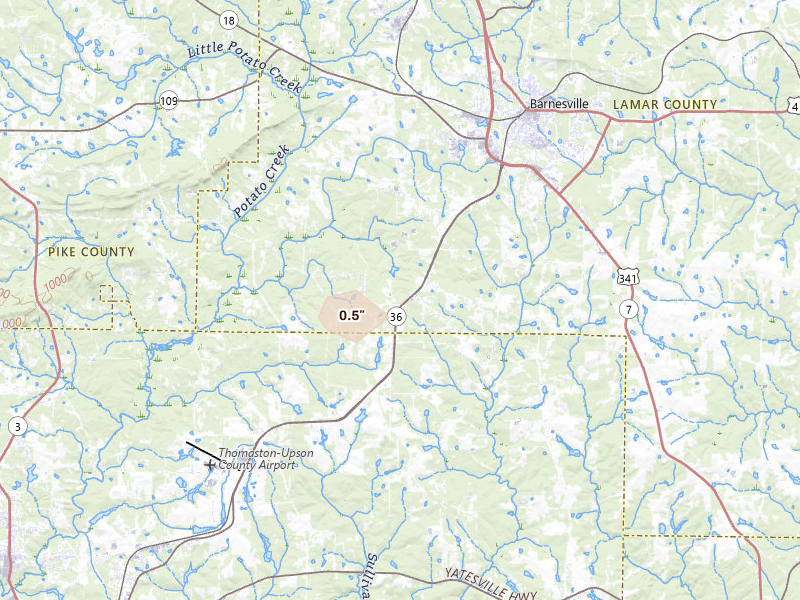
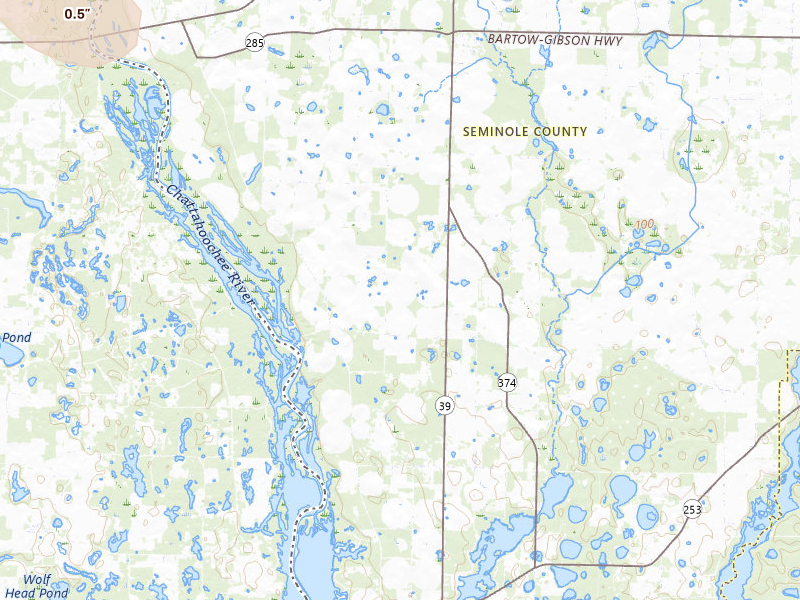
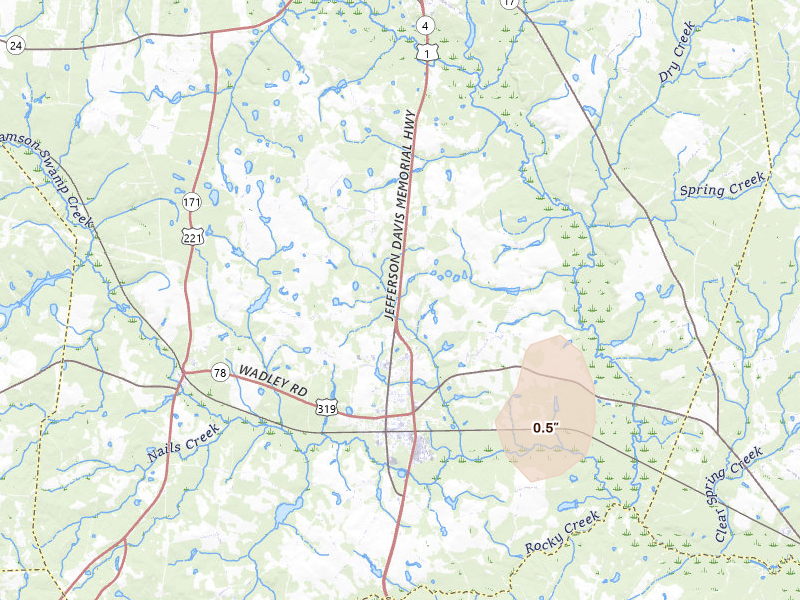
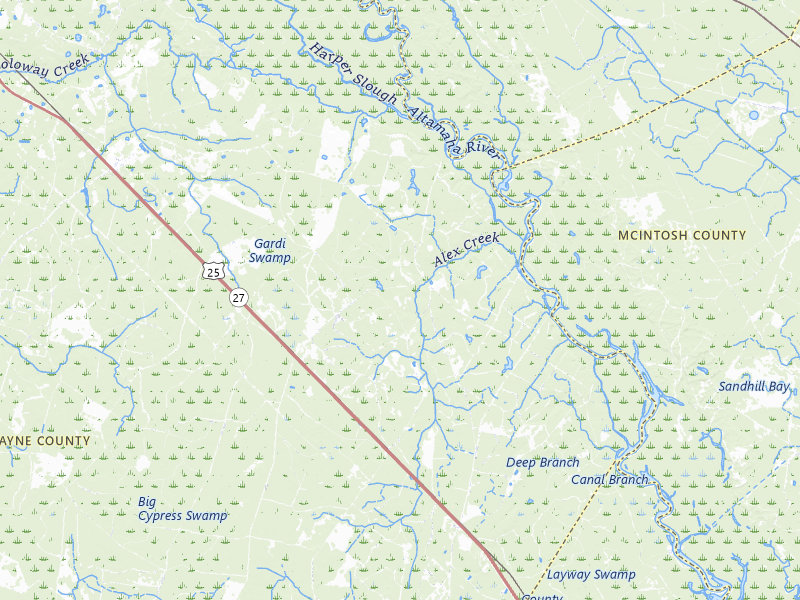
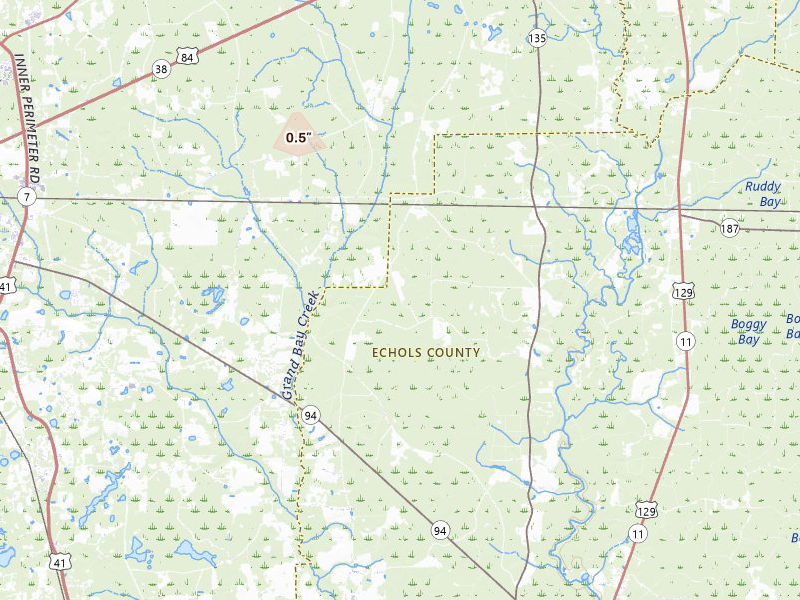
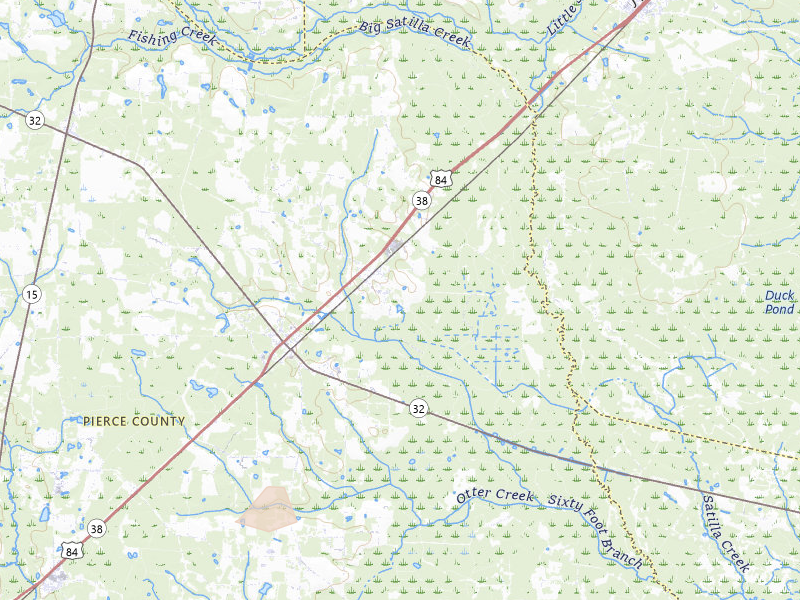
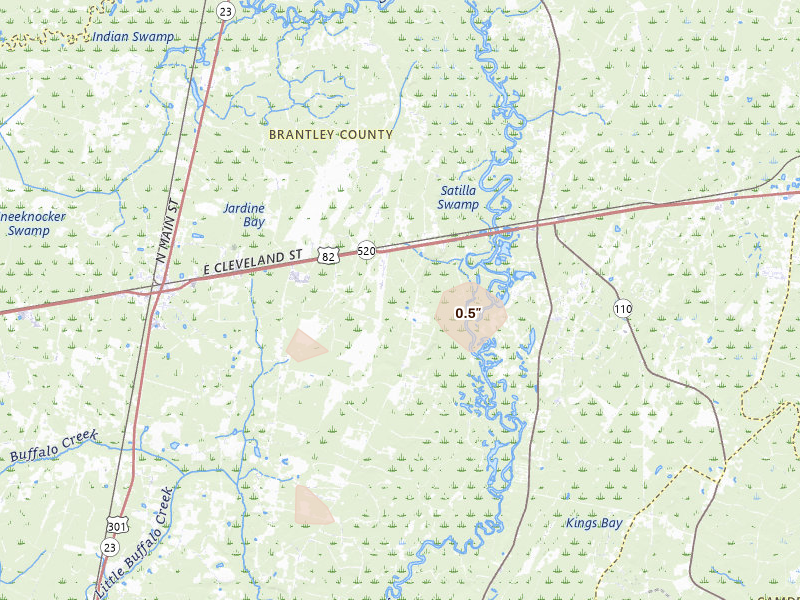
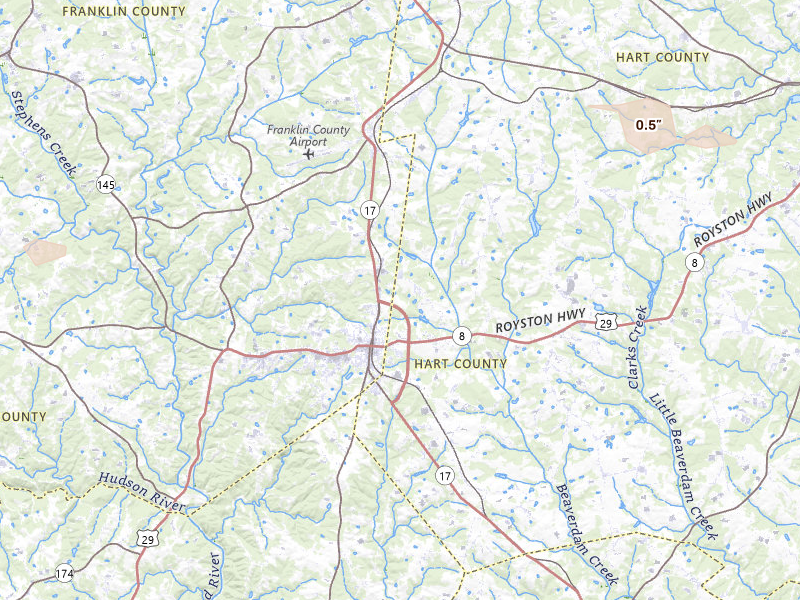
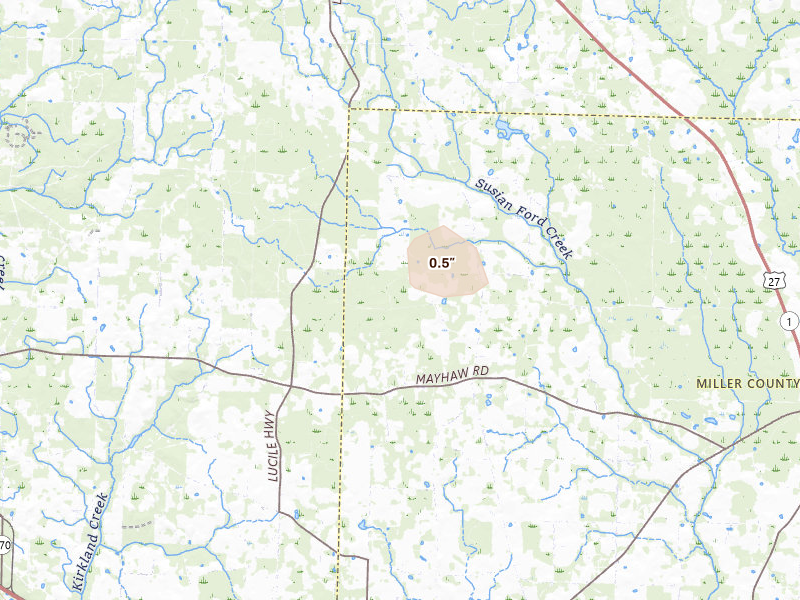
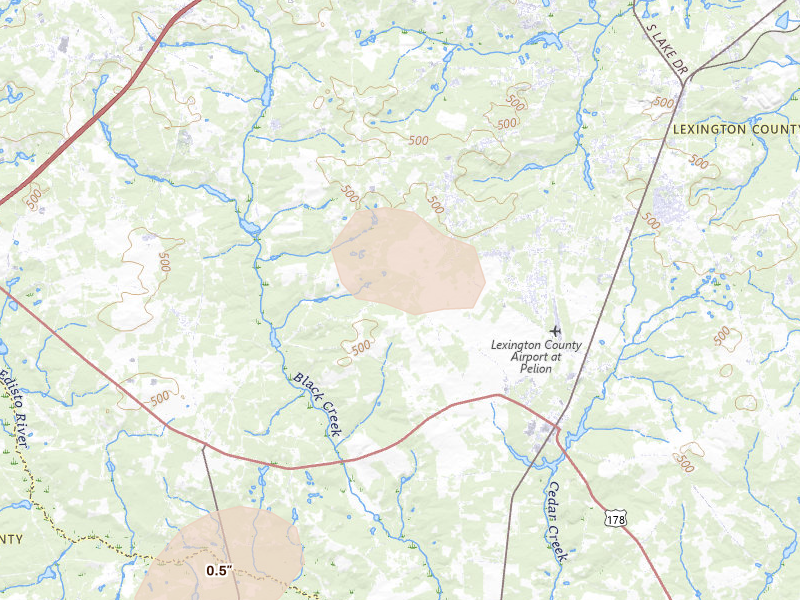
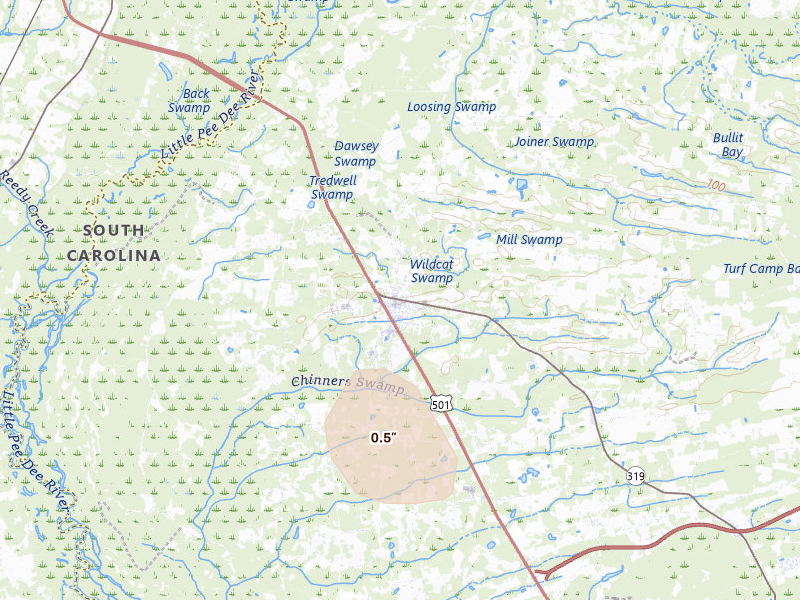
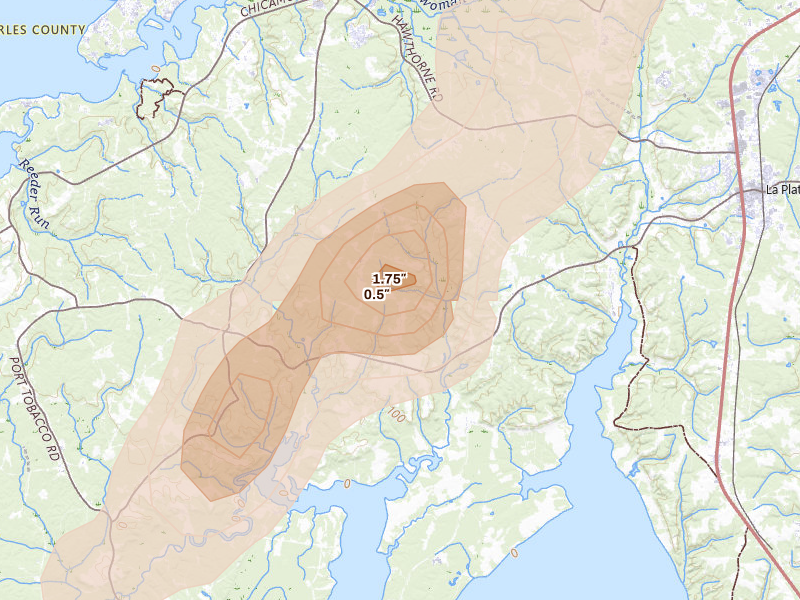
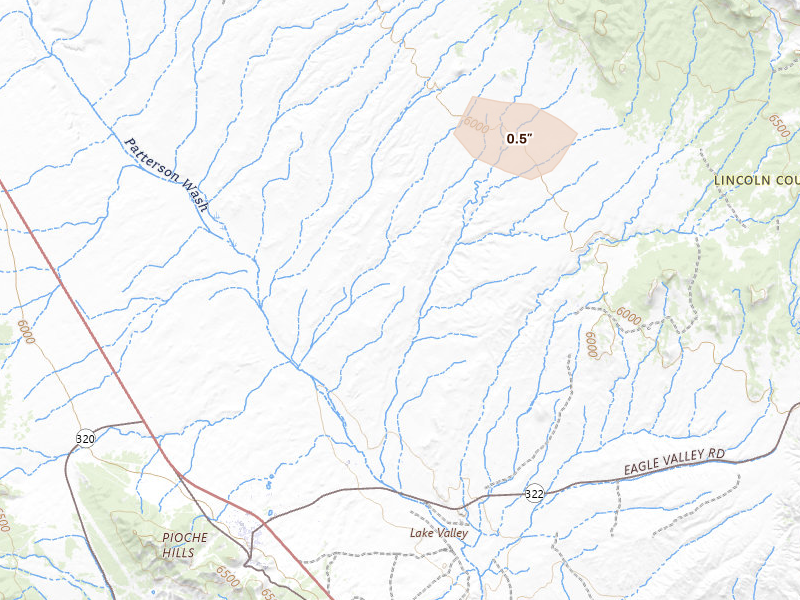
Jun 14, 2026 · Welcome, MD: 1.75" peak radar signal · Radar-estimated size map

Mapped cities, by state

Every tracked city with a hail signal on Jun 14, 2026

145 cities · up to 1.75" · 138,149 mapped homes · noon-to-noon UTC

Every tracked city that recorded hail on this convective day, biggest signal first. Each row opens that city's full storm record.

How to read this day

A storm day on Overview is a convective day — it runs from noon to noon UTC, so late-night hail is grouped with the afternoon storm that spawned it rather than split across two calendar dates. Everything below happened inside the Jun 14, 2026 convective day. Across those footprints sit roughly 138,149 homes, and 21 ground reports were filed with the National Weather Service.

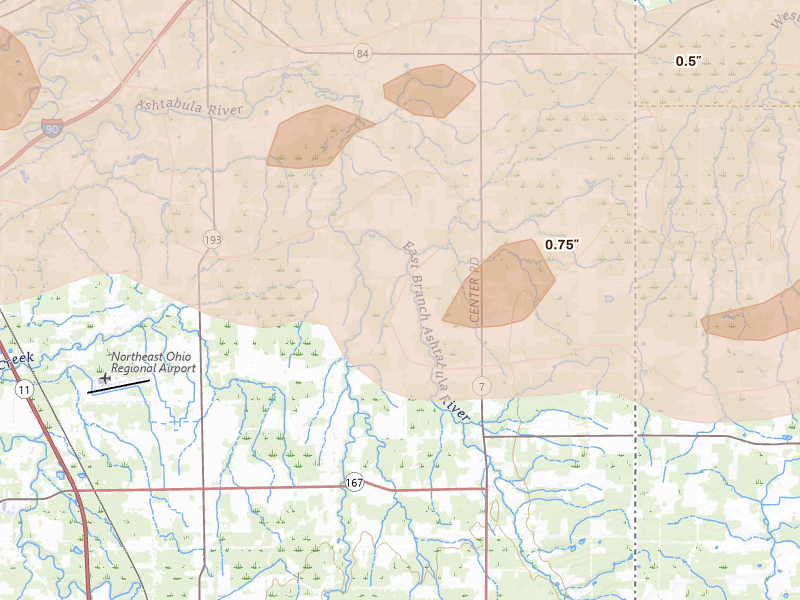
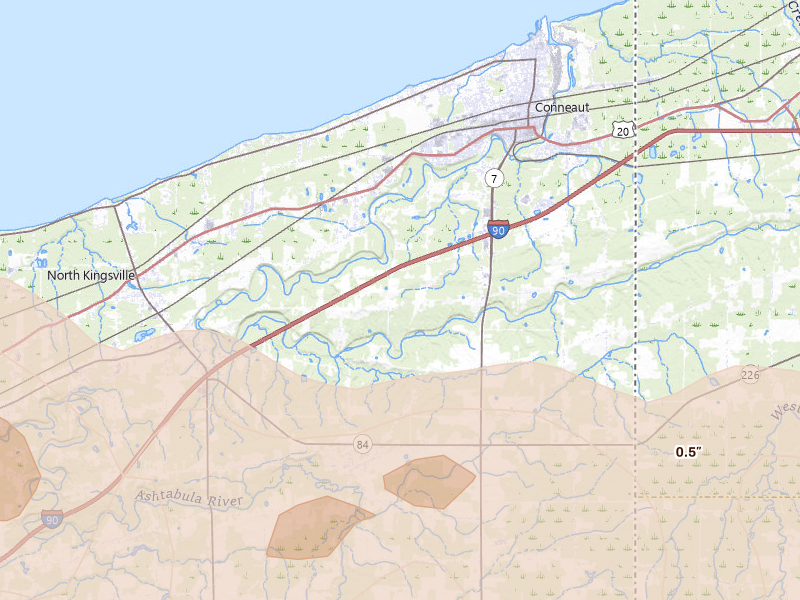
The cities are listed with the biggest storm first, measured by Overview's severity score. Each row links through to that city's own storm page, where you'll find the radar surfaces, every ground report filed, and the hail footprint drawn on the map.

The counts here are the size of the set of cities Overview tracks — never "every US city" — so read a quiet day as "quiet among the places we watch," not as proof nothing happened elsewhere.

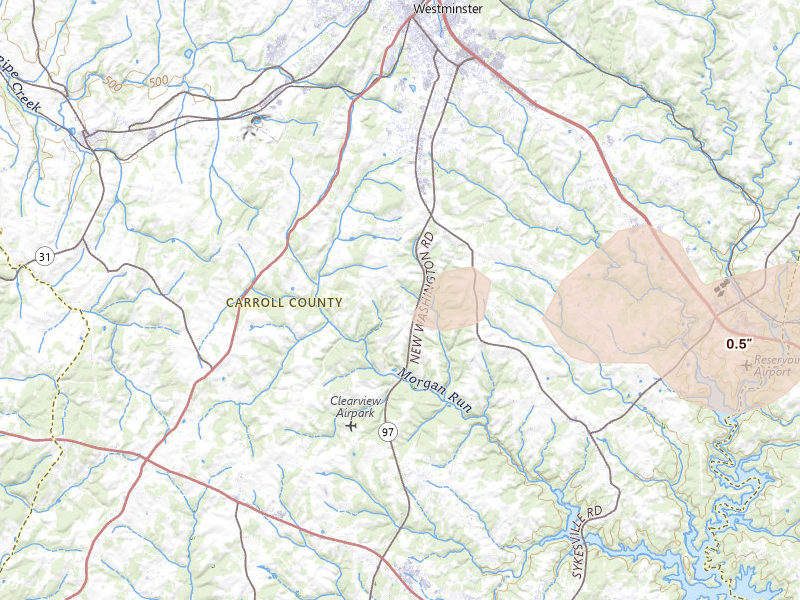
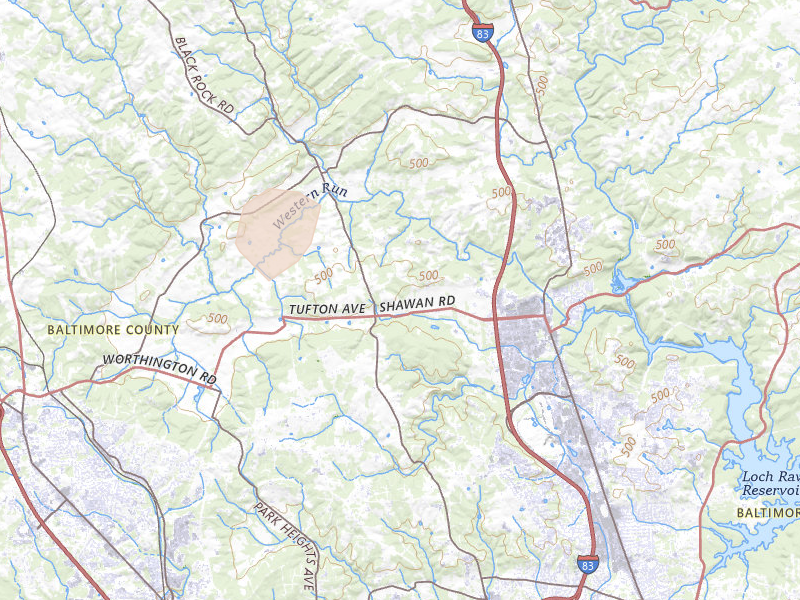
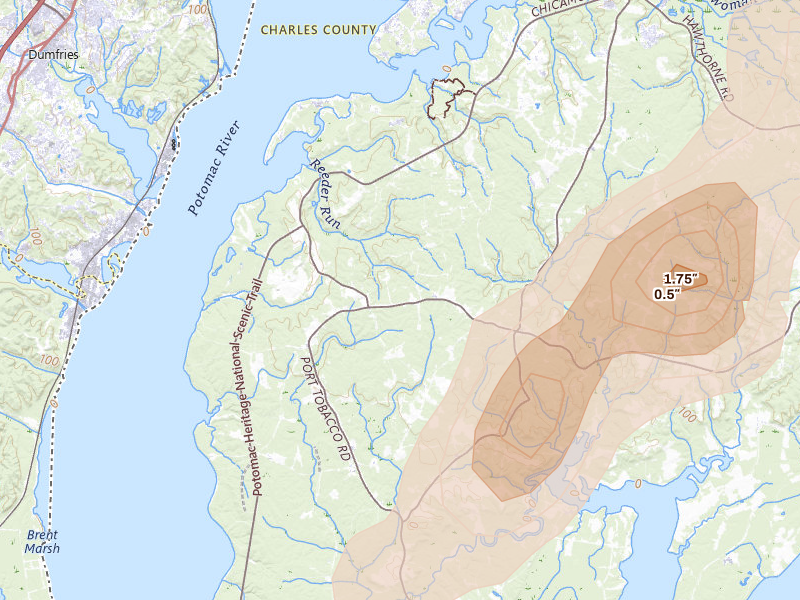
Maryland

8 cities · up to 1.75" · 7,690 mapped homes
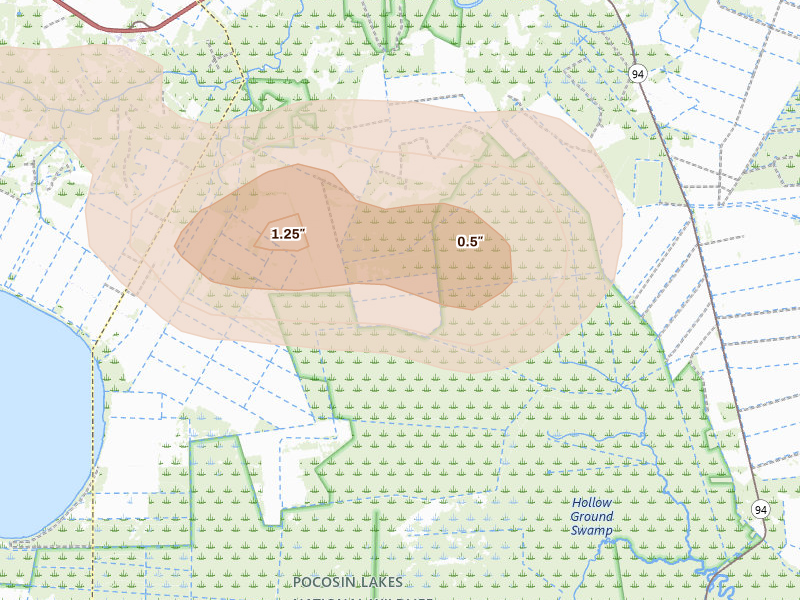
North Carolina

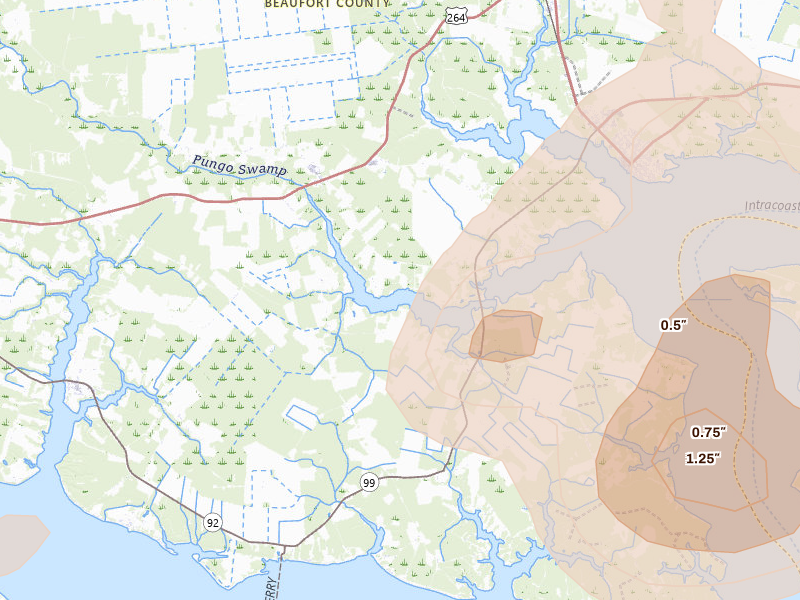
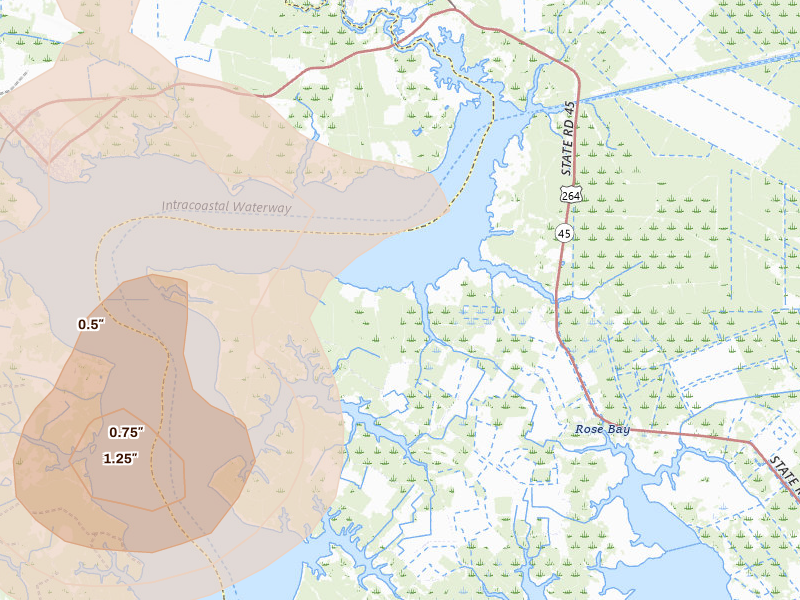
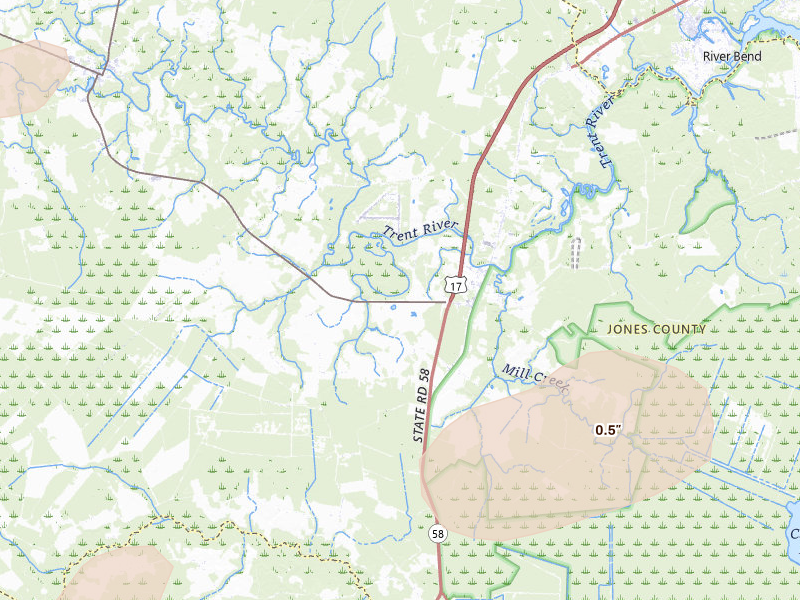
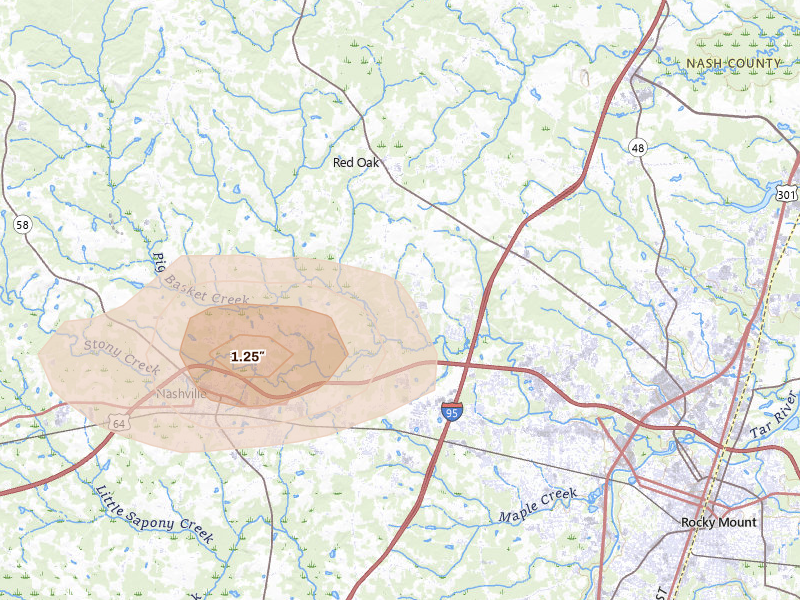
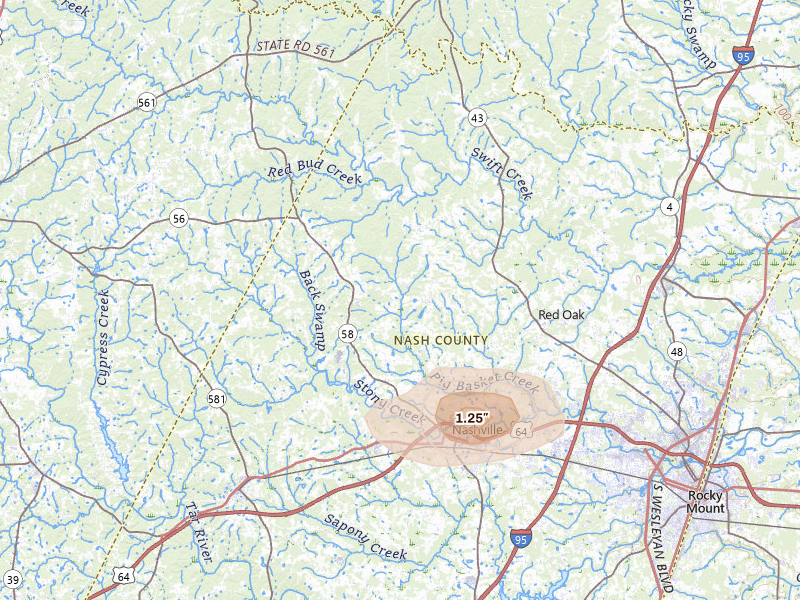
21 cities · up to 1.25" · 24,267 mapped homes
Rocky Mount, NC 4.4 /10 severity
1.25" peak signal 3,236 mapped homes 3 ground reports
Nashville, NC 3.6 /10 severity
1.25" peak signal 3,022 mapped homes No ground reports
Columbia, NC 3.2 /10 severity
1.25" peak signal 146 mapped homes 1 ground report
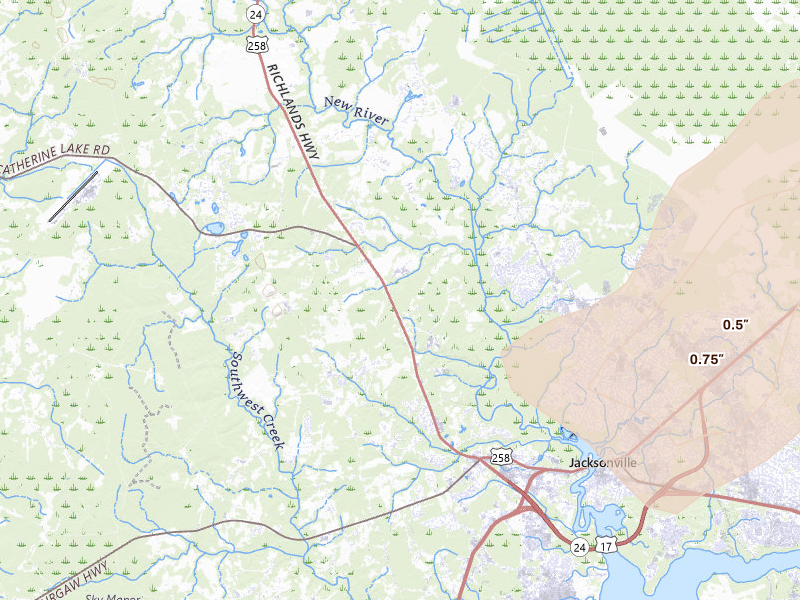
Jacksonville, NC 3.2 /10 severity
0.75" peak signal 12,267 mapped homes No ground reports
Belhaven, NC 2.9 /10 severity
1" peak signal 758 mapped homes No ground reports
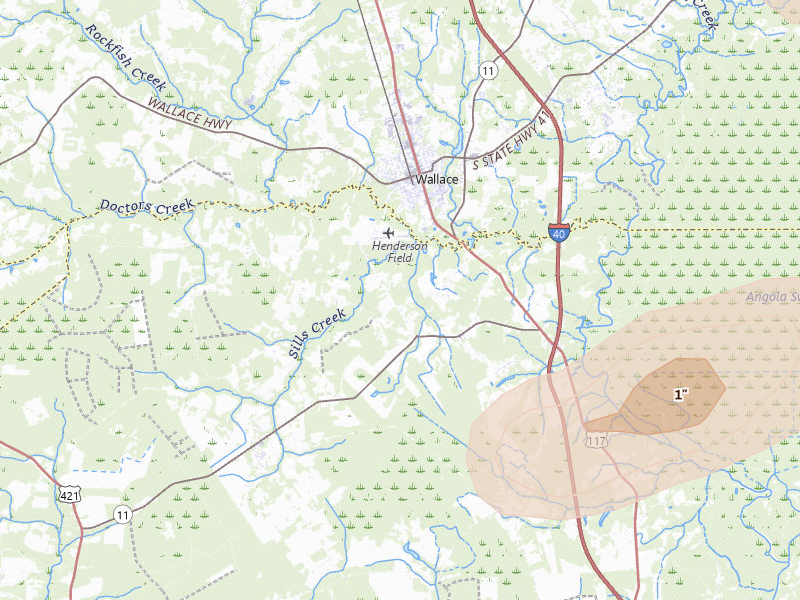
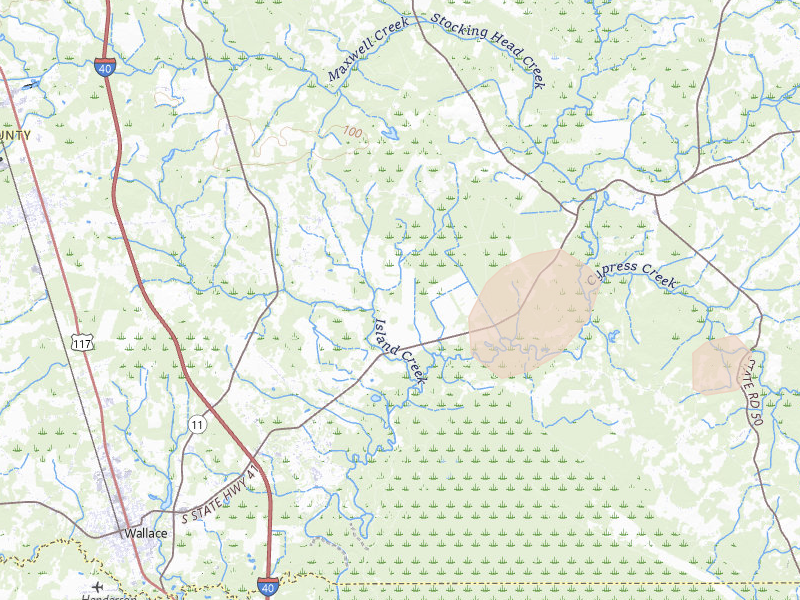
Wallace, NC 2.9 /10 severity
1" peak signal 662 mapped homes No ground reports
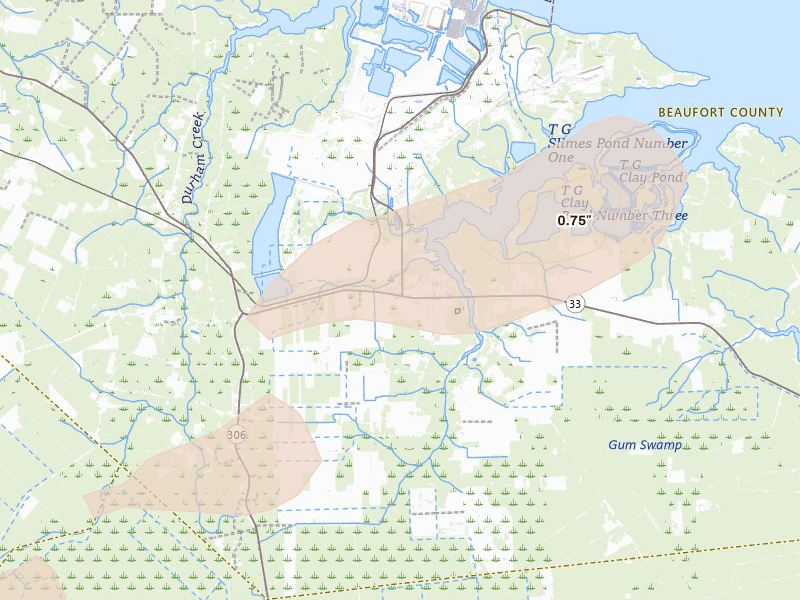
Aurora, NC 2.5 /10 severity
0.75" peak signal 690 mapped homes No ground reports
Scranton, NC 2.5 /10 severity
1" peak signal 122 mapped homes No ground reports
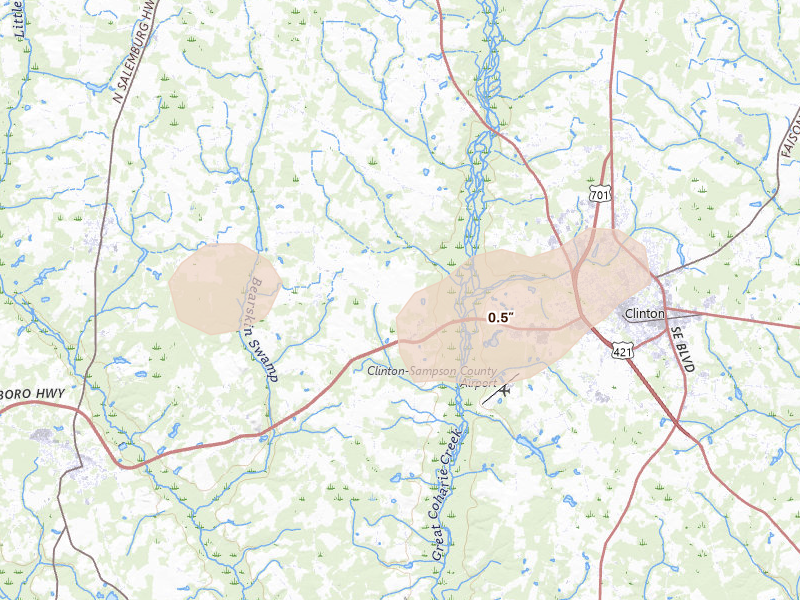
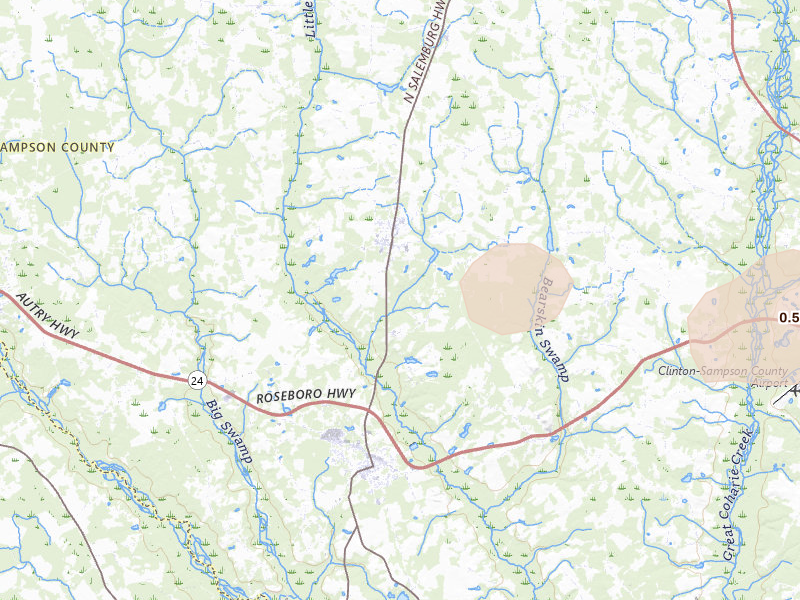
Clinton, NC 2.3 /10 severity
0.5" peak signal 1,493 mapped homes No ground reports
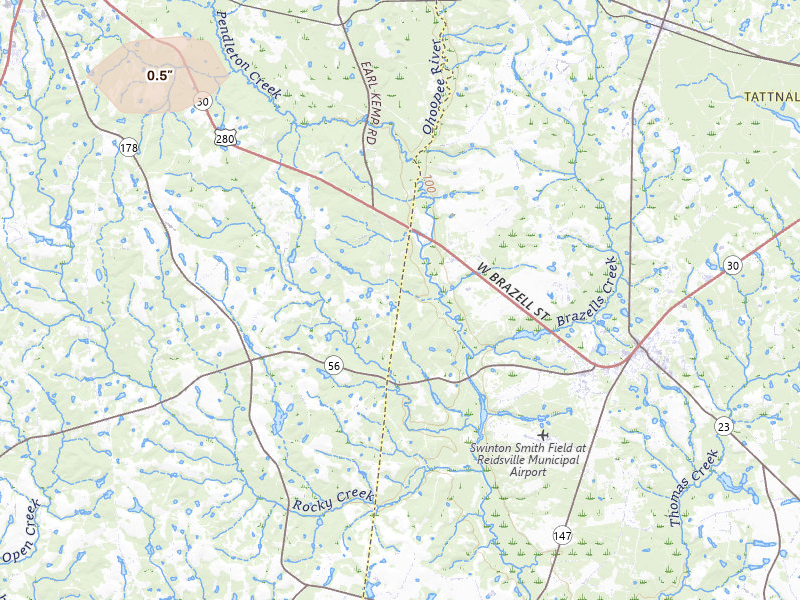
Reidsville, NC 2.1 /10 severity
0.5" peak signal 622 mapped homes No ground reports
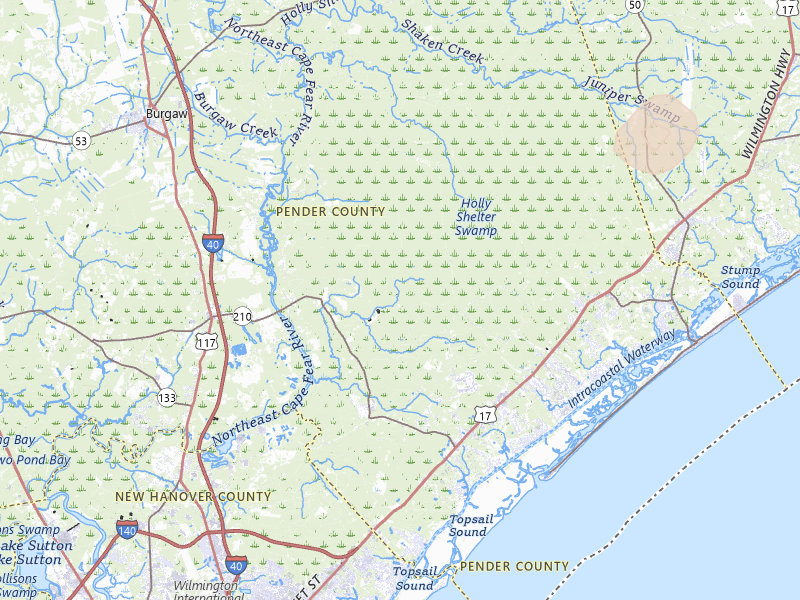
Hampstead, NC 2.0 /10 severity
0.75" peak signal 62 mapped homes No ground reports
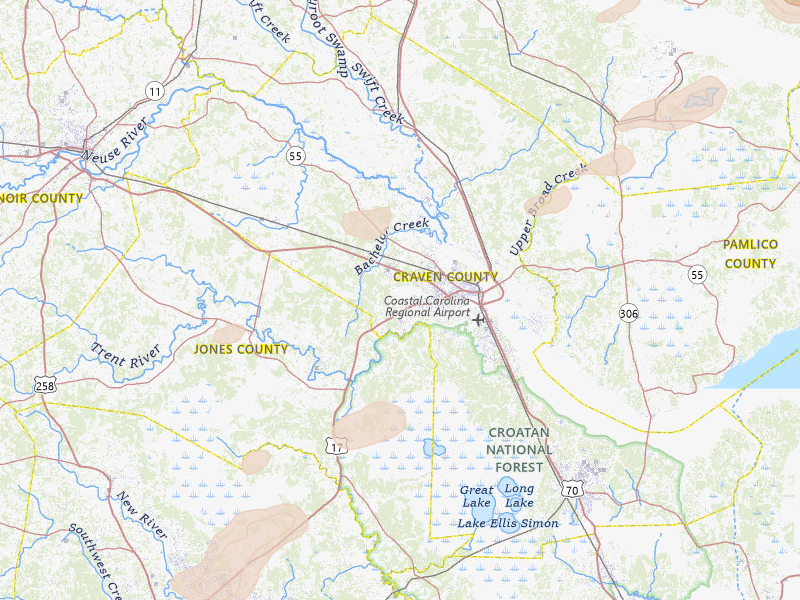
New Bern, NC 1.9 /10 severity
0.5" peak signal 189 mapped homes No ground reports
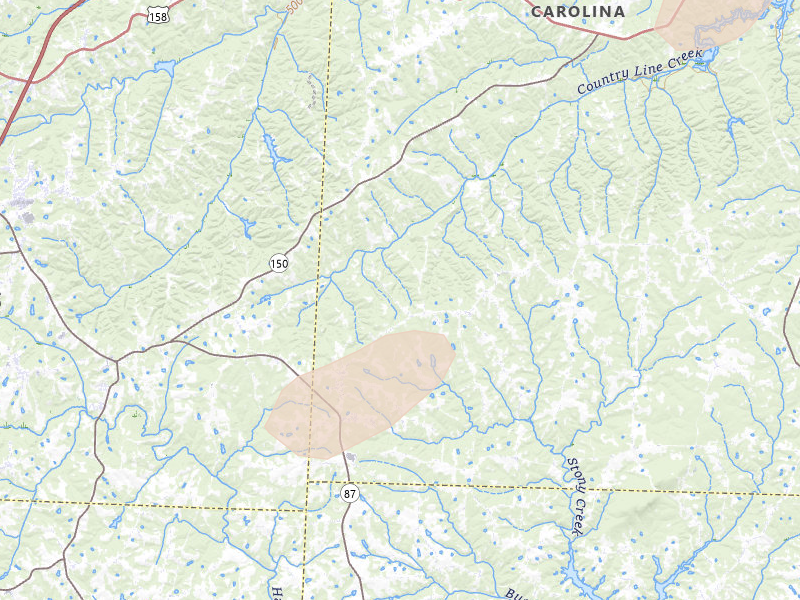
Yanceyville, NC 1.9 /10 severity
0.5" peak signal 232 mapped homes No ground reports
Blanch, NC 1.8 /10 severity
0.5" peak signal 109 mapped homes No ground reports
Pinetown, NC 1.8 /10 severity
0.5" peak signal 143 mapped homes No ground reports
Trenton, NC 1.8 /10 severity
0.5" peak signal 123 mapped homes No ground reports
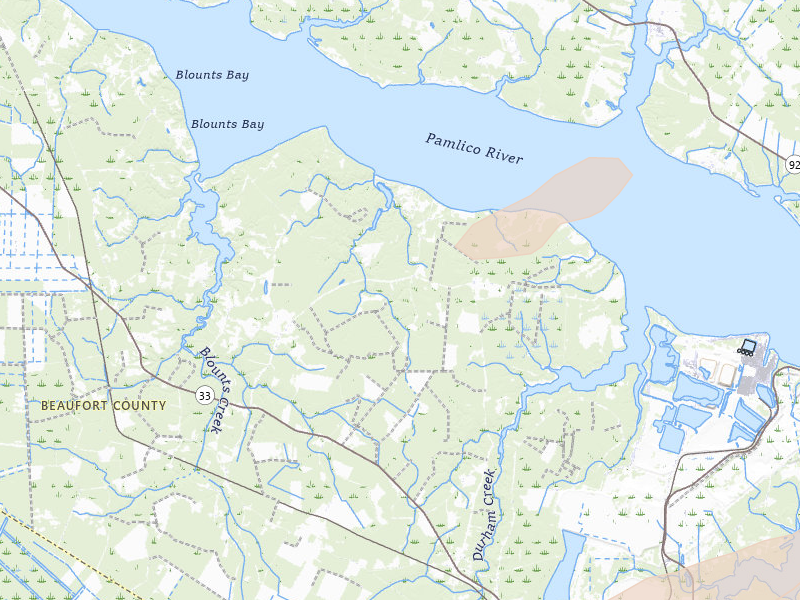
Blounts Creek, NC 1.7 /10 severity
0.5" peak signal 98 mapped homes No ground reports
Grantsboro, NC 1.7 /10 severity
0.5" peak signal 98 mapped homes No ground reports
Rose Hill, NC 1.7 /10 severity
0.5" peak signal 83 mapped homes No ground reports
Salemburg, NC 1.7 /10 severity
0.5" peak signal 63 mapped homes No ground reports
Pollocksville, NC 1.6 /10 severity
0.5" peak signal 49 mapped homes No ground reports

Pennsylvania

19 cities · up to 1.25" · 19,054 mapped homes
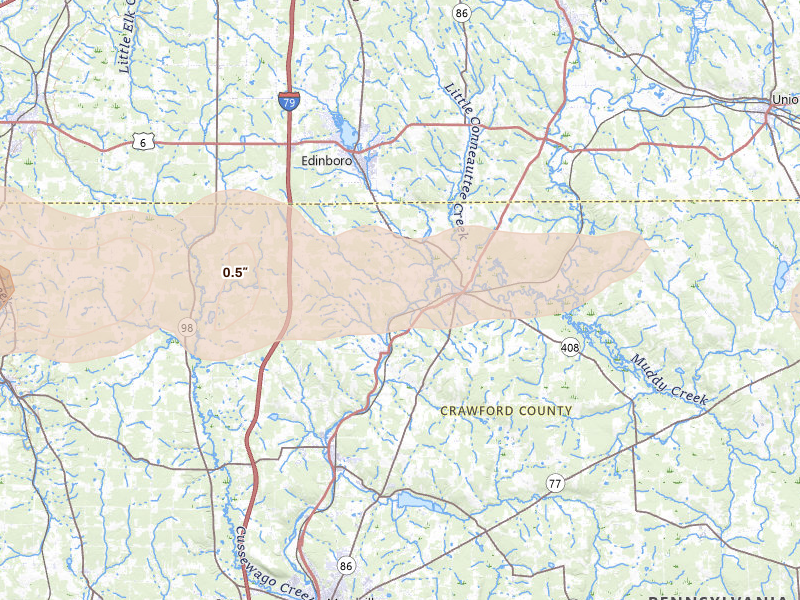
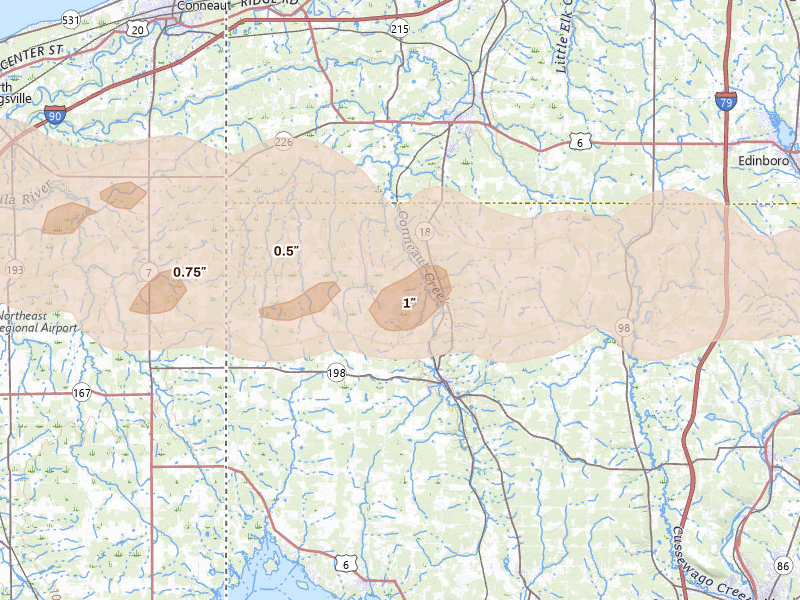
Cambridge Springs, PA 4.1 /10 severity
0.75" peak signal 3,072 mapped homes 3 ground reports
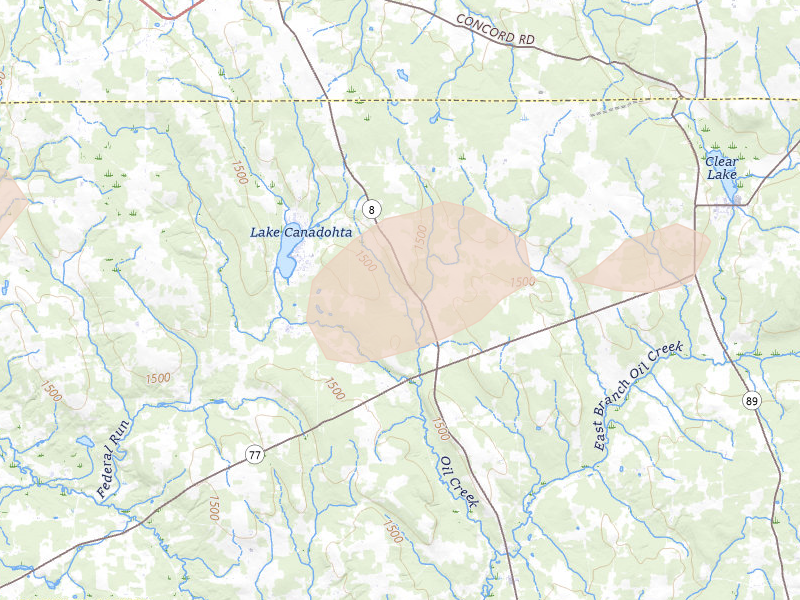
Springboro, PA 3.8 /10 severity
1" peak signal 3,253 mapped homes 1 ground report
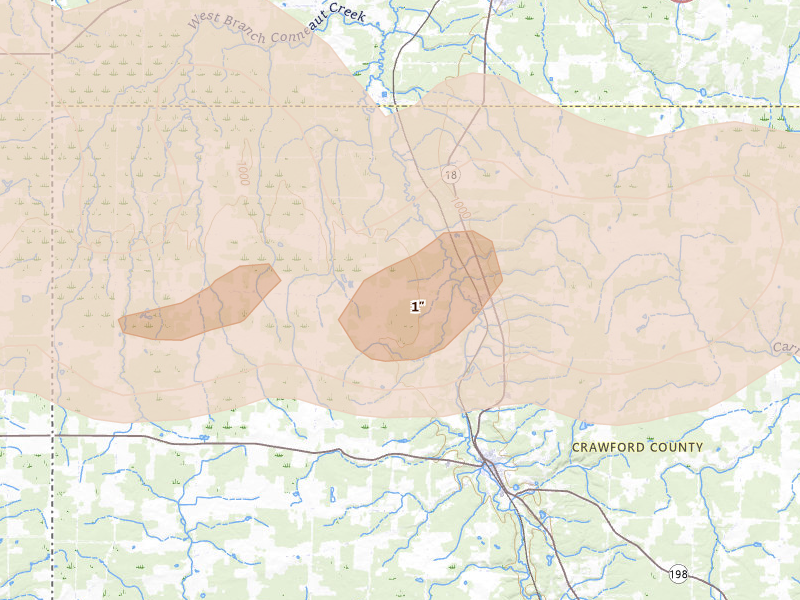
Conneautville, PA 3.6 /10 severity
1" peak signal 1,424 mapped homes 1 ground report
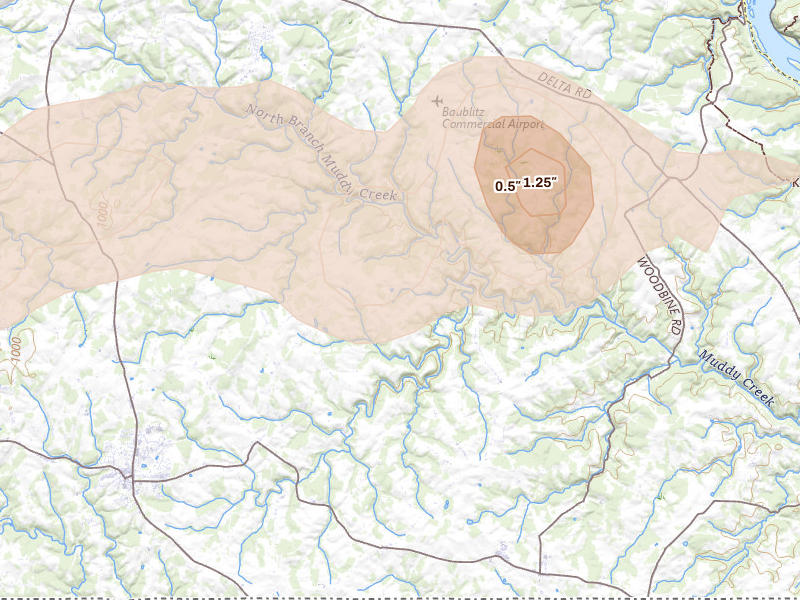
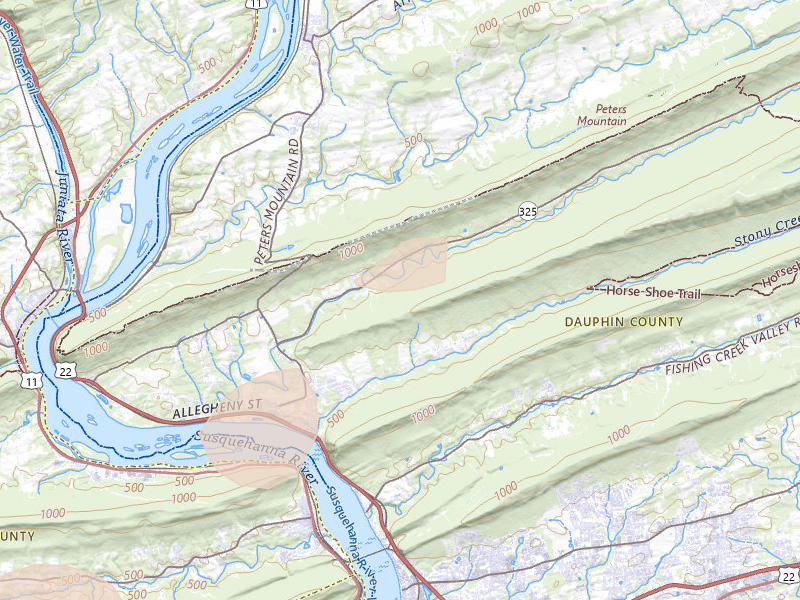
Airville, PA 3.5 /10 severity
1.25" peak signal 1,723 mapped homes No ground reports
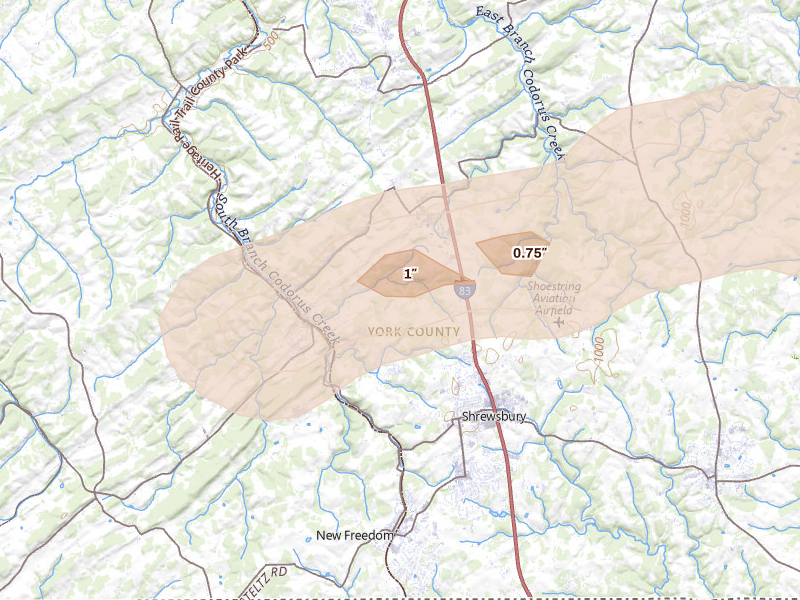
Glen Rock, PA 3.2 /10 severity
1" peak signal 2,647 mapped homes No ground reports
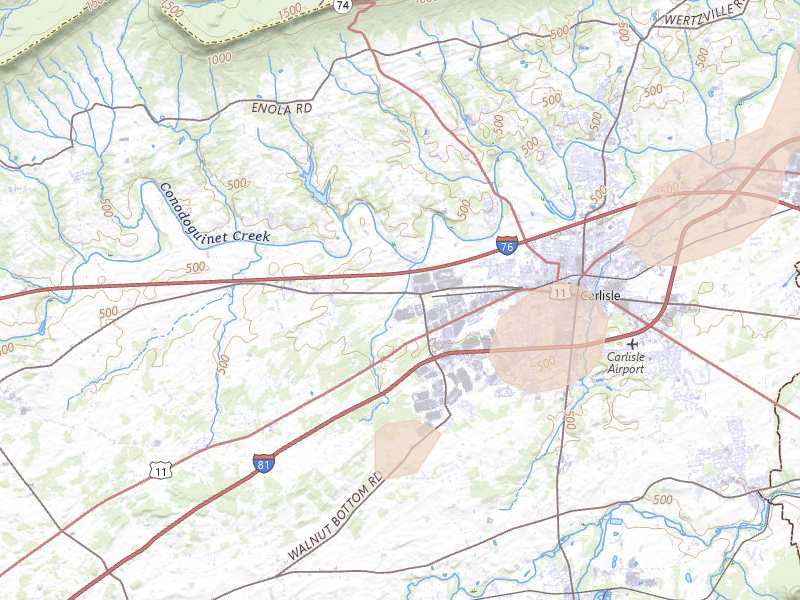
Carlisle, PA 3.0 /10 severity
0.5" peak signal 3,106 mapped homes 2 ground reports
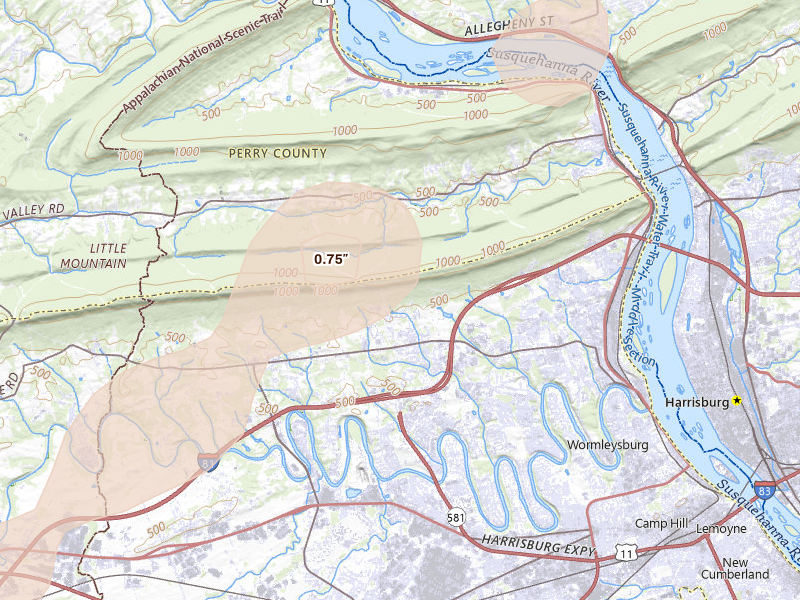
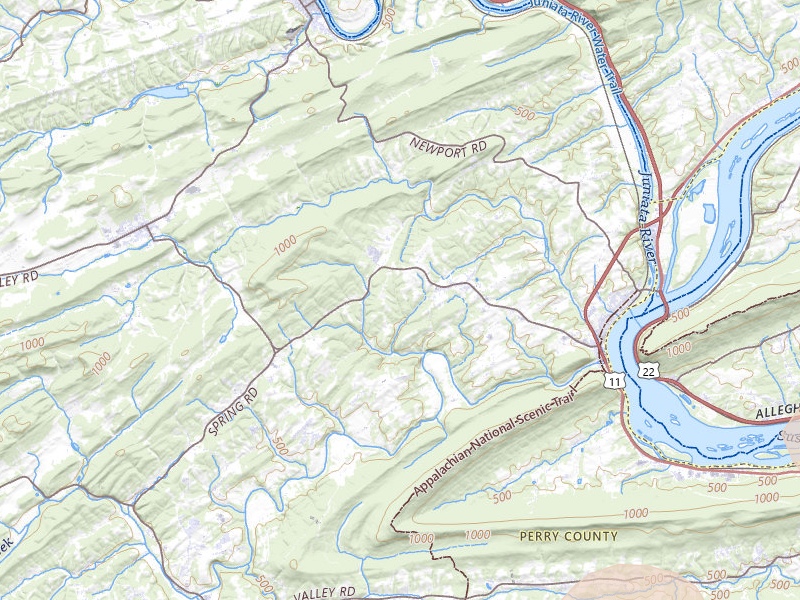
Enola, PA 2.9 /10 severity
0.75" peak signal 1,072 mapped homes 1 ground report
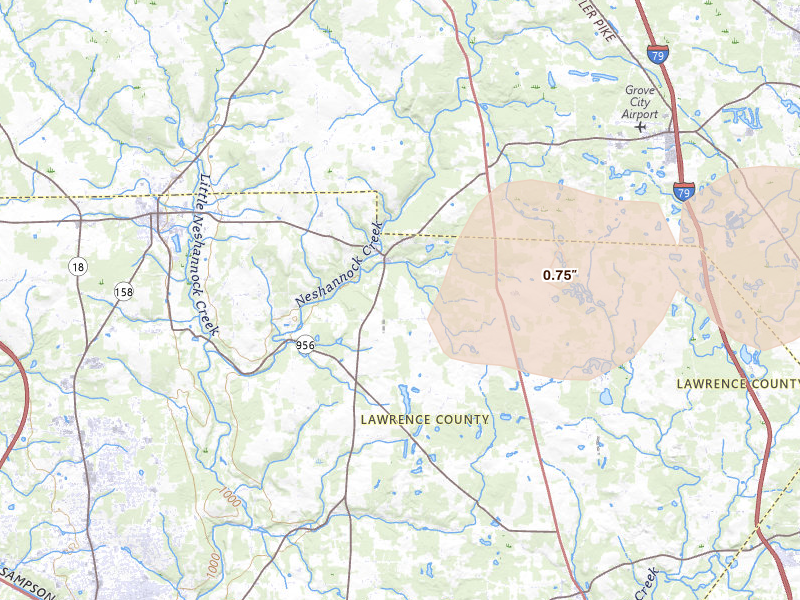
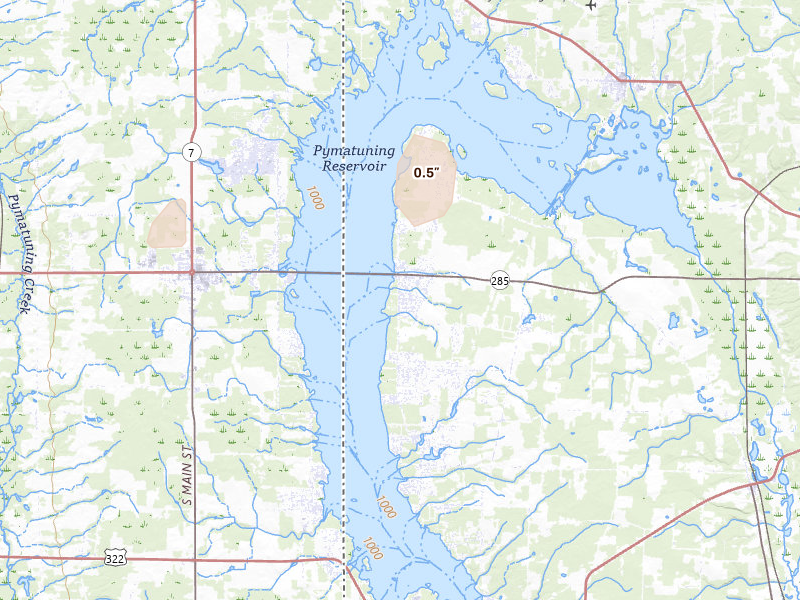
Volant, PA 2.5 /10 severity
0.75" peak signal 597 mapped homes No ground reports
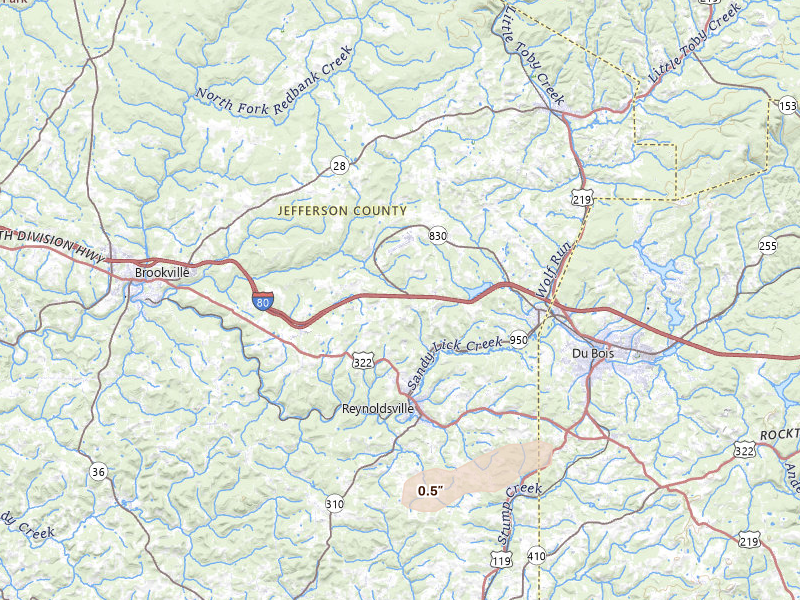
Reynoldsville, PA 2.4 /10 severity
0.5" peak signal 247 mapped homes 1 ground report
Dauphin, PA 2.2 /10 severity
0.5" peak signal 638 mapped homes No ground reports
Duncannon, PA 2.1 /10 severity
0.5" peak signal 521 mapped homes No ground reports
Linesville, PA 2.0 /10 severity
0.5" peak signal 329 mapped homes No ground reports
Union City, PA 1.9 /10 severity
0.5" peak signal 200 mapped homes No ground reports
Spartansburg, PA 1.7 /10 severity
0.5" peak signal 92 mapped homes No ground reports
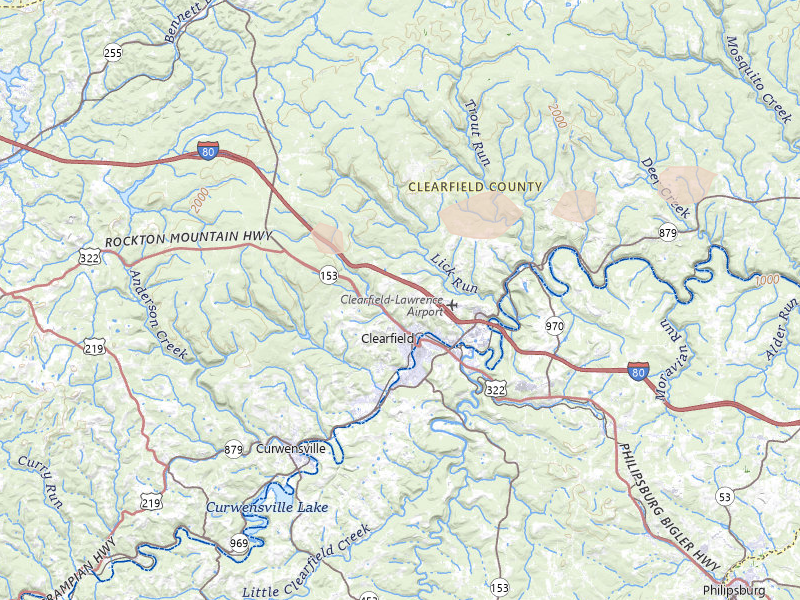
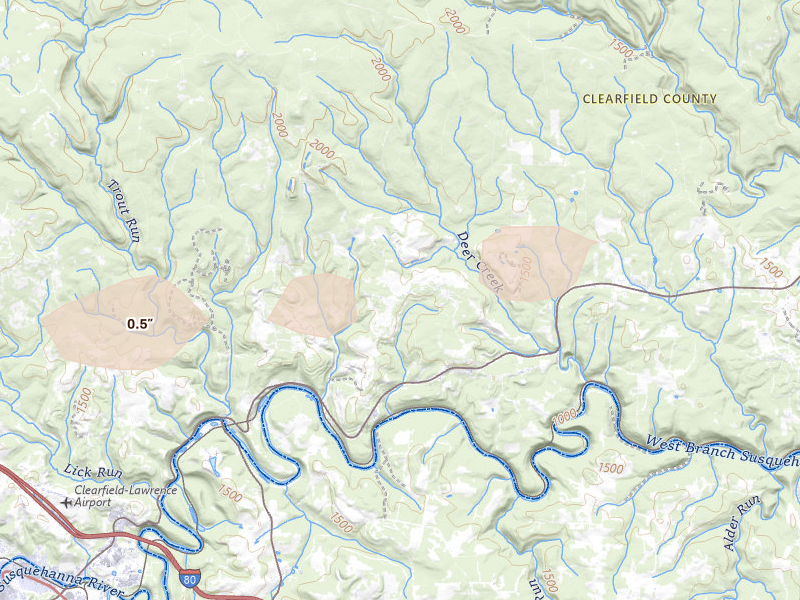
Clearfield, PA 1.6 /10 severity
0.5" peak signal 58 mapped homes No ground reports
Frenchville, PA 1.6 /10 severity
0.5" peak signal 45 mapped homes No ground reports
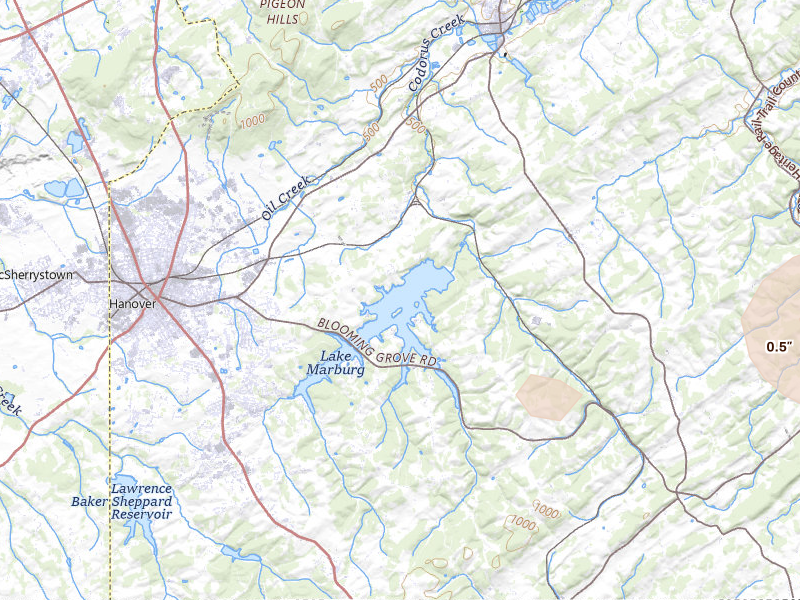
Spring Grove, PA 1.5 /10 severity
0.5" peak signal 29 mapped homes No ground reports
Penfield, PA 0.9 /10 severity
0.5" peak signal 1 mapped homes No ground reports
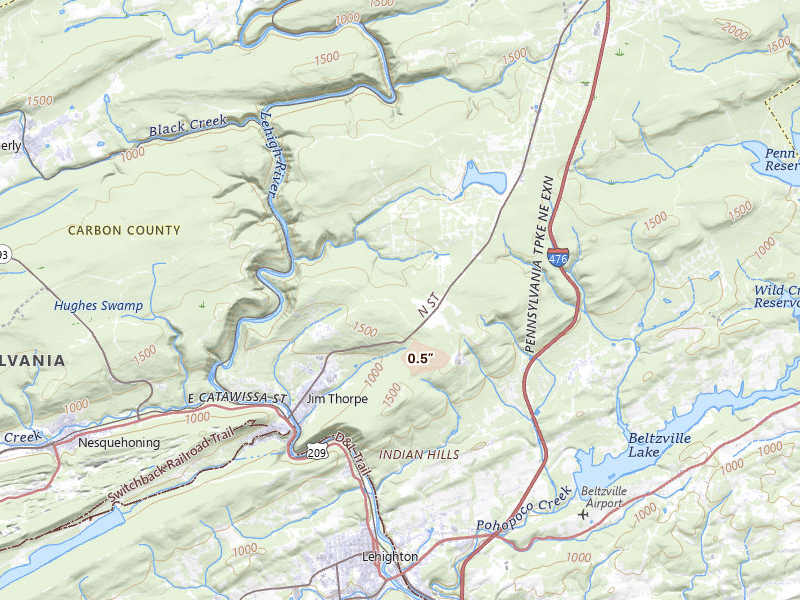
Jim Thorpe, PA 0.8 /10 severity
0.5" peak signal 0 mapped homes No ground reports

Florida

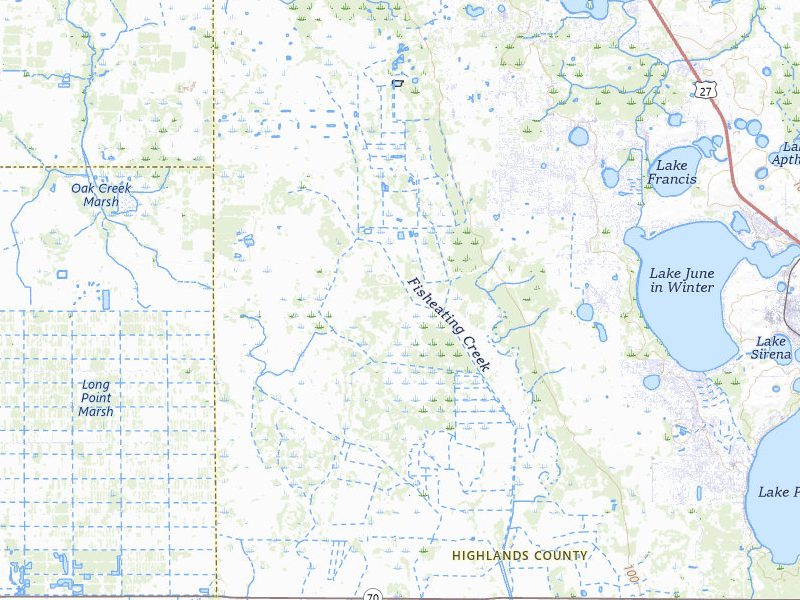
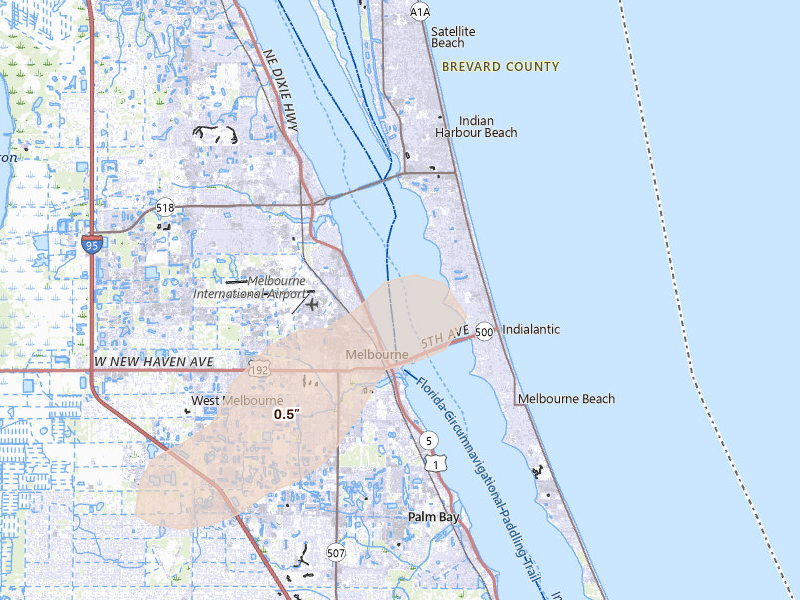
12 cities · up to 1.25" · 14,745 mapped homes
Texas

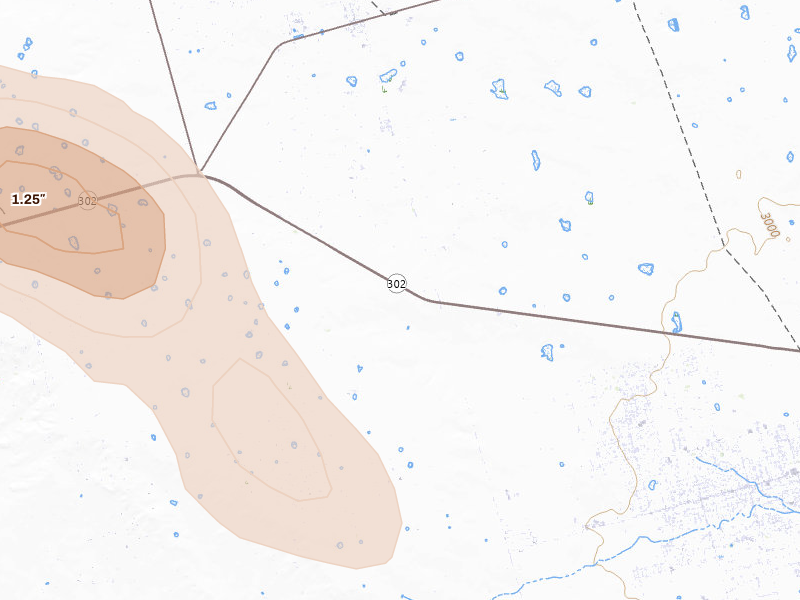
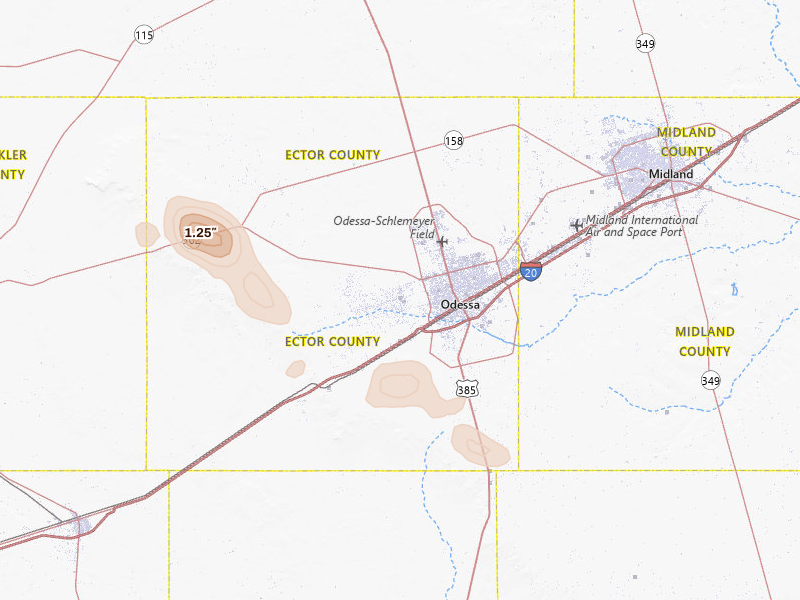
8 cities · up to 1.25" · 896 mapped homes
Virginia

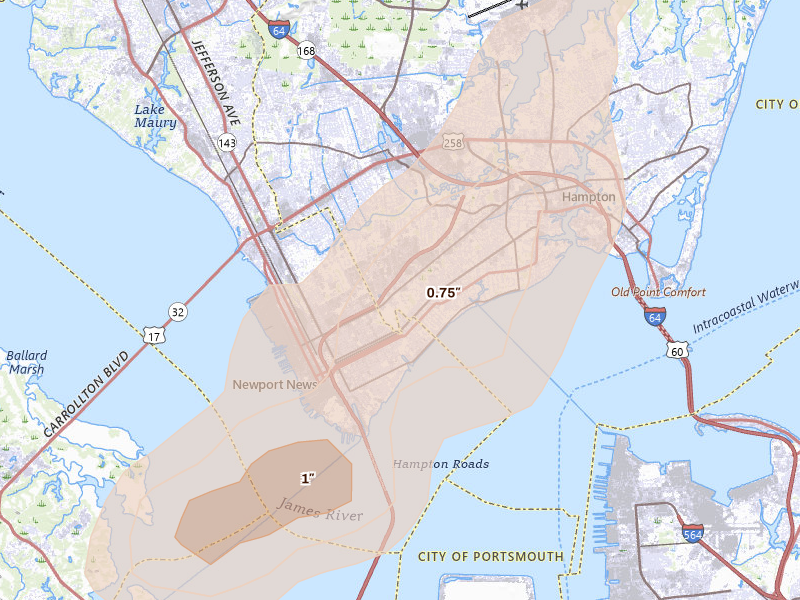
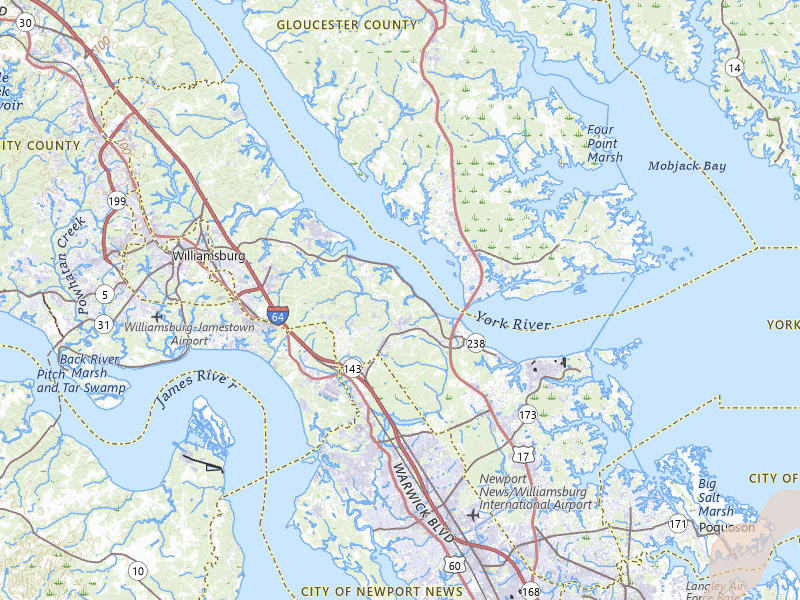
14 cities · up to 1" · 44,129 mapped homes
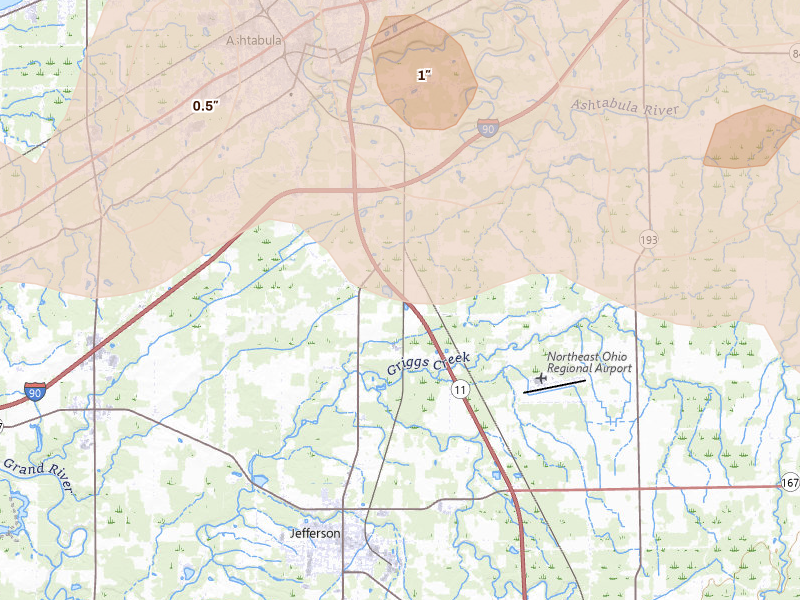
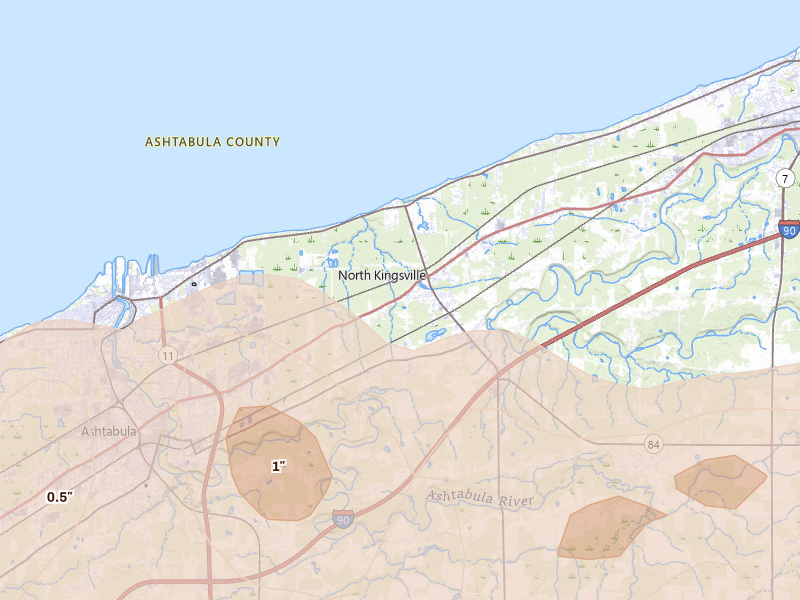
Ohio

11 cities · up to 1" · 19,613 mapped homes
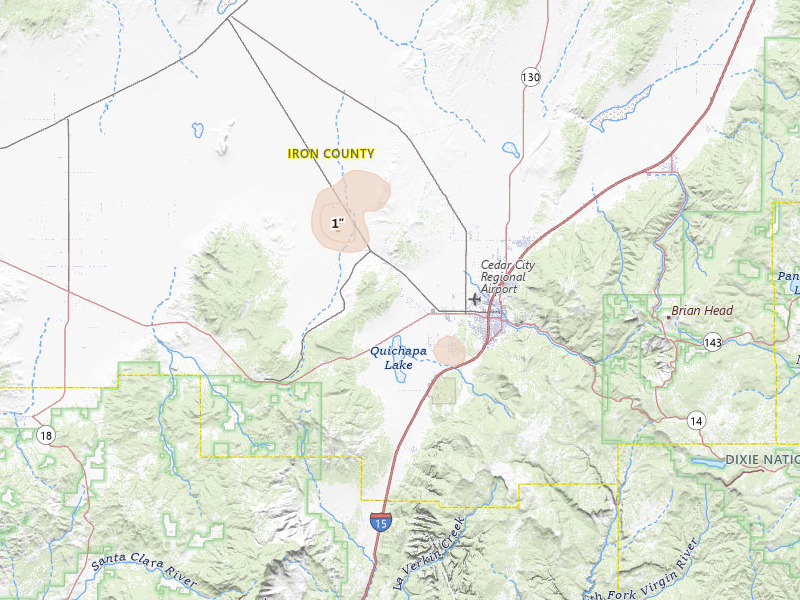
Utah

1 city · up to 1" · 440 mapped homes
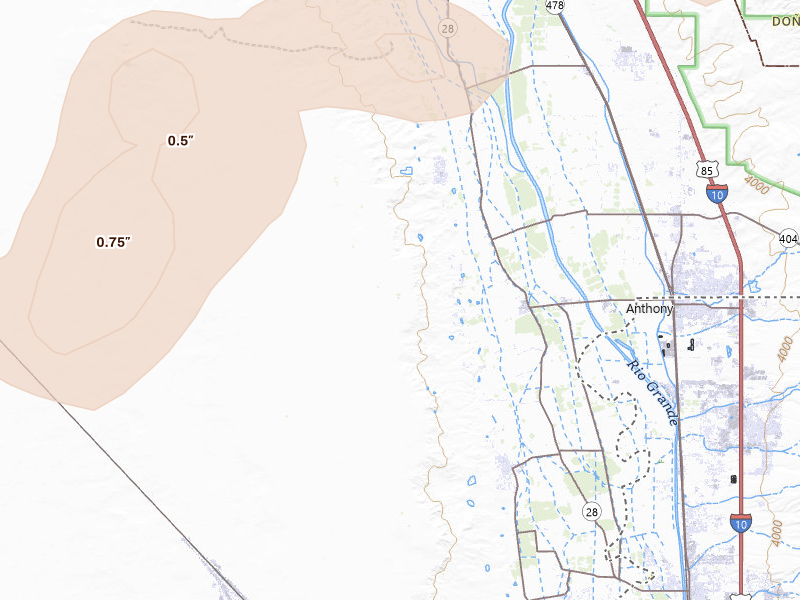
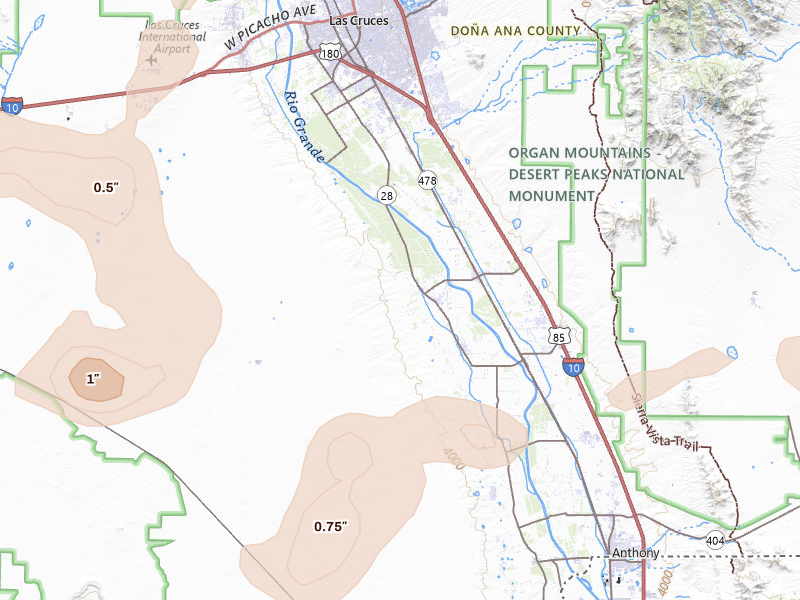
New Mexico

10 cities · up to 1" · 914 mapped homes
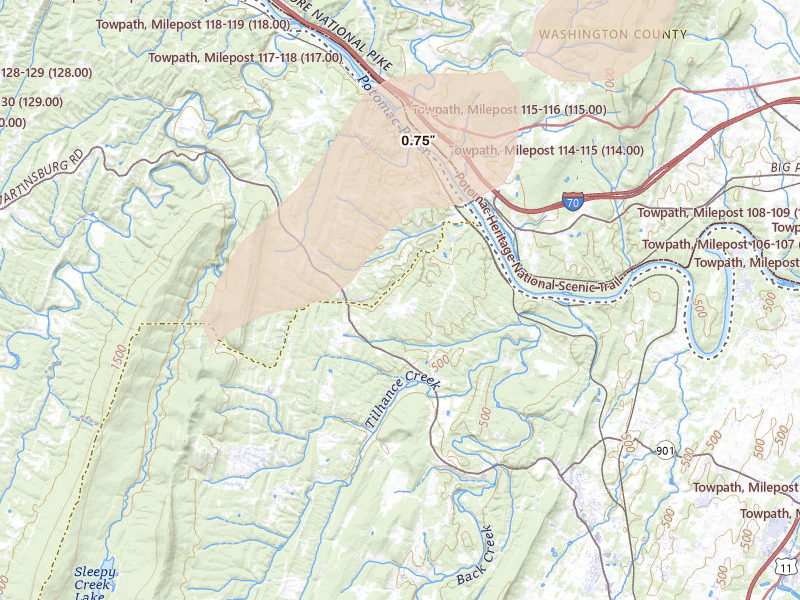
West Virginia

1 city · up to 0.75" · 972 mapped homes
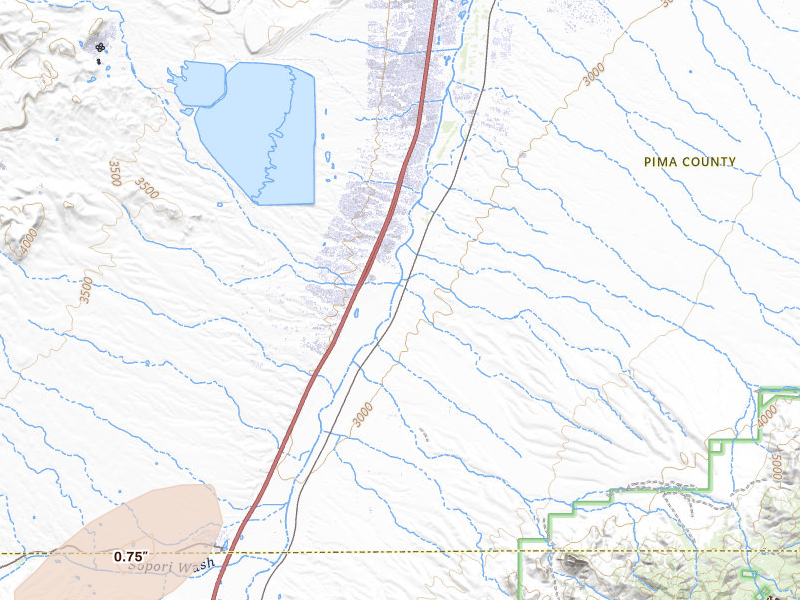
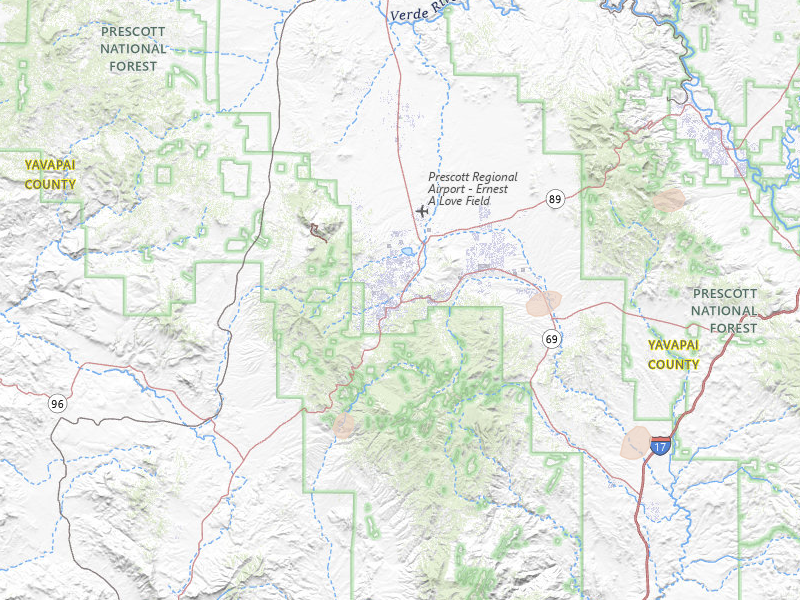
Arizona

6 cities · up to 0.75" · 2,258 mapped homes
Georgia

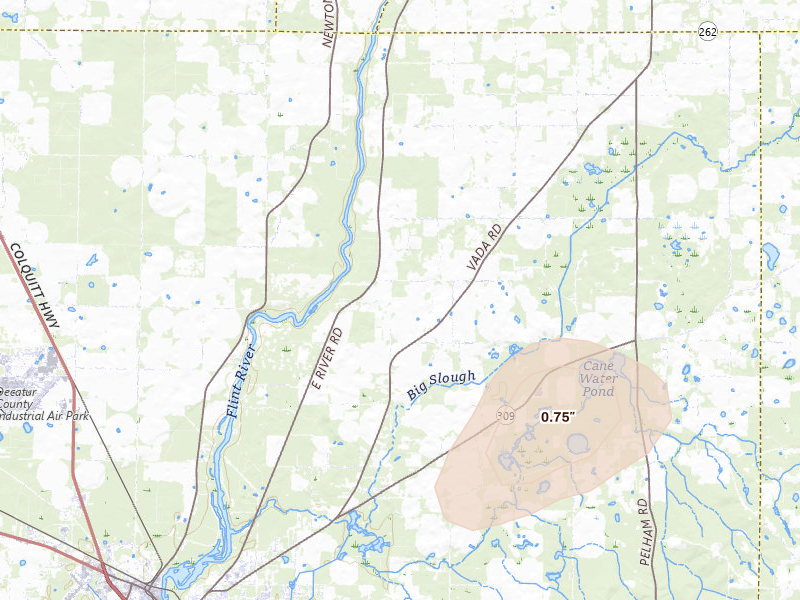
21 cities · up to 0.75" · 1,370 mapped homes
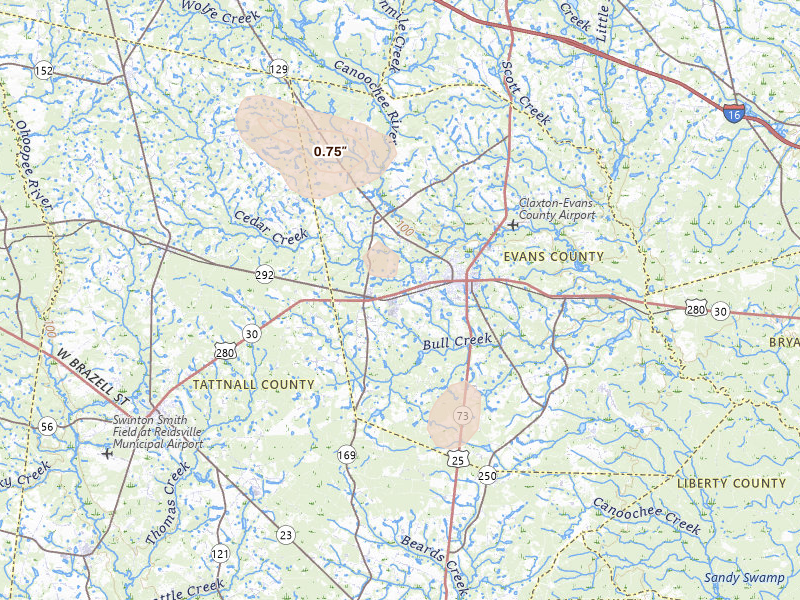
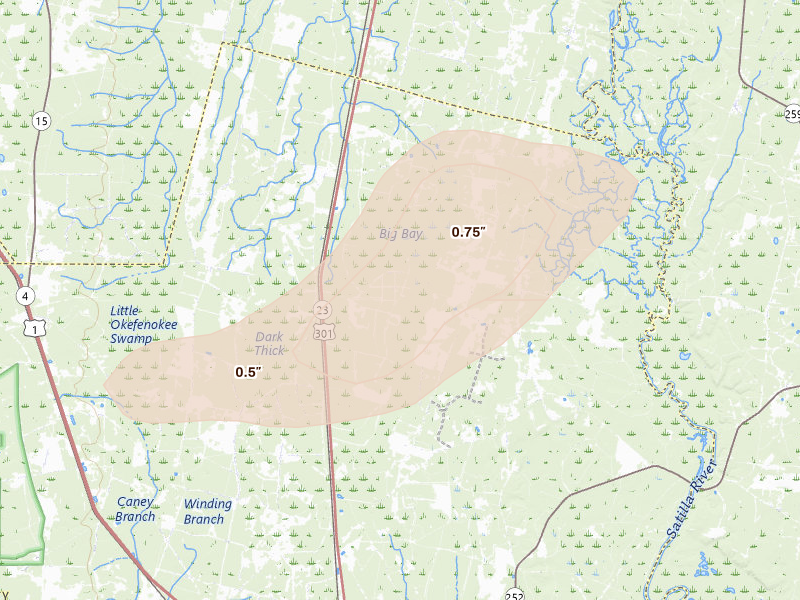
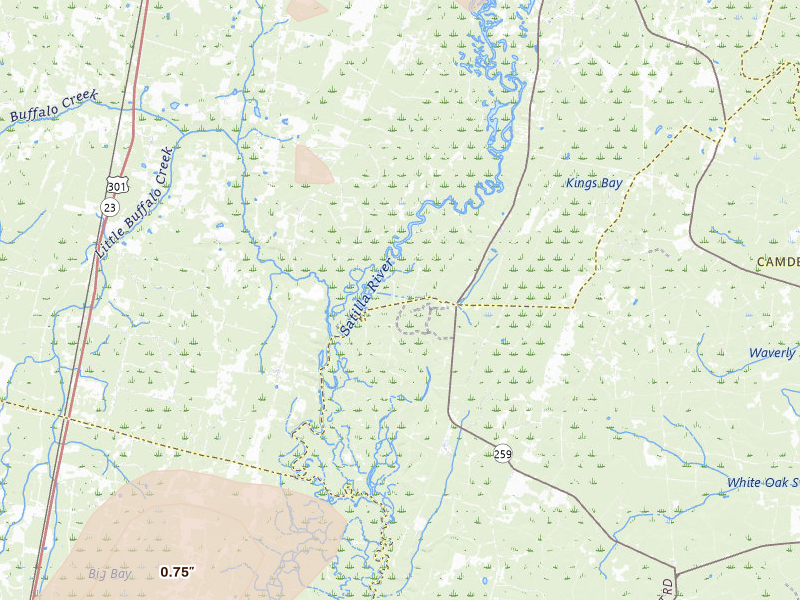
Claxton, GA 2.4 /10 severity
0.75" peak signal 355 mapped homes No ground reports
Bainbridge, GA 2.2 /10 severity
0.75" peak signal 135 mapped homes No ground reports
Climax, GA 2.1 /10 severity
0.75" peak signal 104 mapped homes No ground reports
Folkston, GA 2.0 /10 severity
0.75" peak signal 62 mapped homes No ground reports
Waynesville, GA 1.9 /10 severity
0.75" peak signal 32 mapped homes No ground reports
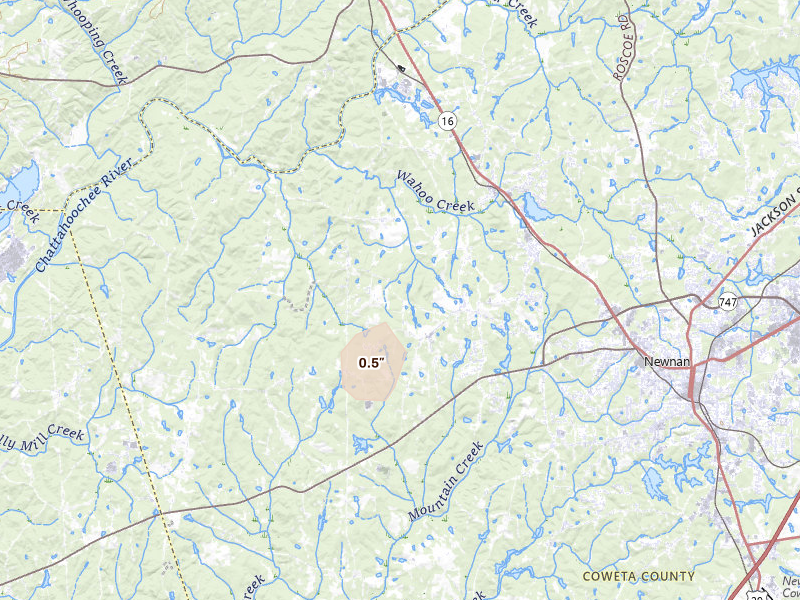
Newnan, GA 1.8 /10 severity
0.5" peak signal 135 mapped homes No ground reports
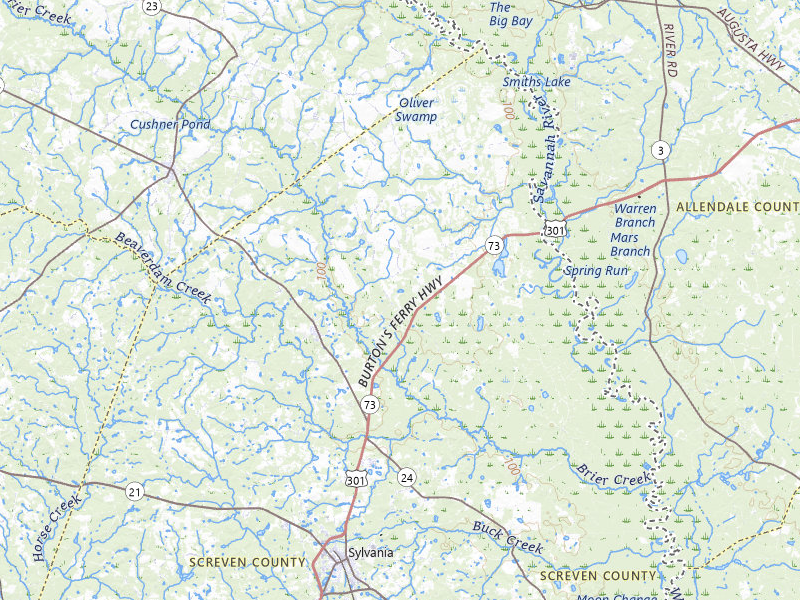
Sylvania, GA 1.8 /10 severity
0.5" peak signal 115 mapped homes No ground reports
Lyons, GA 1.7 /10 severity
0.5" peak signal 74 mapped homes No ground reports
Canon, GA 1.6 /10 severity
0.5" peak signal 61 mapped homes No ground reports
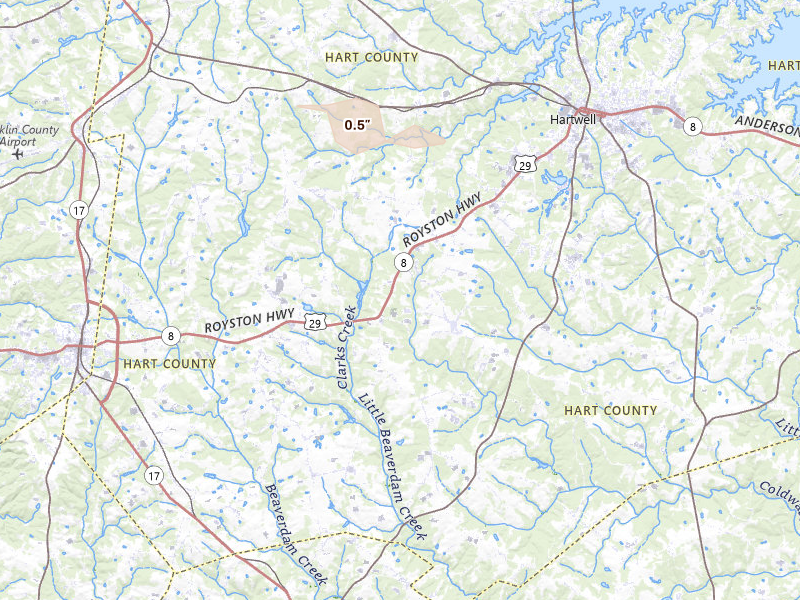
Hartwell, GA 1.6 /10 severity
0.5" peak signal 61 mapped homes No ground reports
Watkinsville, GA 1.6 /10 severity
0.5" peak signal 51 mapped homes No ground reports
Barnesville, GA 1.5 /10 severity
0.5" peak signal 25 mapped homes No ground reports
Donalsonville, GA 1.5 /10 severity
0.5" peak signal 37 mapped homes No ground reports
Wadley, GA 1.5 /10 severity
0.5" peak signal 36 mapped homes No ground reports
Jesup, GA 1.4 /10 severity
0.5" peak signal 21 mapped homes No ground reports
Lake Park, GA 1.4 /10 severity
0.5" peak signal 17 mapped homes No ground reports
Patterson, GA 1.4 /10 severity
0.5" peak signal 16 mapped homes No ground reports
Nahunta, GA 1.3 /10 severity
0.5" peak signal 12 mapped homes No ground reports
Royston, GA 1.3 /10 severity
0.5" peak signal 13 mapped homes No ground reports
Blakely, GA 1.2 /10 severity
0.5" peak signal 7 mapped homes No ground reports
Screven, GA 0.9 /10 severity
0.5" peak signal 1 mapped homes No ground reports

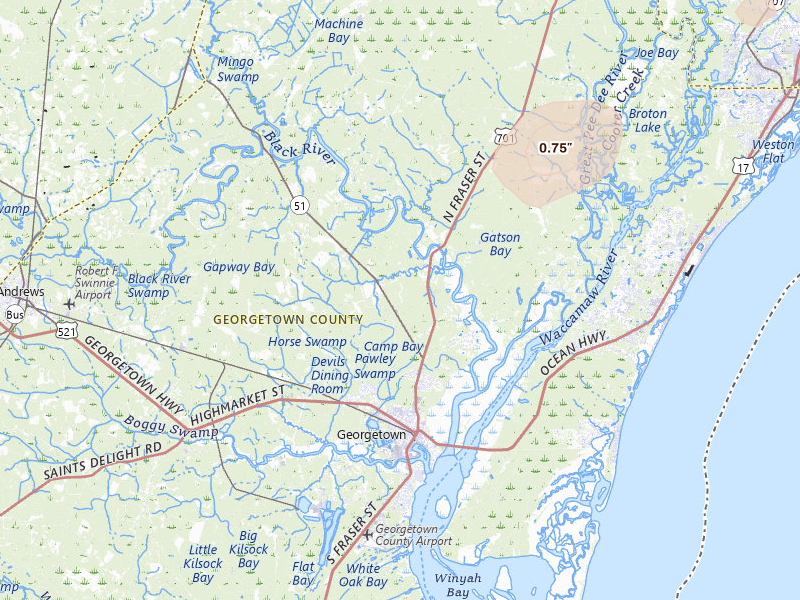
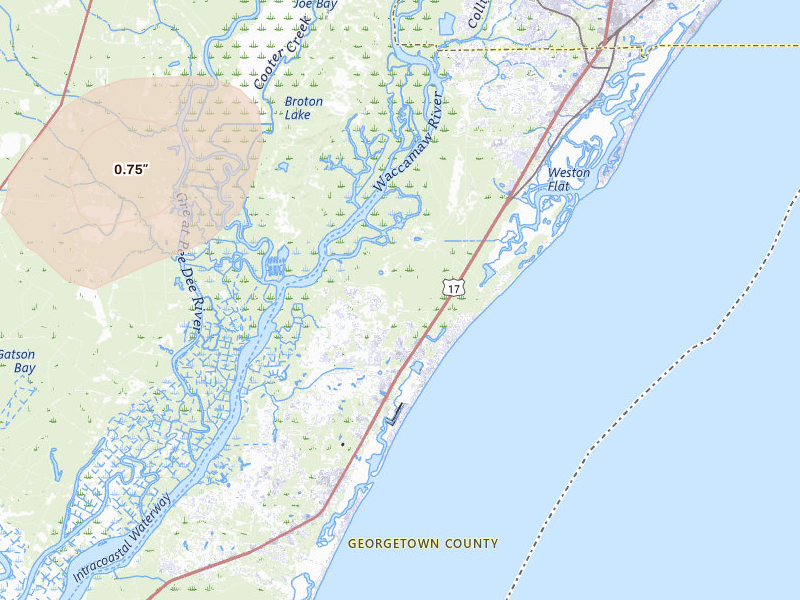
South Carolina

8 cities · up to 0.75" · 1,511 mapped homes
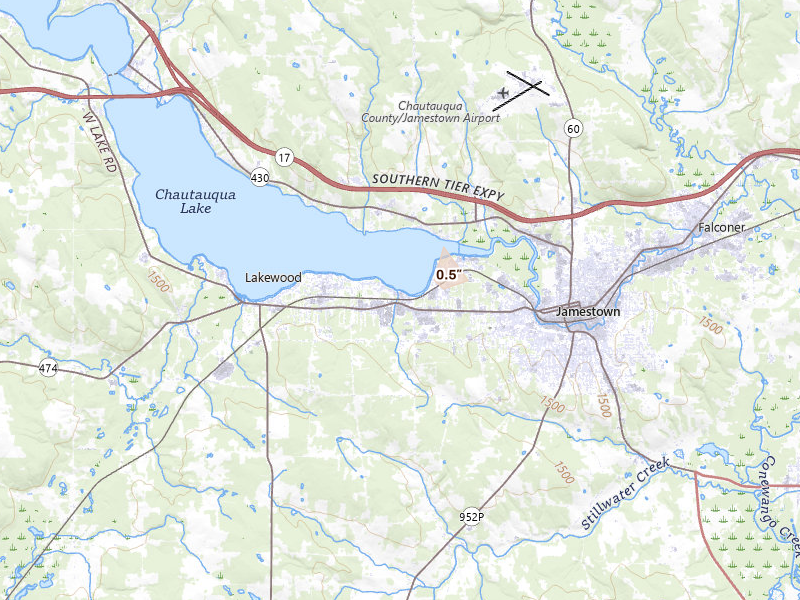
New York

1 city · up to 0.5" · 258 mapped homes
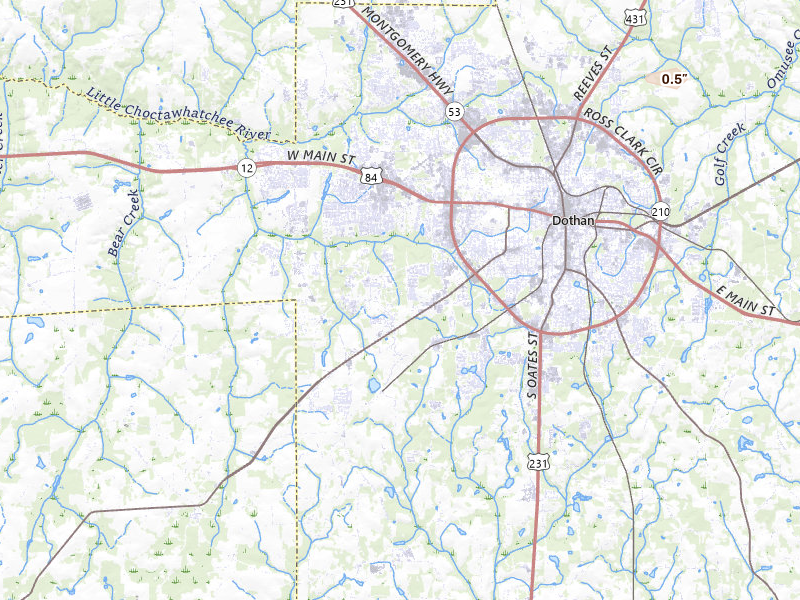
Alabama

1 city · up to 0.5" · 24 mapped homes
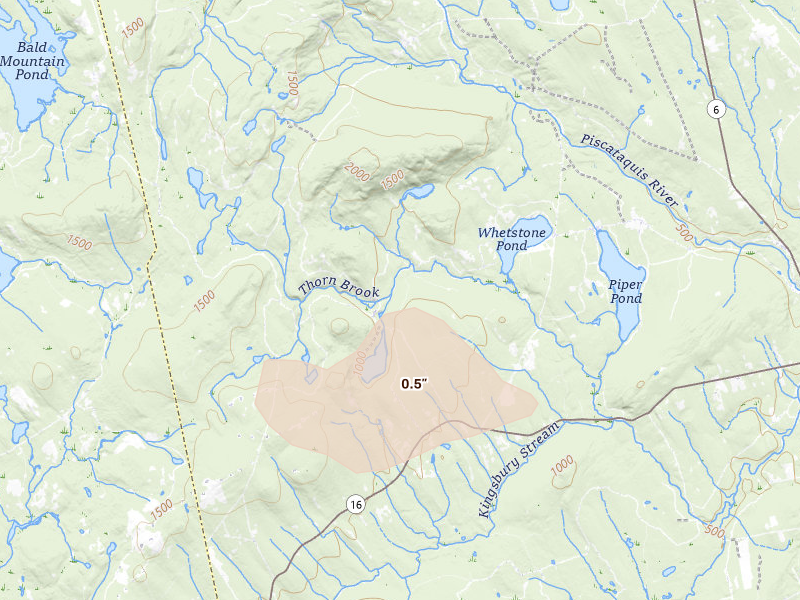
Maine

1 city · up to 0.5" · 6 mapped homes
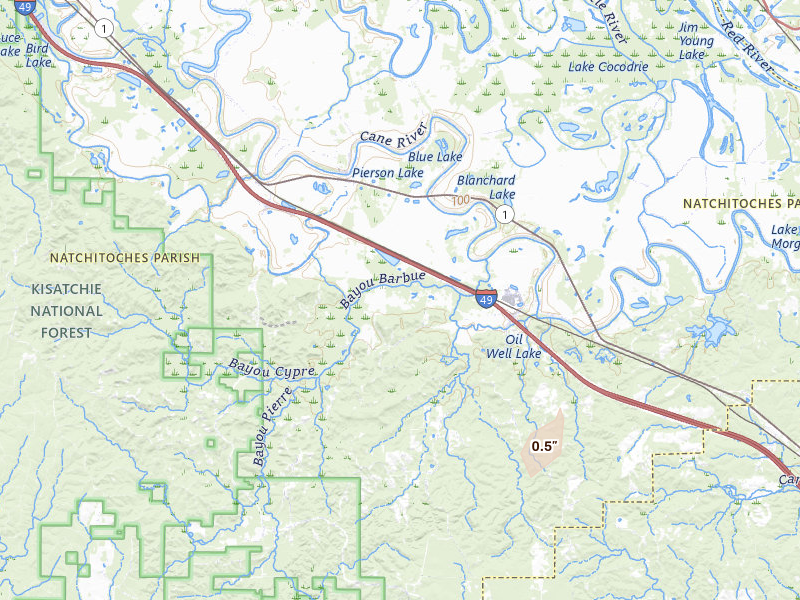
Louisiana

1 city · up to 0.5" · 2 mapped homes
Nevada

1 city · up to 0.5" · 0 mapped homes
← All storm days

Overview Pro · iPhone + web

One app for your prospecting day.

The hail map, your next recommended area, and the tools to work it. Start on your own; the same subscription also includes access for up to 4 team members.

Overview Pro

One plan · iPhone + web

Monthly · US App Store

$149.99 / month

5,000 new addresses per user each month on Pro. Put your 200 trial addresses to work before another week goes to guesswork.

Optional outreach

+ $0.21 per contact returned
Available homeowner names and phone numbers, with freshness and DNC flags.
+ $0.75 per postcard mailed
Print, postage, and delivery tracking included.

What's included

Get recommended places to prospect, or draw your own. The same plan gives you the tools to work either one.

  • Hail maps, storm history, and live radar
  • Curated prospecting recommendations and Quests
  • Canvassing sessions and navigation
  • Door outcomes, notes, and photos
  • Visit history and follow-up Quests
  • Alerts for your saved territories
  • Polygon and hexagon draw tools
  • Saved work areas and address lists
  • CSV exports for your dialer or CRM
  • XP, levels, and the leaderboard
  • Access on iPhone and the web
  • Up to 4 team members

7-day free trial in the iPhone app. No card required to start.

Choose whether to subscribe when your trial ends. Paid subscriptions renew monthly. Manage or cancel in your Apple Account settings.

See all pricing and billing details →
Start free trial

Web trial: 7 days free. Card required. $150/month after the trial unless cancelled.

The next storm won’t wait for you.

Set your territory and alerts today. When hail hits, use Overview to choose your streets and get moving.

Download on the App Store

7-day free trial in the iPhone app. No card required to start.

For iPhone. Android coming soon.

Open Jun 14 on the live map → Start free trial

Web trial: 7 days free. Card required. $150/month after the trial unless cancelled.

Storm days are convective days (noon-to-noon UTC). Cities and counts are the set Overview tracks, not every place hail fell. Ground reports are public-domain observations from the NOAA Storm Prediction Center; radar sizes are detections and estimates, not confirmed damage.