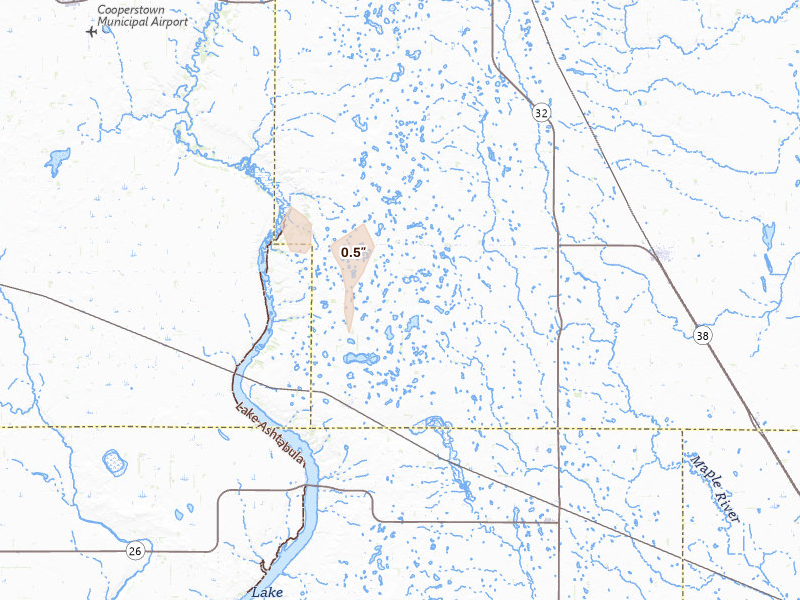
Hail storms on Jul 13, 2026

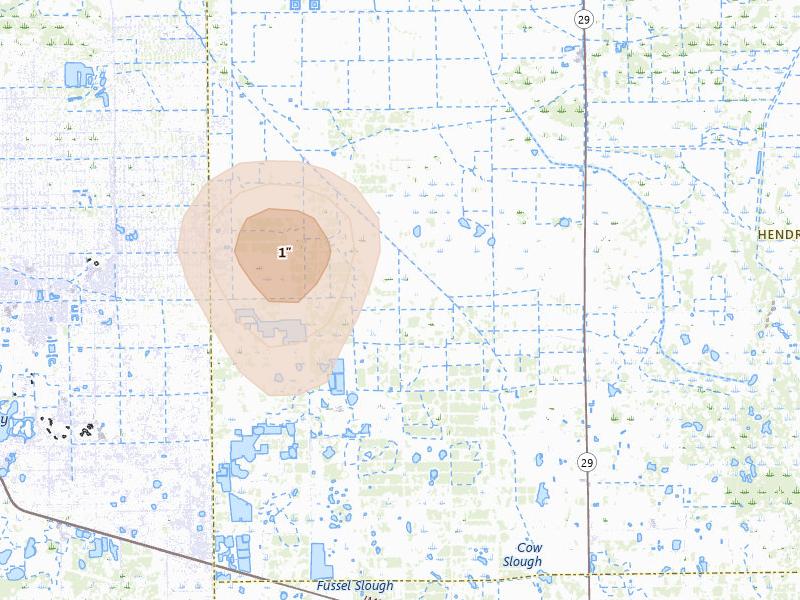
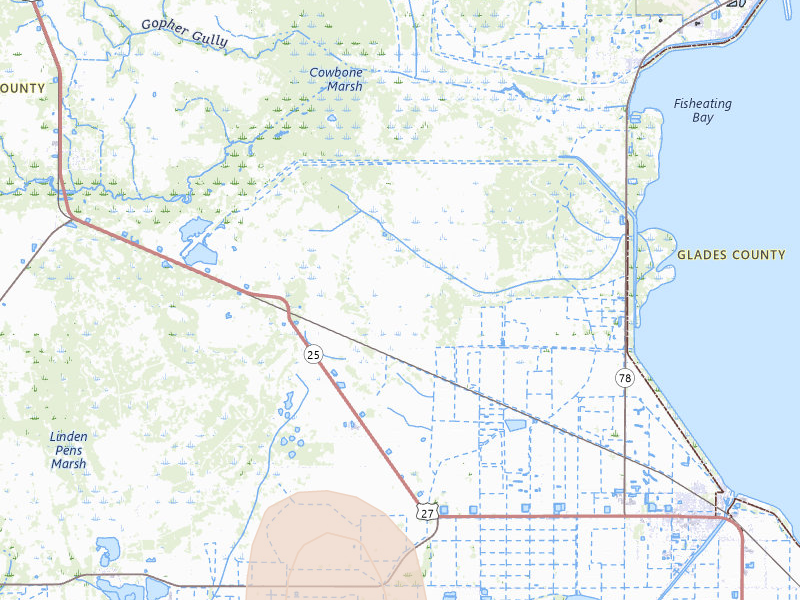
93 cities across 14 states recorded hail on Jul 13, 2026 — a multi-state outbreak. The peak radar-indicated size reached 2.25" over Immokalee — about the size of a tennis ball. That is a severe hail signal, not property-level damage confirmation.

Download on the App Store

7-day free trial in the iPhone app. No card required to start.

For iPhone. Android coming soon.

Web trial: 7 days free. Card required. $150/month after the trial unless cancelled.

Cities hit 93 across 14 states
Peak hail signal 2.25" ≈ tennis ball · Immokalee
Homes in footprints 37,885
Ground reports 3

Jul 13, 2026 · Immokalee, FL: 2.25" peak radar signal · NEXRAD + radar-estimated size maps

Mapped cities, by state

Every tracked city with a hail signal on Jul 13, 2026

93 cities · up to 2.25" · 37,885 mapped homes · noon-to-noon UTC

Every tracked city that recorded hail on this convective day, biggest signal first. Each row opens that city's full storm record.

How to read this day

A storm day on Overview is a convective day — it runs from noon to noon UTC, so late-night hail is grouped with the afternoon storm that spawned it rather than split across two calendar dates. Everything below happened inside the Jul 13, 2026 convective day. Across those footprints sit roughly 37,885 homes, and 3 ground reports were filed with the National Weather Service.

The cities are listed with the biggest storm first, measured by Overview's severity score. Each row links through to that city's own storm page, where you'll find the radar surfaces, every ground report filed, and the hail footprint drawn on the map.

The counts here are the size of the set of cities Overview tracks — never "every US city" — so read a quiet day as "quiet among the places we watch," not as proof nothing happened elsewhere.

Florida

33 cities · up to 2.25" · 26,329 mapped homes
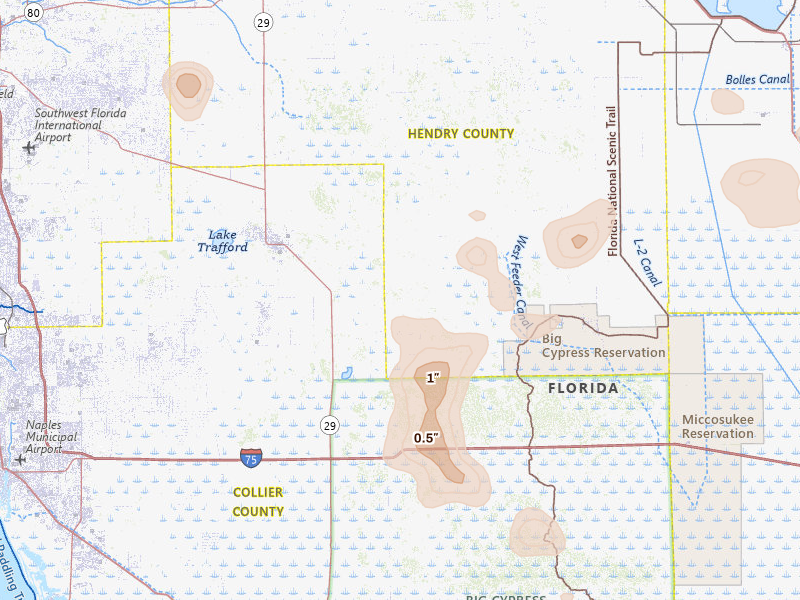
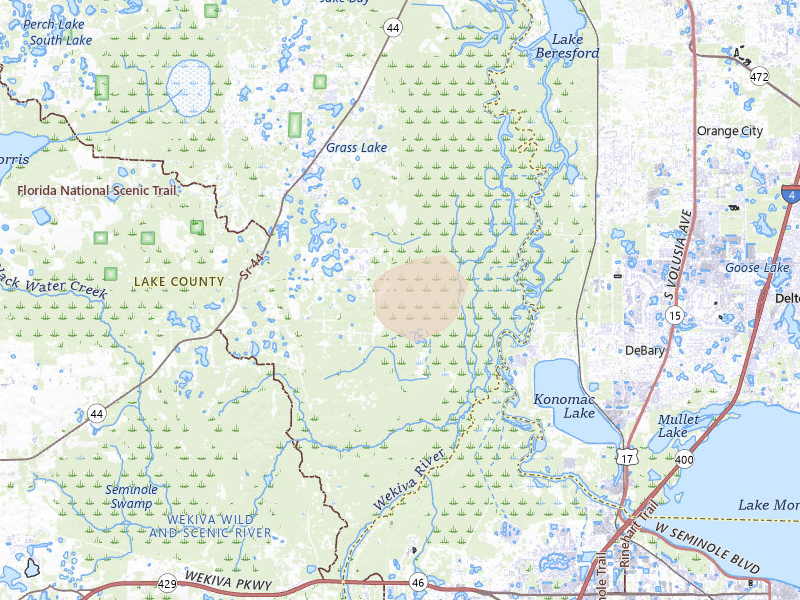
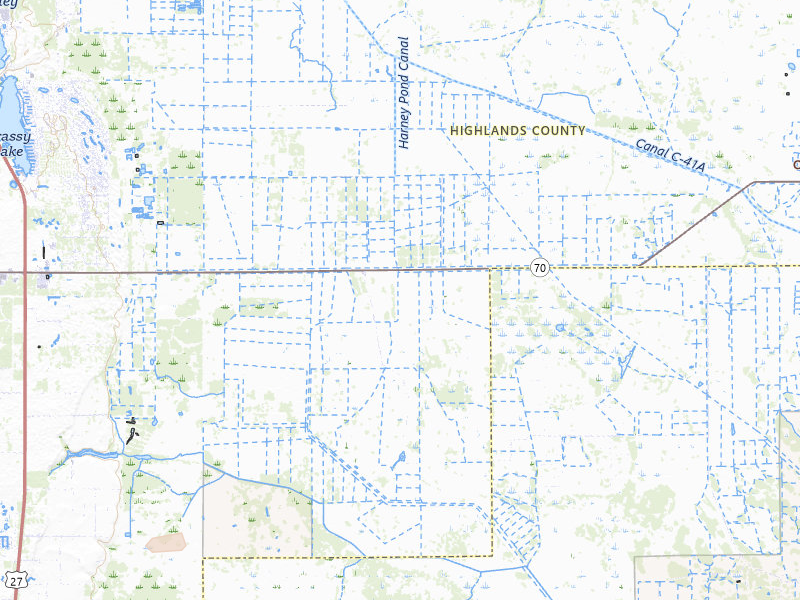
Immokalee, FL 4.5 /10 severity
2.25" peak signal 46 mapped homes 1 ground report
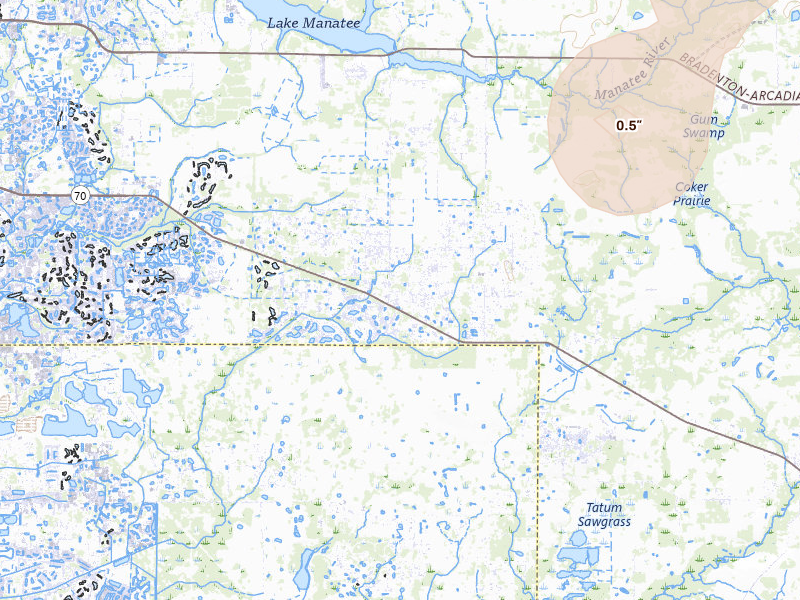
Myakka City, FL 4.5 /10 severity
2.25" peak signal 219 mapped homes No ground reports
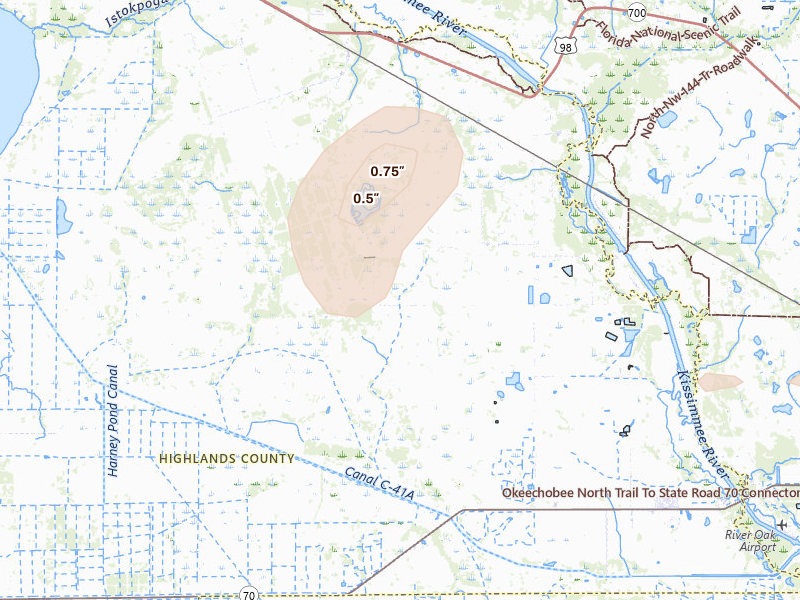
Eustis, FL 4.2 /10 severity
2" peak signal 257 mapped homes No ground reports
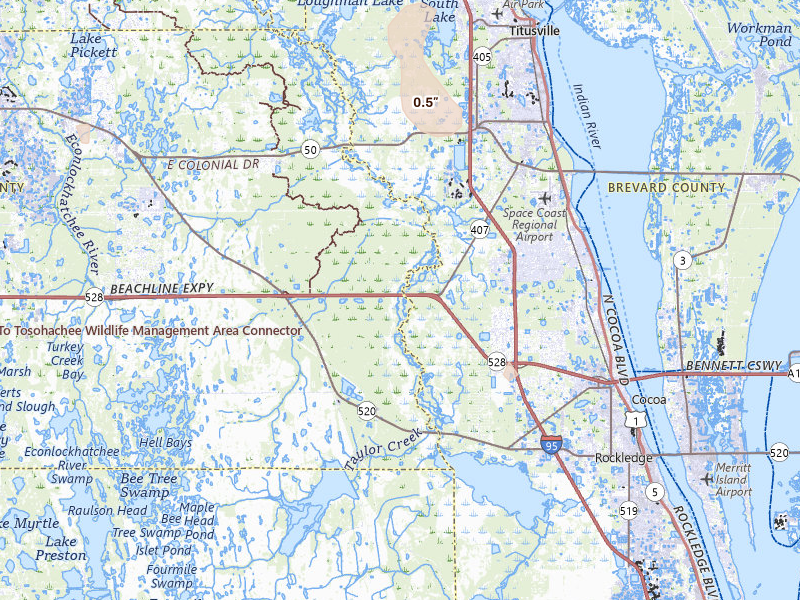
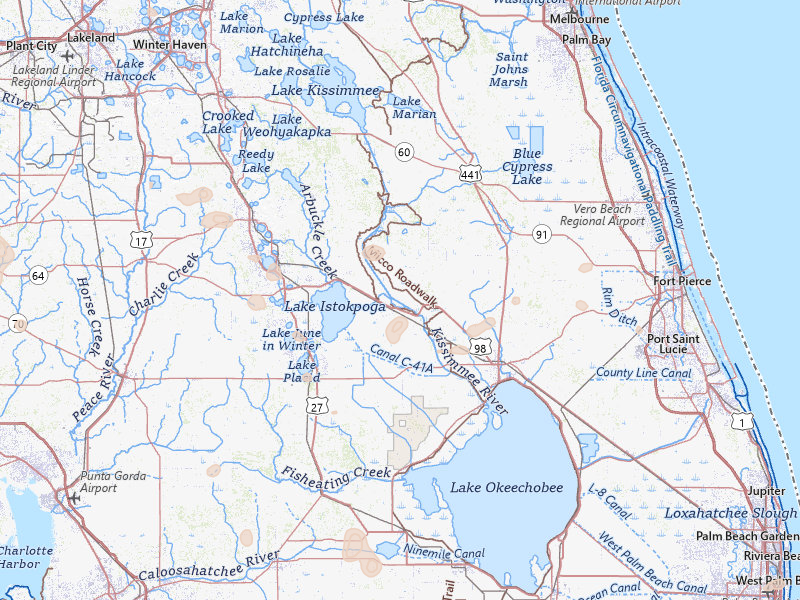
Okeechobee, FL 4.1 /10 severity
1.75" peak signal 242 mapped homes 1 ground report
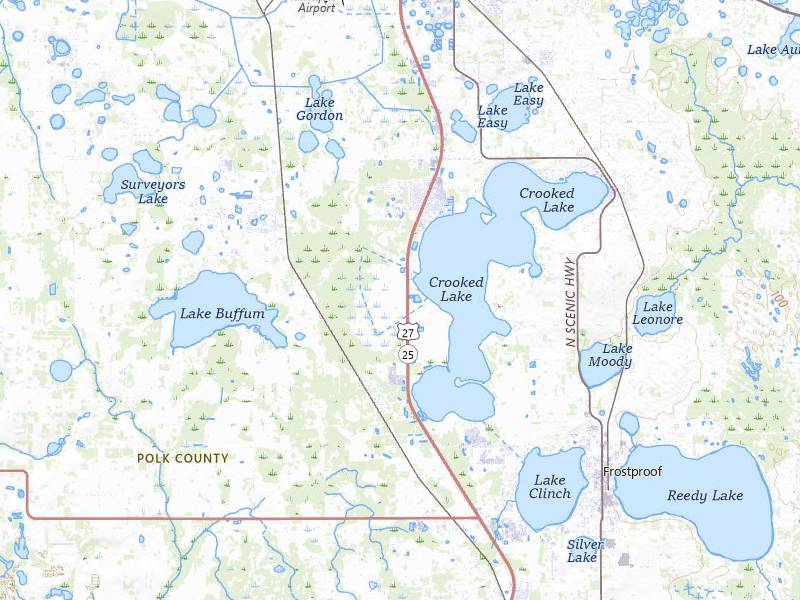
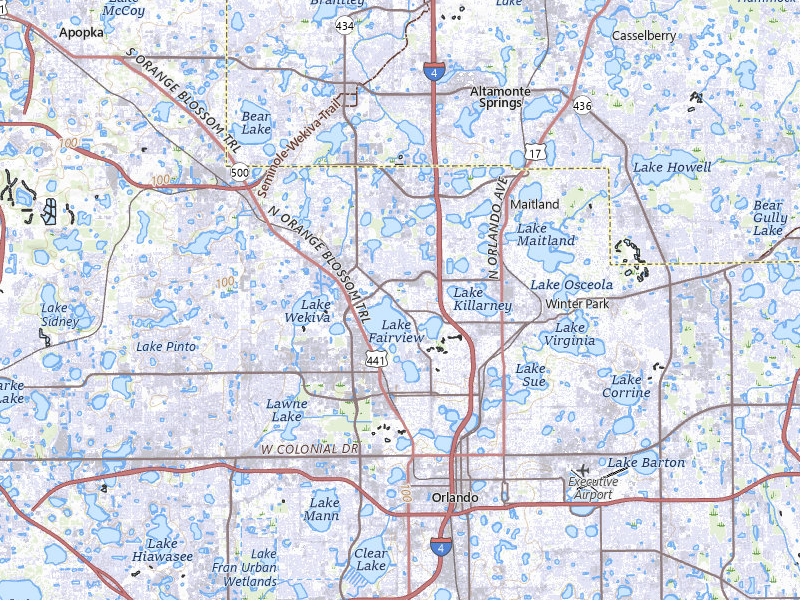
Orlando, FL 4.0 /10 severity
1.25" peak signal 6,483 mapped homes 1 ground report
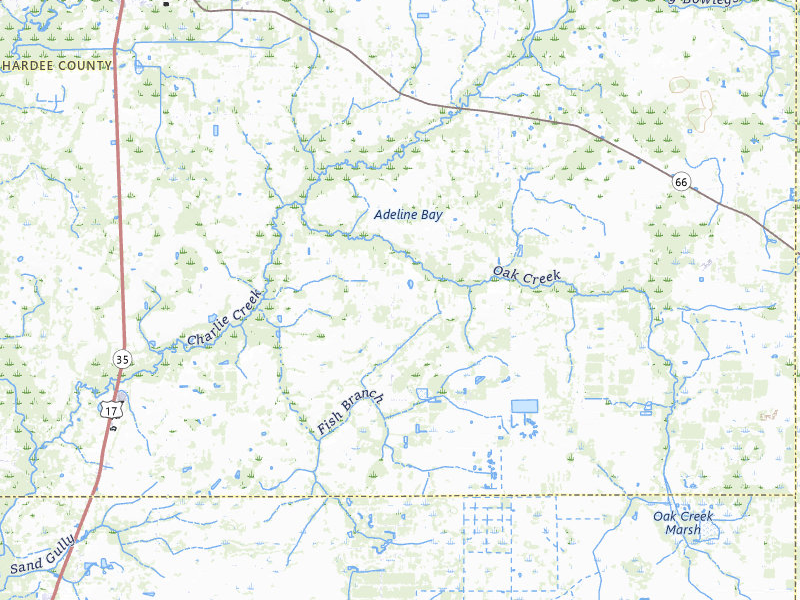
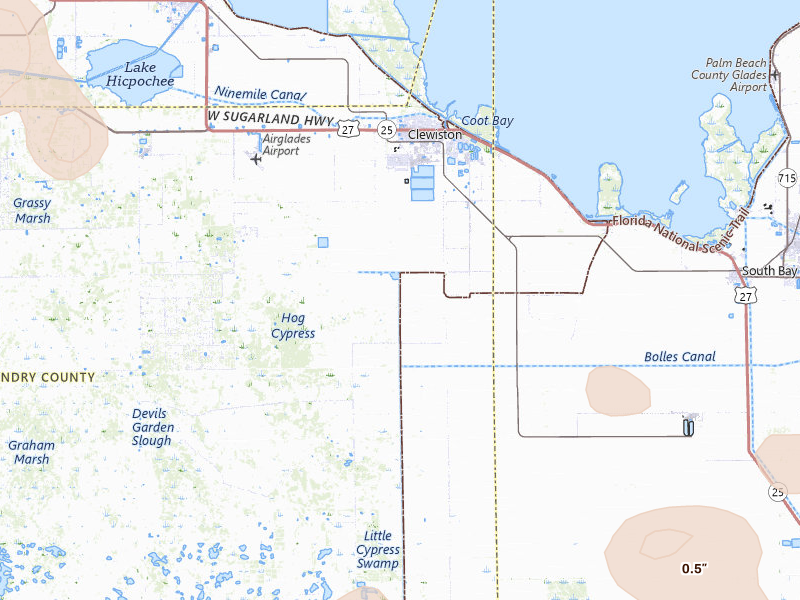
Clewiston, FL 3.7 /10 severity
1.75" peak signal 126 mapped homes No ground reports
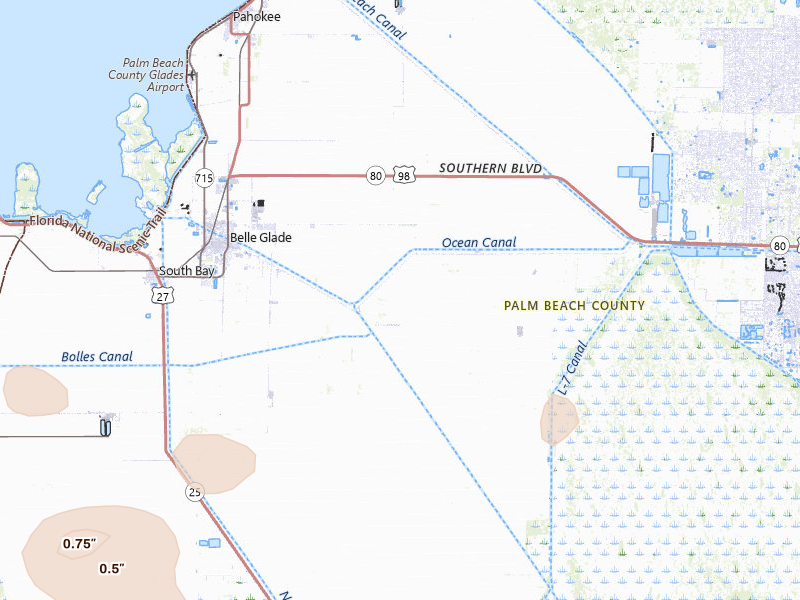
Sebring, FL 3.6 /10 severity
1.25" peak signal 2,690 mapped homes No ground reports
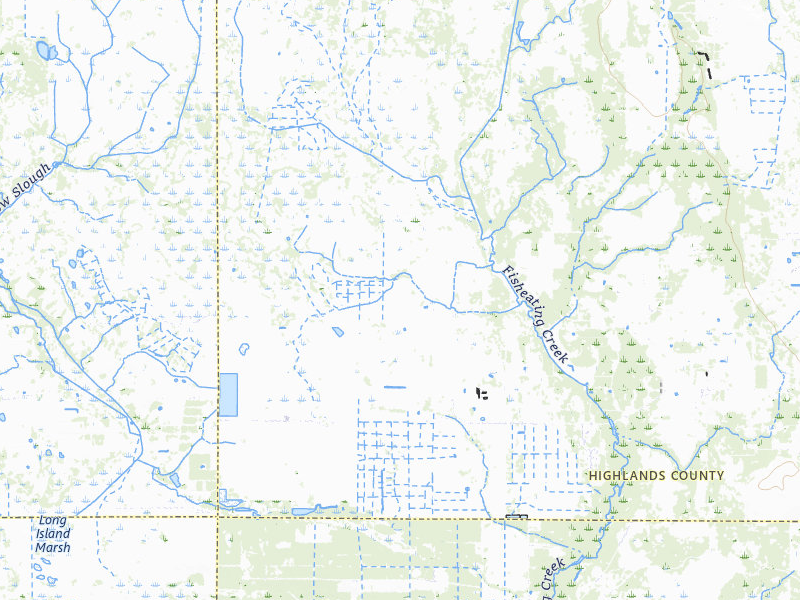
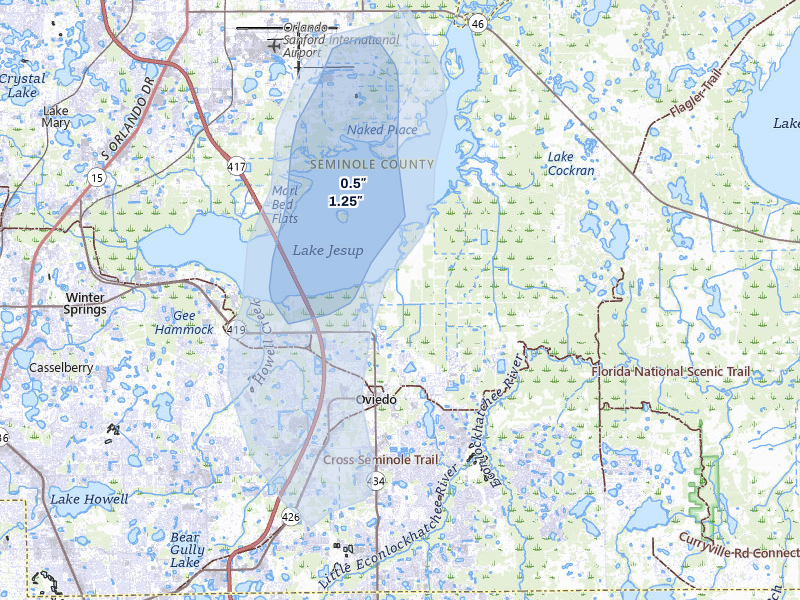
Oviedo, FL 3.4 /10 severity
1.25" peak signal 1,341 mapped homes No ground reports
Lehigh Acres, FL 3.3 /10 severity
1.75" peak signal 26 mapped homes No ground reports
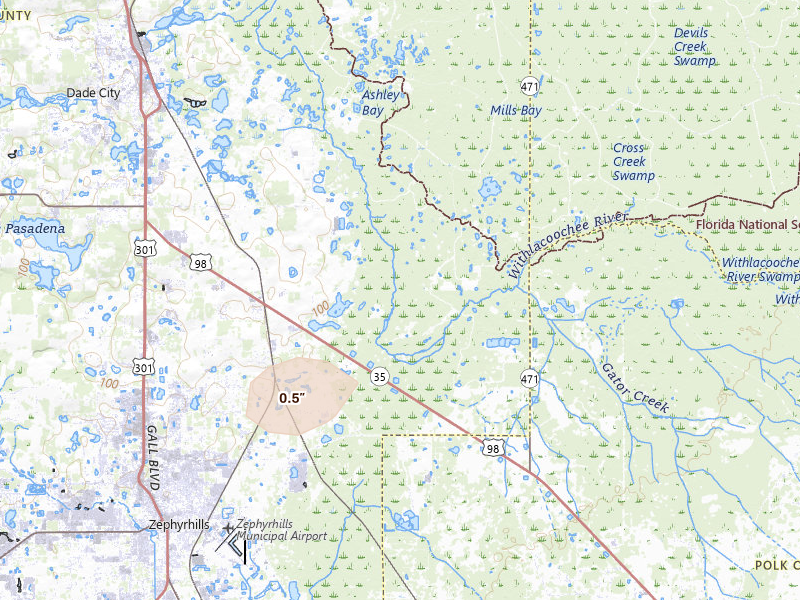
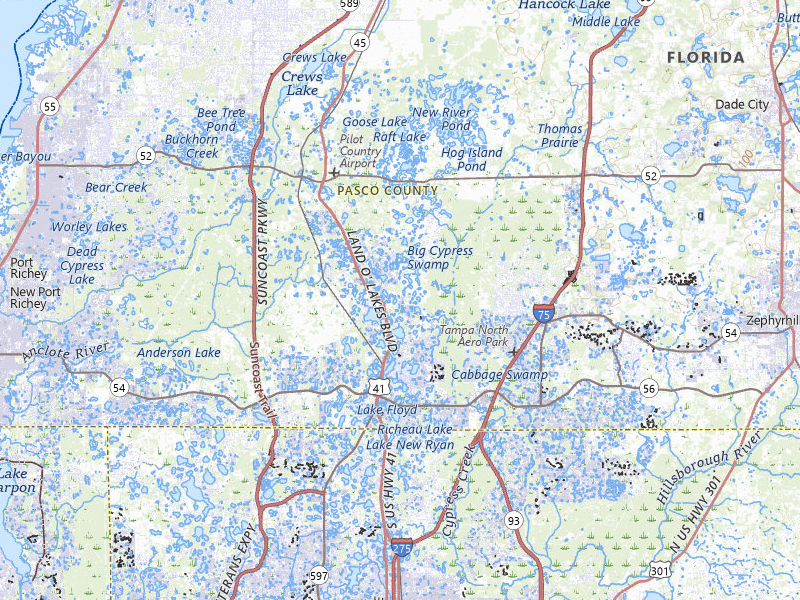
Dade City, FL 3.2 /10 severity
1" peak signal 2,119 mapped homes No ground reports
Moore Haven, FL 3.2 /10 severity
1.5" peak signal 98 mapped homes No ground reports
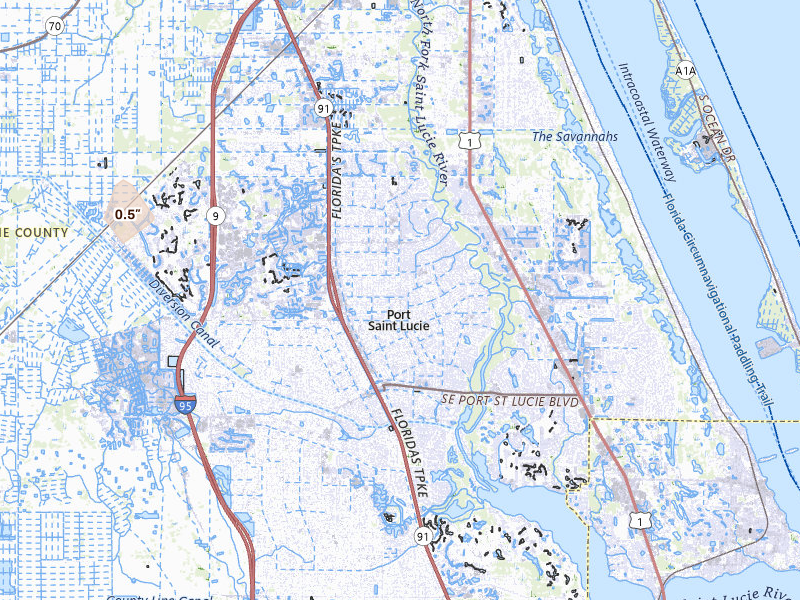
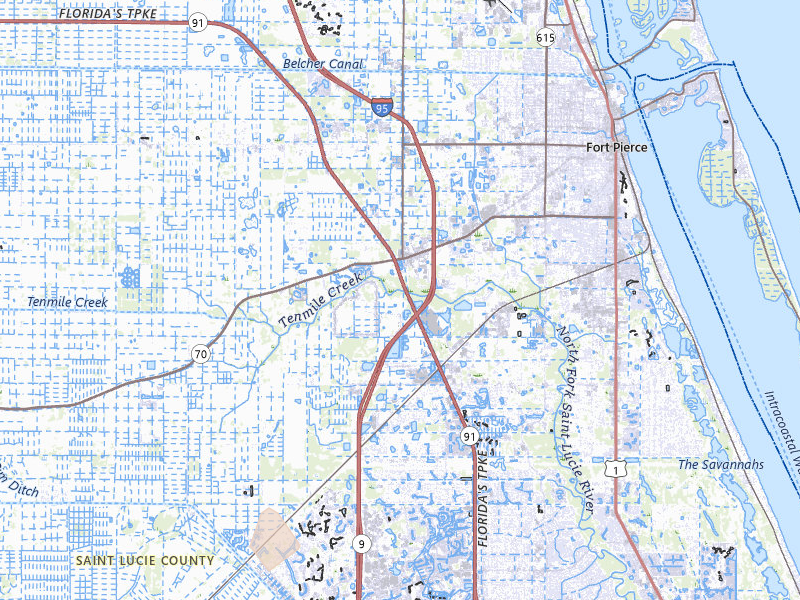
Port Saint Lucie, FL 3.2 /10 severity
1" peak signal 2,614 mapped homes No ground reports
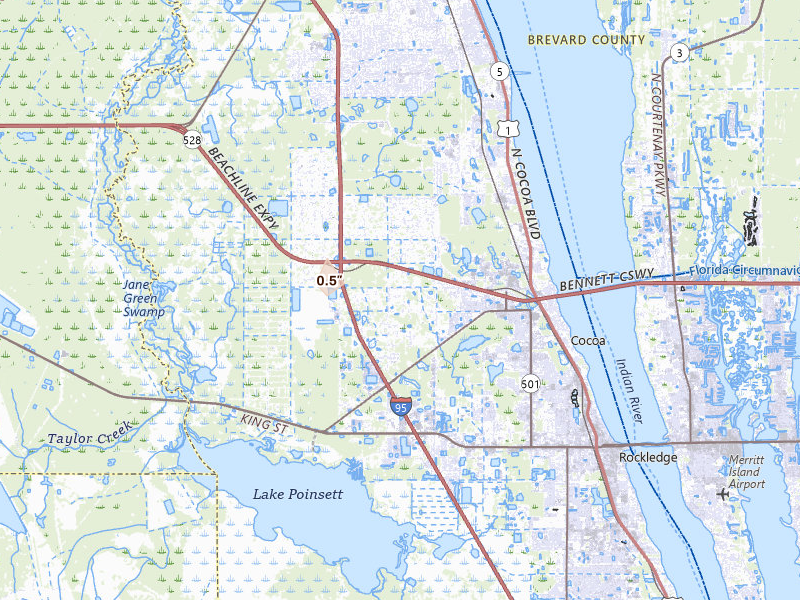
Cocoa, FL 3.0 /10 severity
1" peak signal 972 mapped homes No ground reports
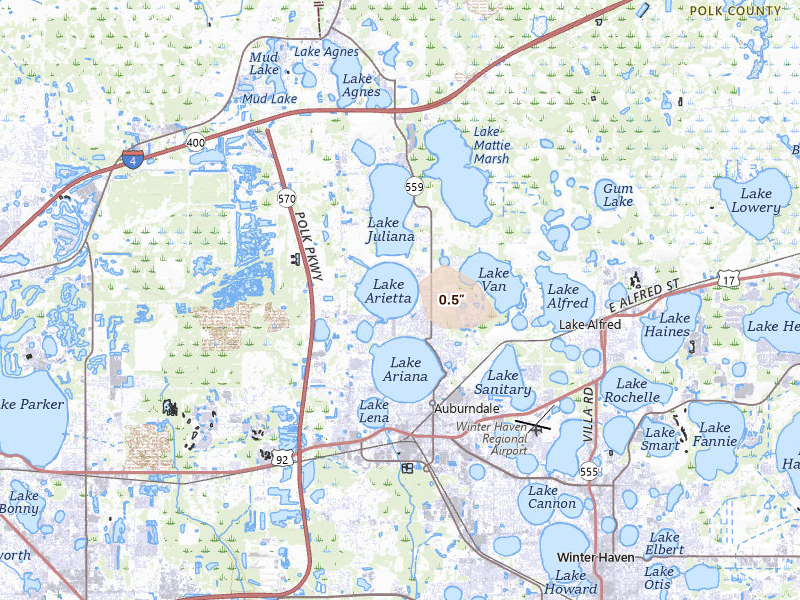
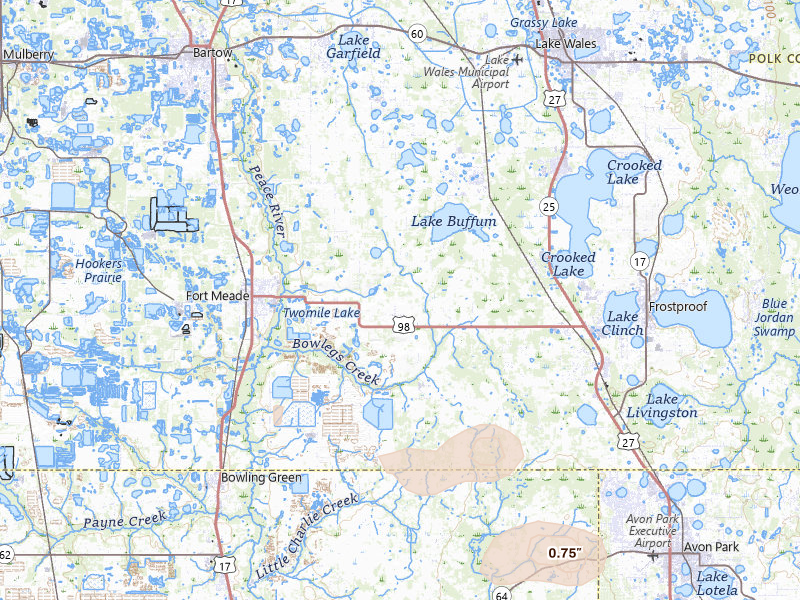
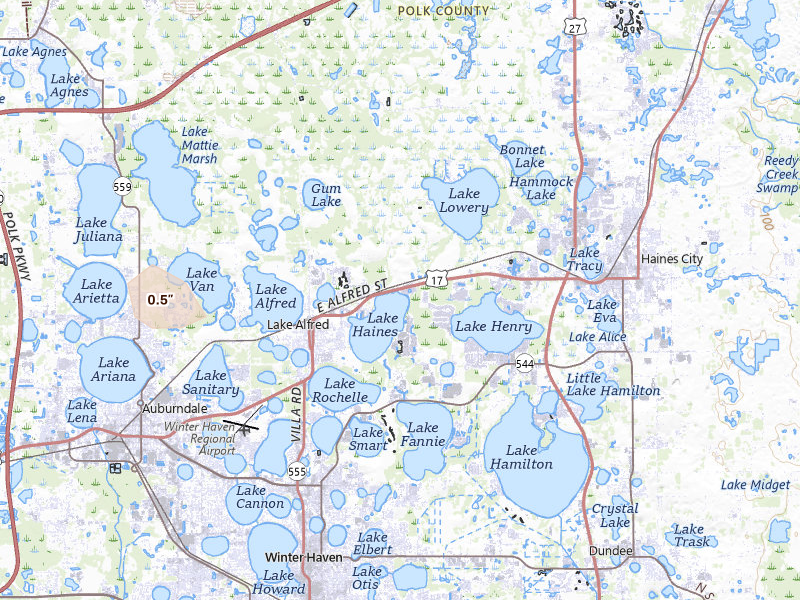
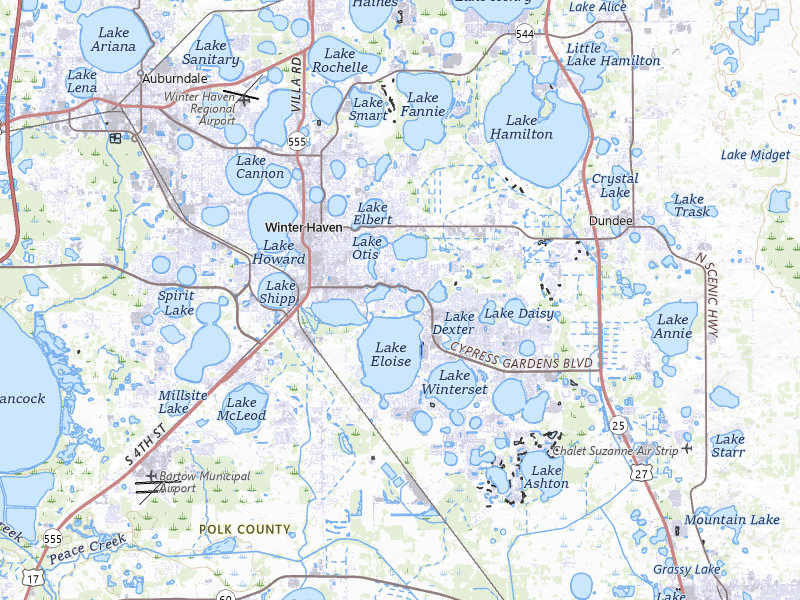
Auburndale, FL 2.9 /10 severity
1" peak signal 519 mapped homes No ground reports
Fort Meade, FL 2.9 /10 severity
1.25" peak signal 96 mapped homes No ground reports
Lake Alfred, FL 2.9 /10 severity
1" peak signal 519 mapped homes No ground reports
Winter Haven, FL 2.9 /10 severity
1" peak signal 519 mapped homes No ground reports
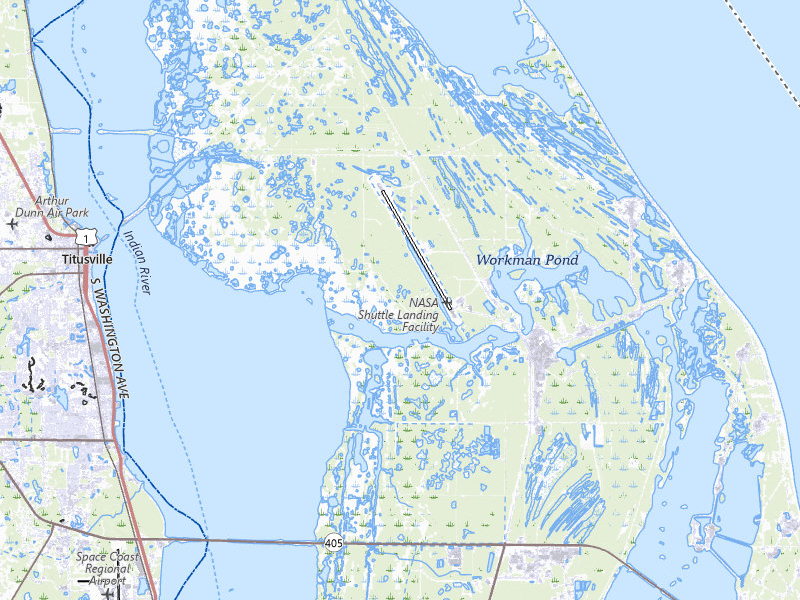
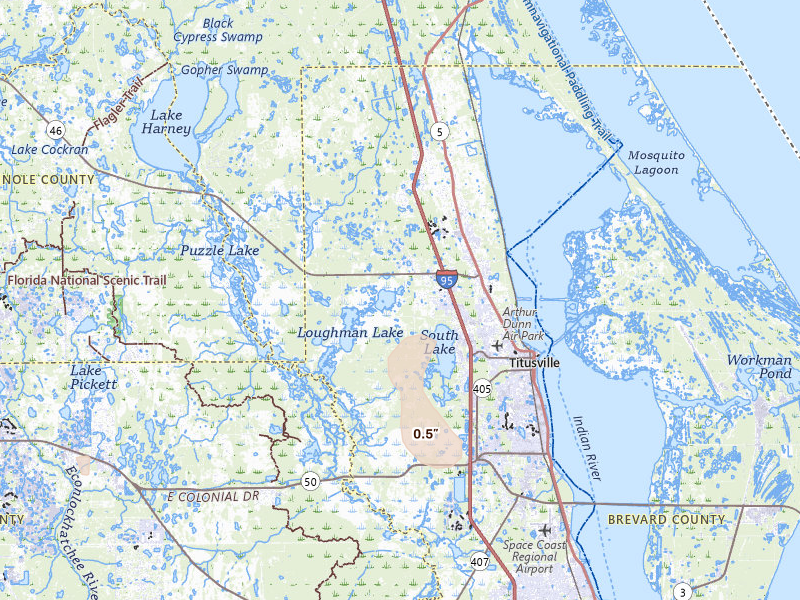
Titusville, FL 2.7 /10 severity
1.25" peak signal 36 mapped homes No ground reports
Mims, FL 2.6 /10 severity
1.25" peak signal 30 mapped homes No ground reports
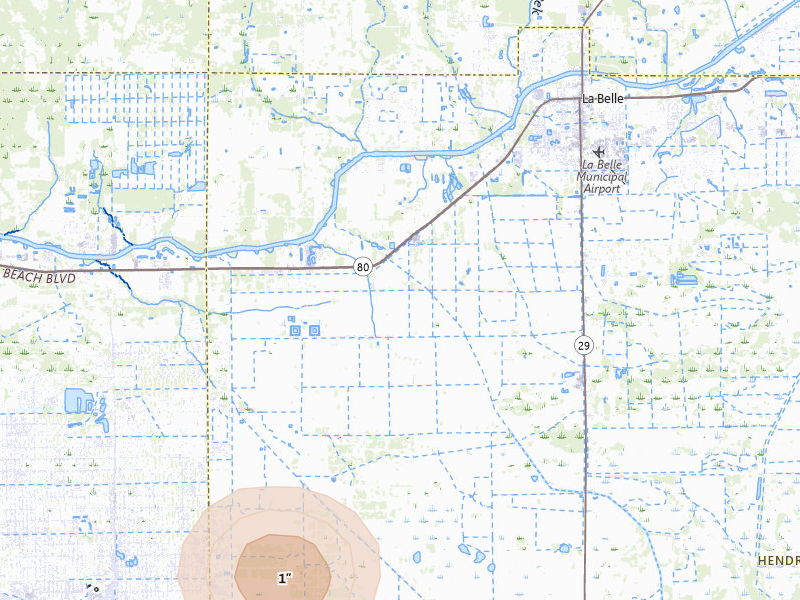
Labelle, FL 2.5 /10 severity
1" peak signal 86 mapped homes No ground reports
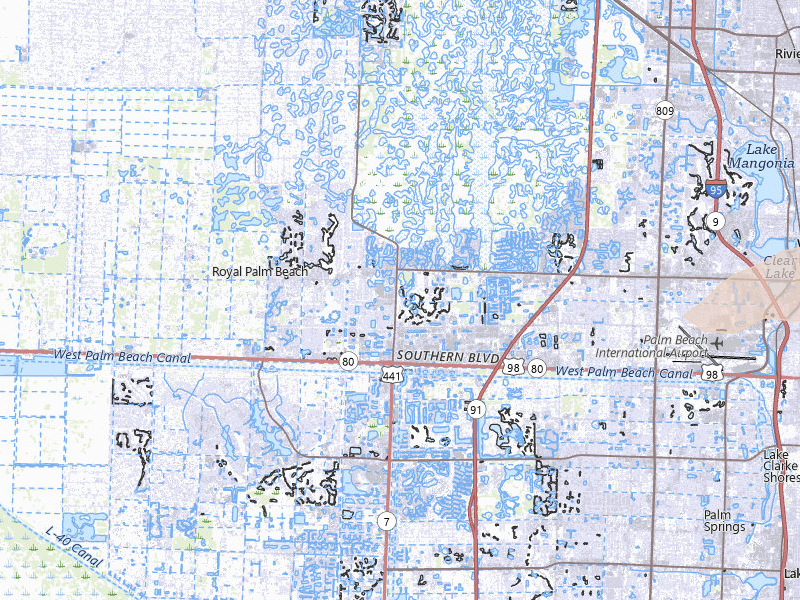
West Palm Beach, FL 2.5 /10 severity
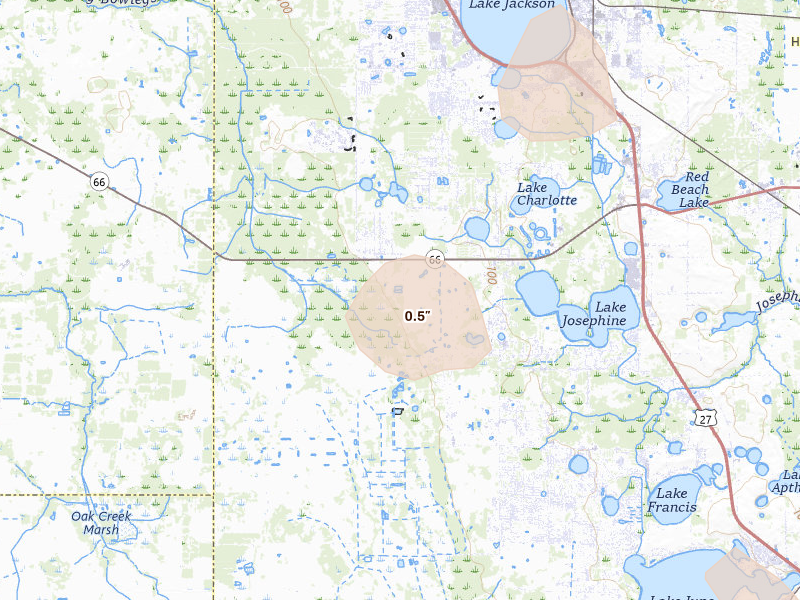
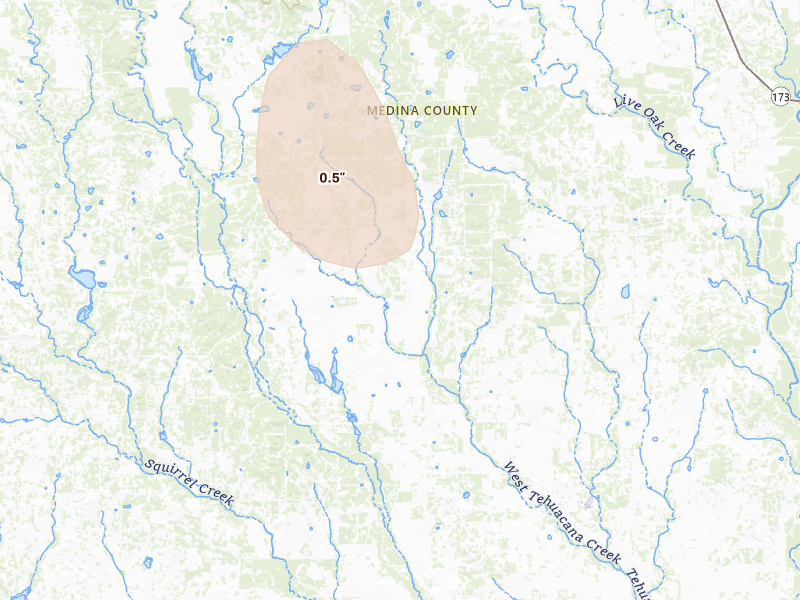
0.5" peak signal 3,616 mapped homes No ground reports
Indian Rocks Beach, FL 2.4 /10 severity
0.75" peak signal 439 mapped homes No ground reports
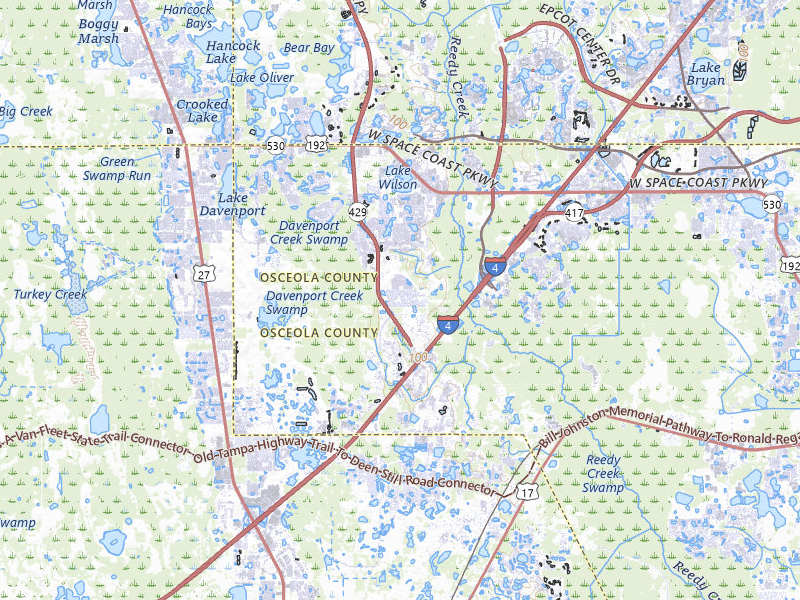
Kissimmee, FL 2.4 /10 severity
0.5" peak signal 1,983 mapped homes No ground reports
Land O Lakes, FL 2.3 /10 severity
0.5" peak signal 1,218 mapped homes No ground reports
Fort Pierce, FL 2.2 /10 severity
1.25" peak signal 4 mapped homes No ground reports
Lake Placid, FL 2.1 /10 severity
1" peak signal 17 mapped homes No ground reports
Lorida, FL 2.0 /10 severity
1.25" peak signal 1 mapped homes No ground reports
Christmas, FL 1.9 /10 severity
1" peak signal 6 mapped homes No ground reports
Frostproof, FL 1.4 /10 severity
0.75" peak signal 3 mapped homes No ground reports
Zolfo Springs, FL 1.4 /10 severity
0.75" peak signal 3 mapped homes No ground reports
Palm Beach, FL 1.1 /10 severity
0.75" peak signal 0 mapped homes No ground reports
Belle Glade, FL 0.9 /10 severity
0.5" peak signal 1 mapped homes No ground reports
Venus, FL 0.8 /10 severity
0.5" peak signal 0 mapped homes No ground reports

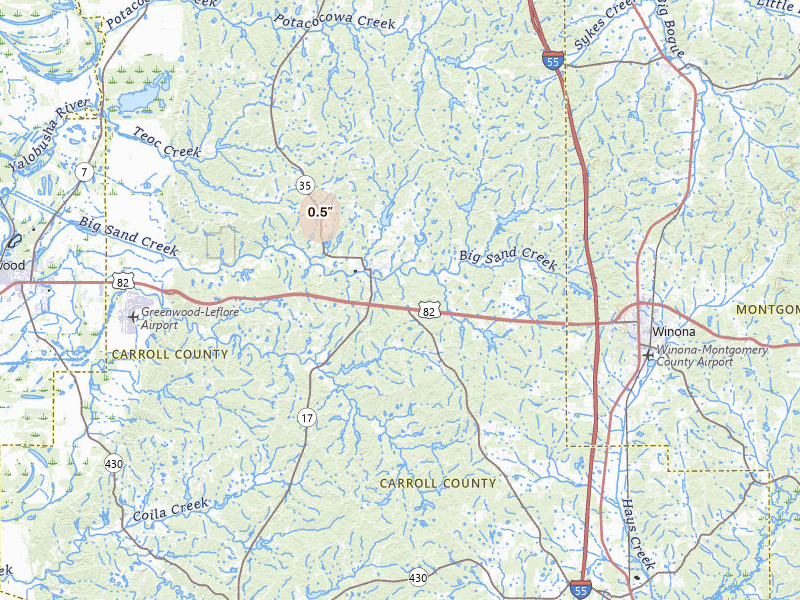
Mississippi

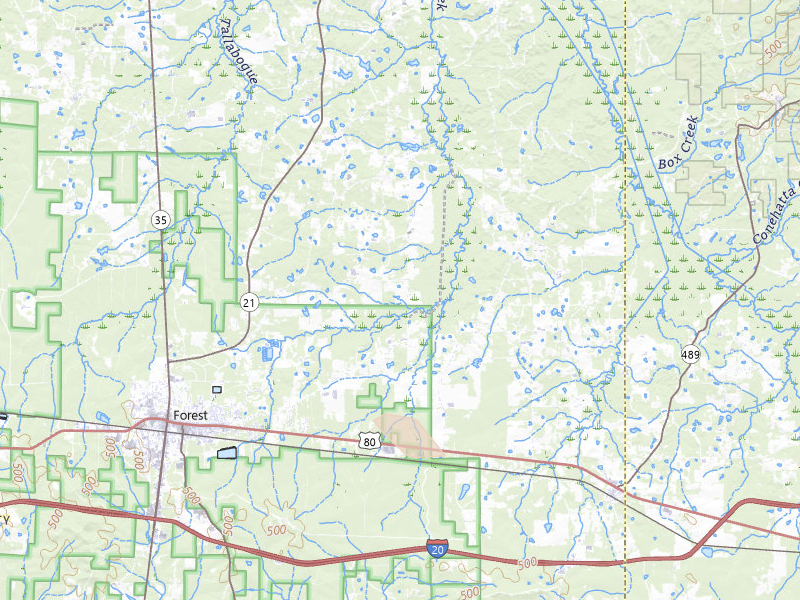
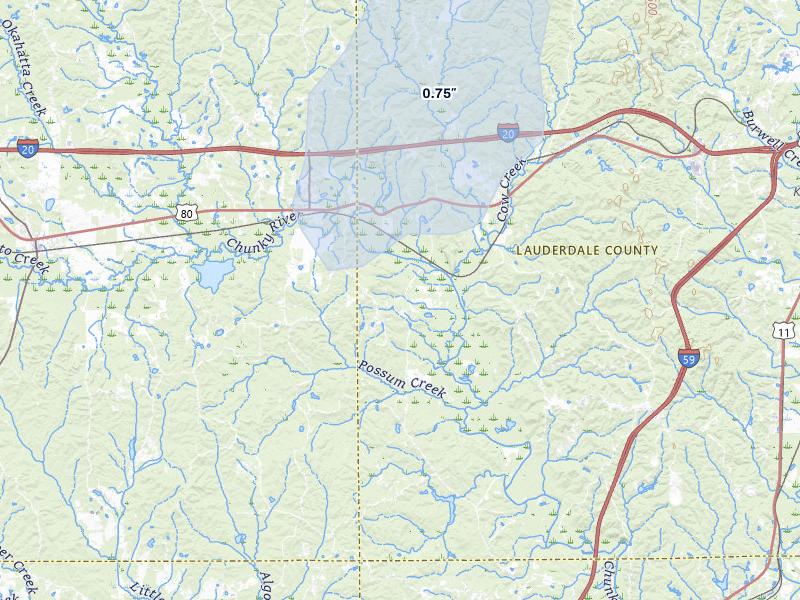
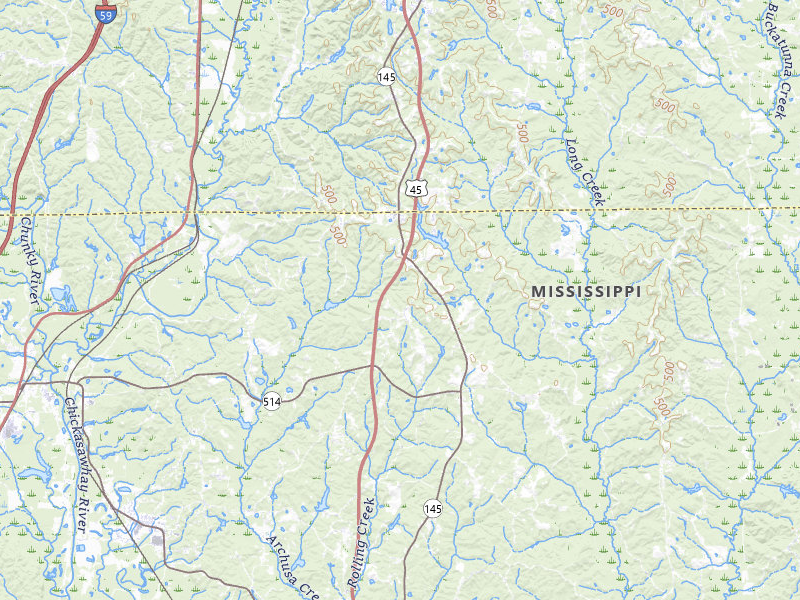
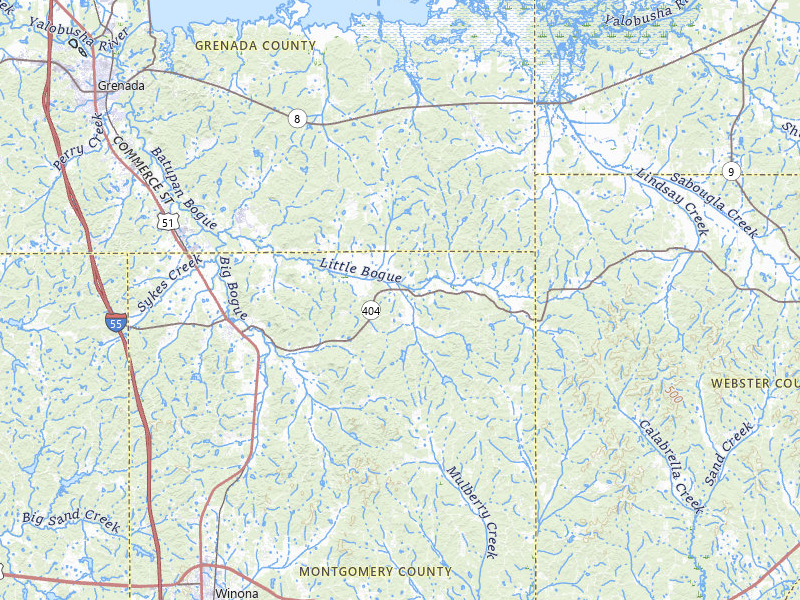
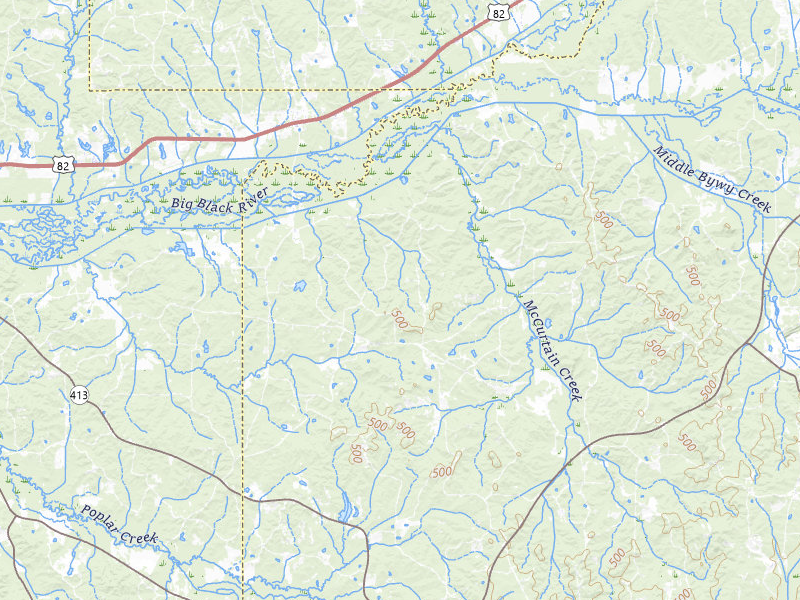
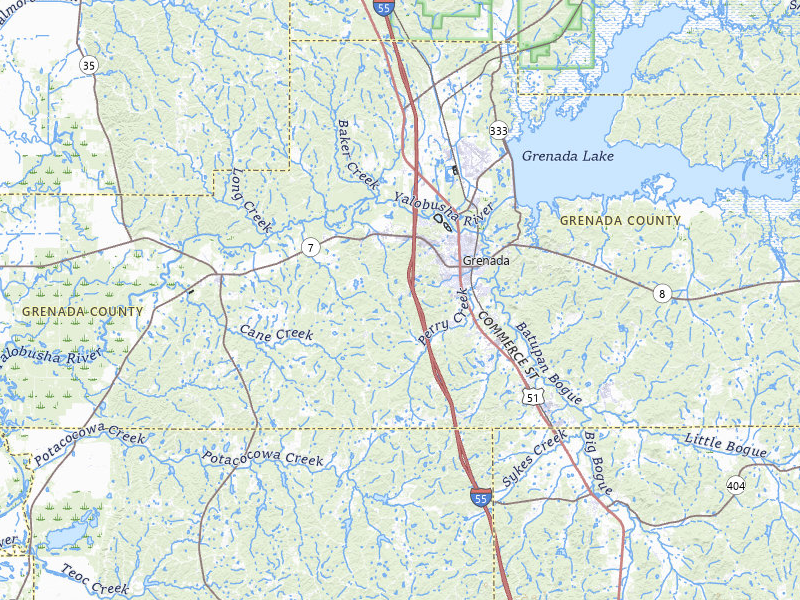
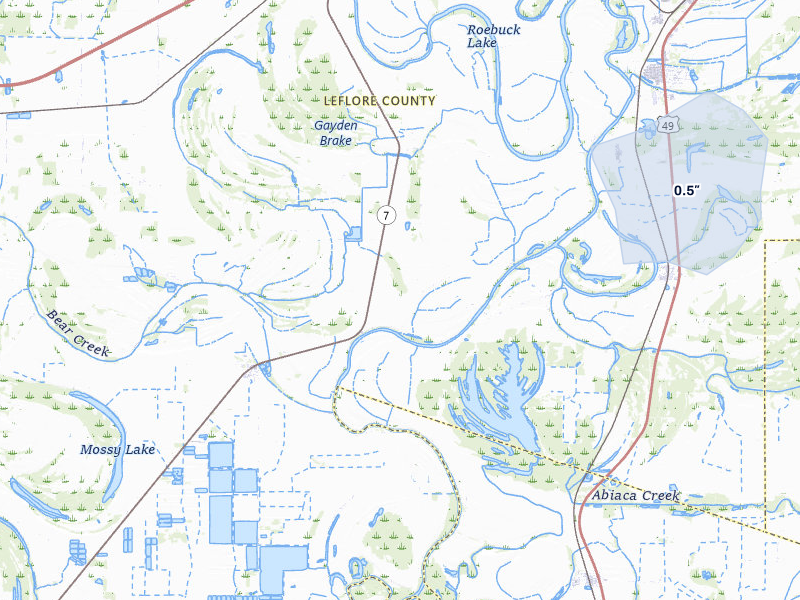
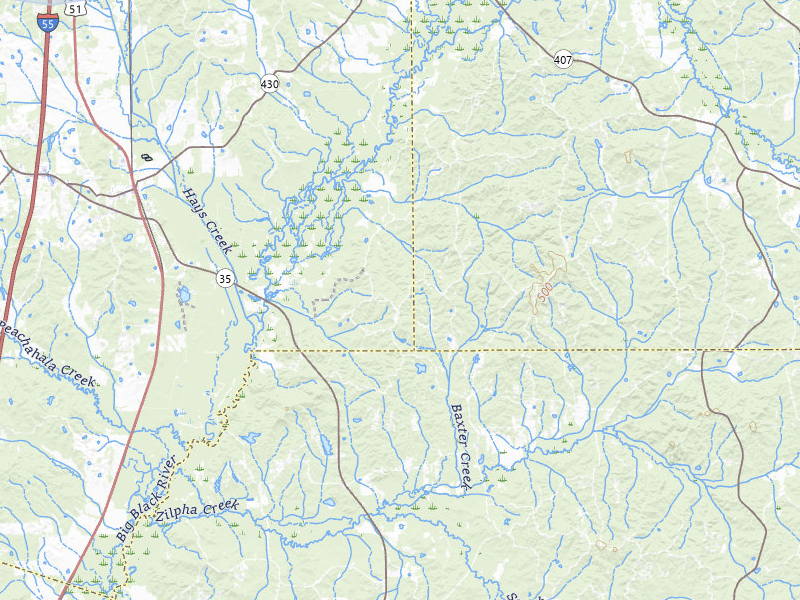
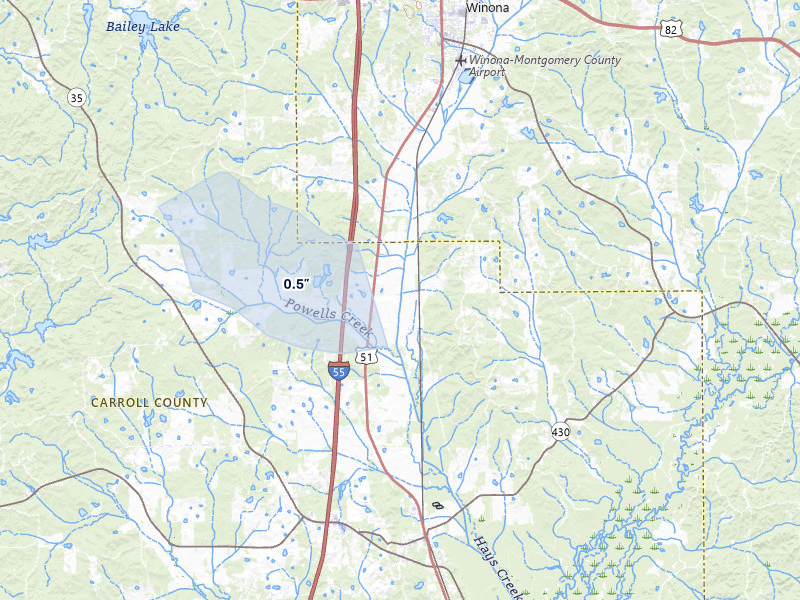
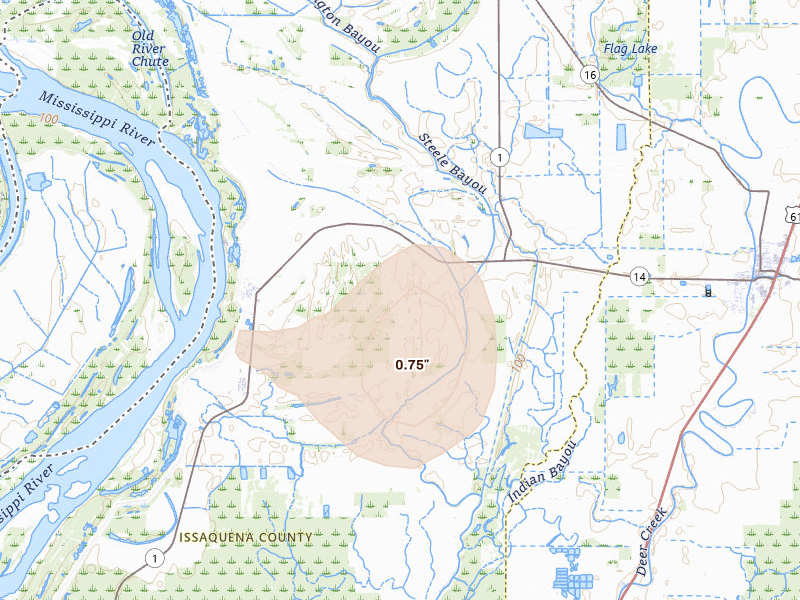
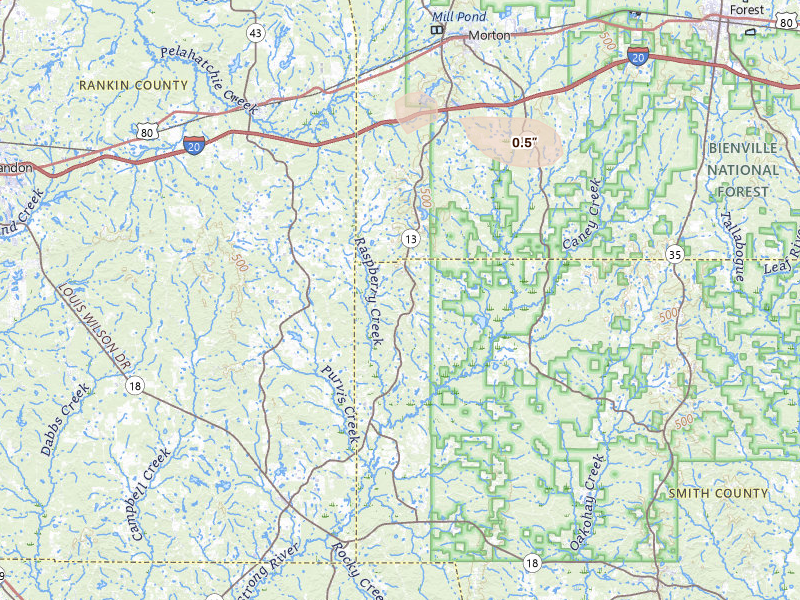
12 cities · up to 1.5" · 850 mapped homes
Texas

16 cities · up to 1.25" · 6,101 mapped homes
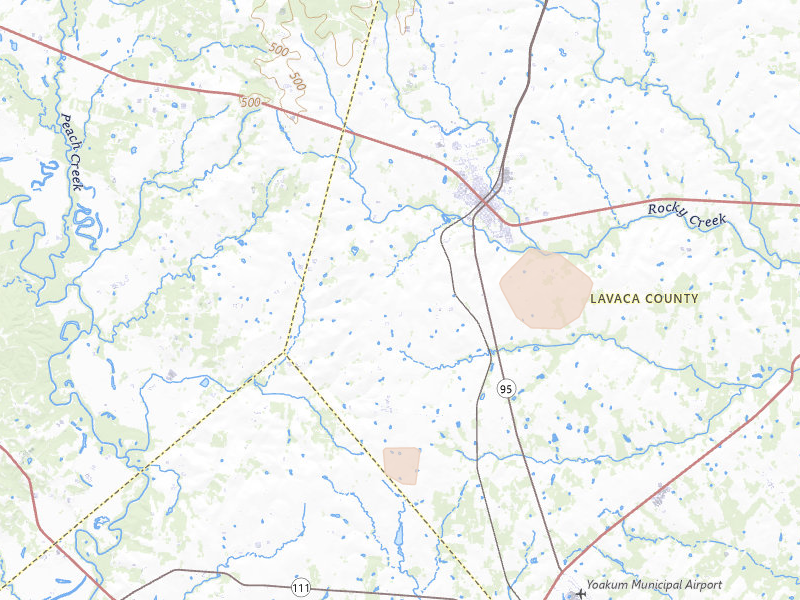
Shiner, TX 3.5 /10 severity
1.25" peak signal 1,823 mapped homes No ground reports
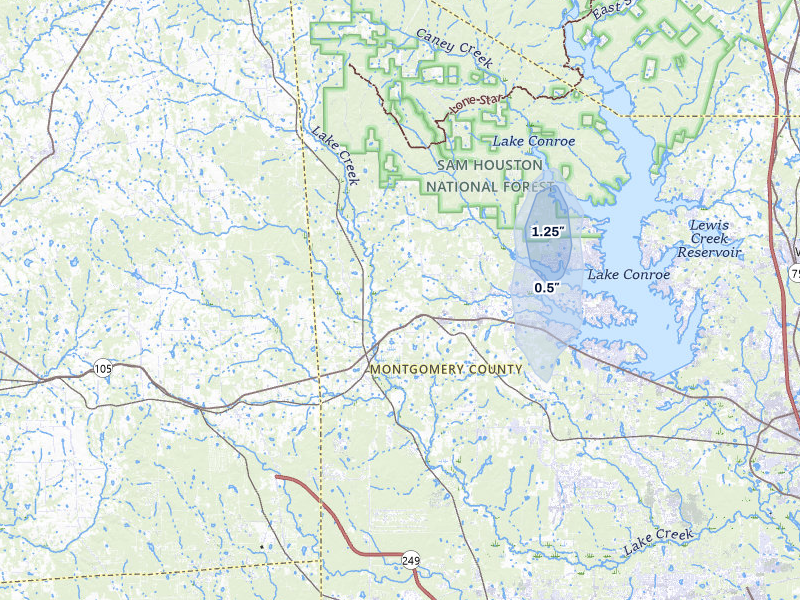
Montgomery, TX 3.4 /10 severity
1.25" peak signal 1,147 mapped homes No ground reports
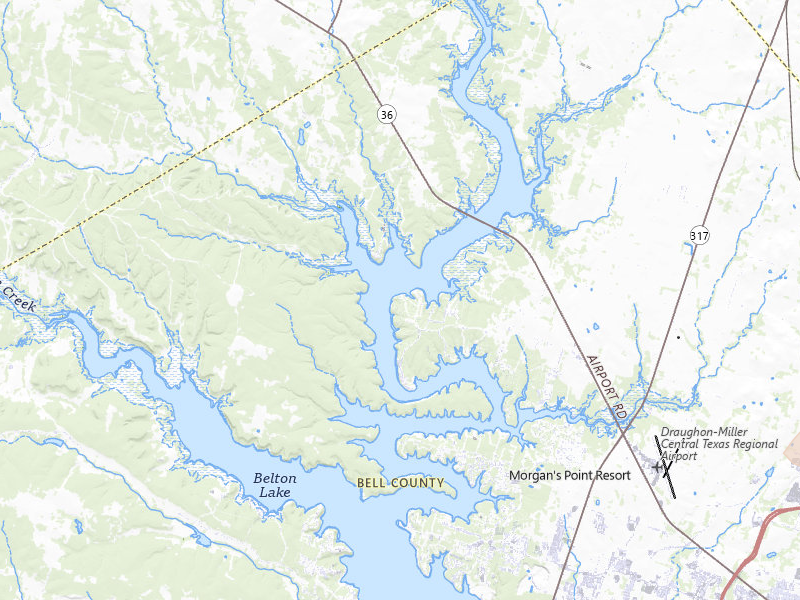
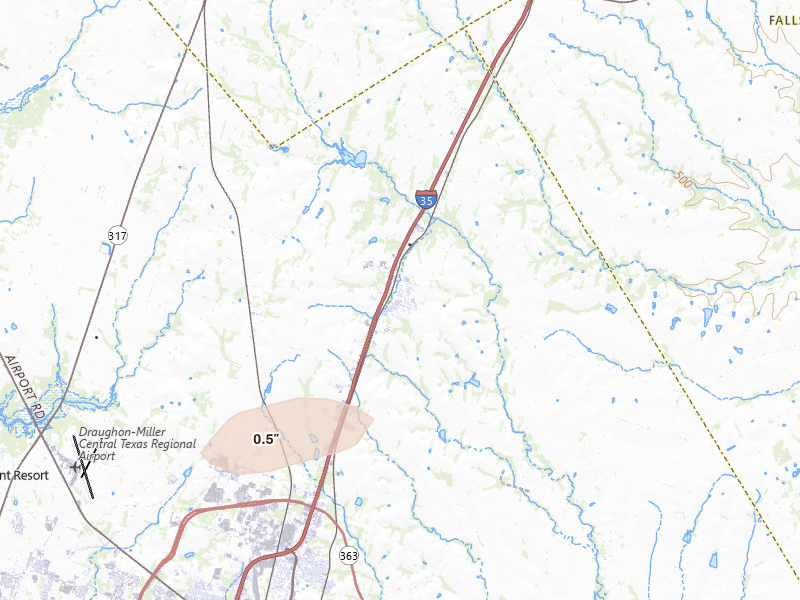
Temple, TX 3.1 /10 severity
1" peak signal 1,900 mapped homes No ground reports
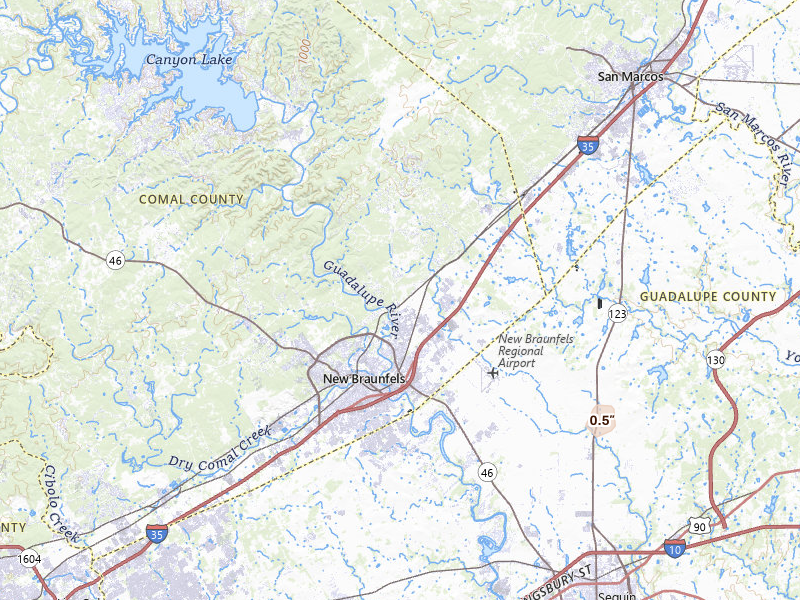
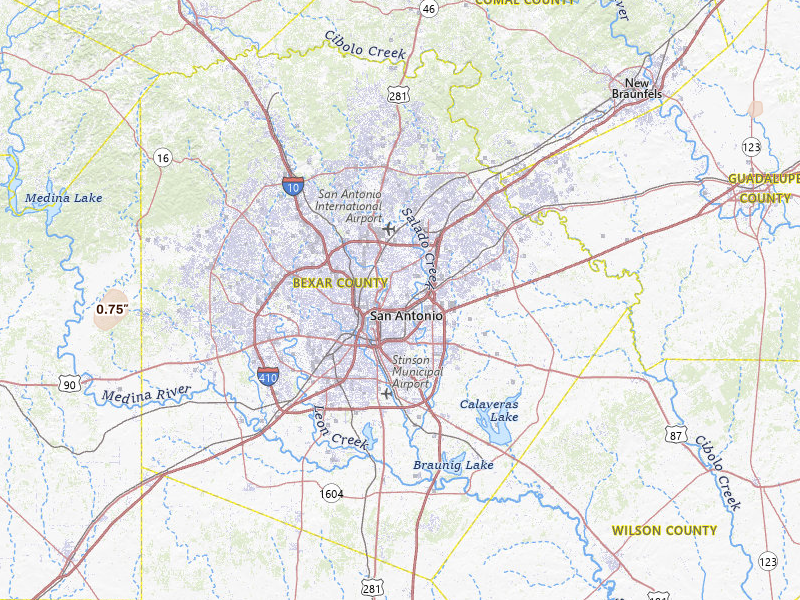
New Braunfels, TX 2.7 /10 severity
1" peak signal 256 mapped homes No ground reports
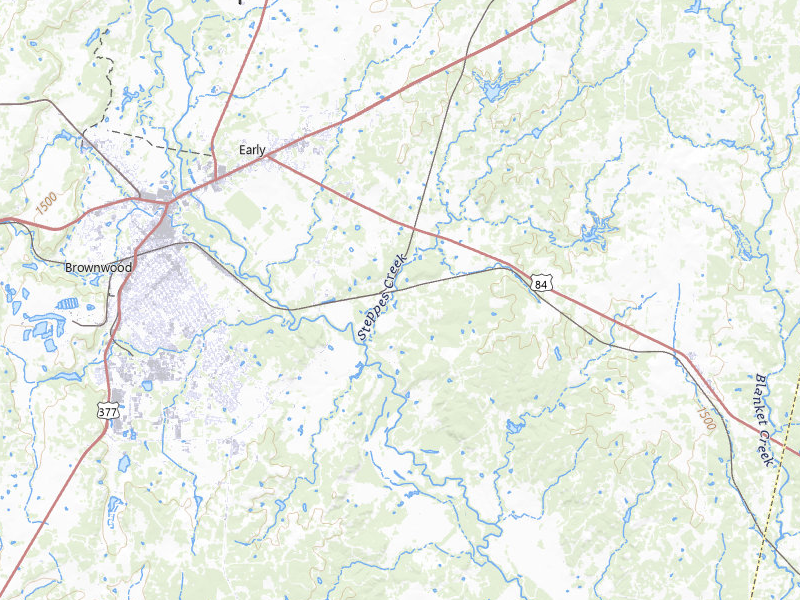
Early, TX 2.6 /10 severity
1" peak signal 150 mapped homes No ground reports
Troy, TX 2.6 /10 severity
1" peak signal 152 mapped homes No ground reports
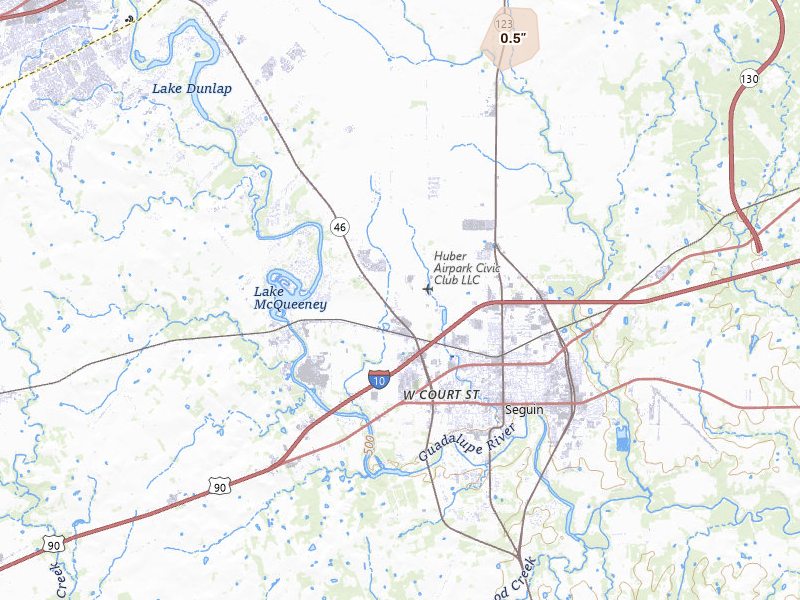
Seguin, TX 2.5 /10 severity
1" peak signal 116 mapped homes No ground reports
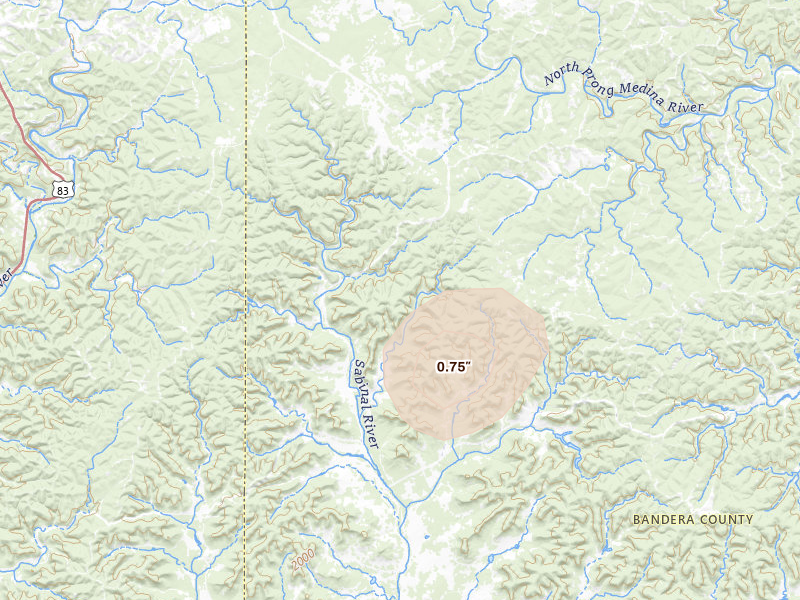
San Antonio, TX 2.3 /10 severity
0.75" peak signal 265 mapped homes No ground reports
Moody, TX 2.1 /10 severity
0.75" peak signal 86 mapped homes No ground reports
Yorktown, TX 2.0 /10 severity
0.75" peak signal 59 mapped homes No ground reports
Vanderpool, TX 1.9 /10 severity
0.75" peak signal 40 mapped homes No ground reports
Yancey, TX 1.6 /10 severity
0.5" peak signal 55 mapped homes No ground reports
Alleyton, TX 1.4 /10 severity
0.5" peak signal 23 mapped homes No ground reports
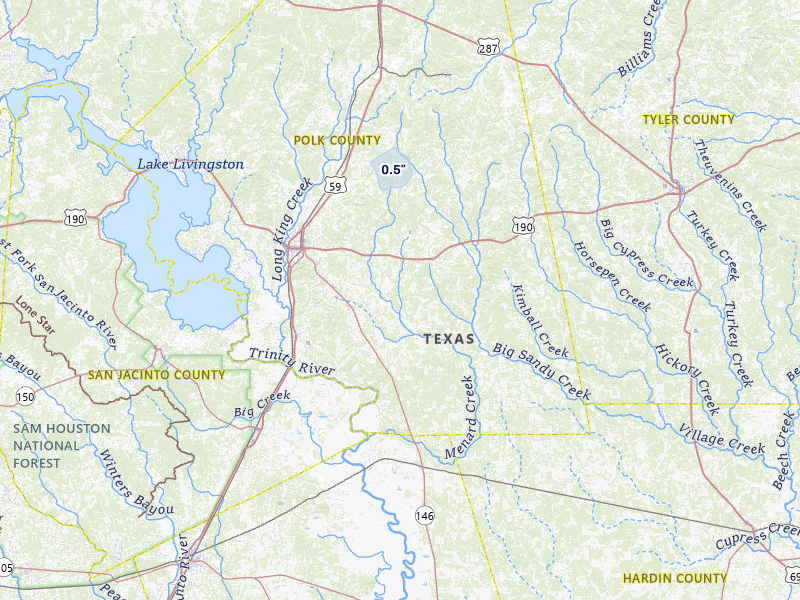
Livingston, TX 1.4 /10 severity
0.5" peak signal 22 mapped homes No ground reports
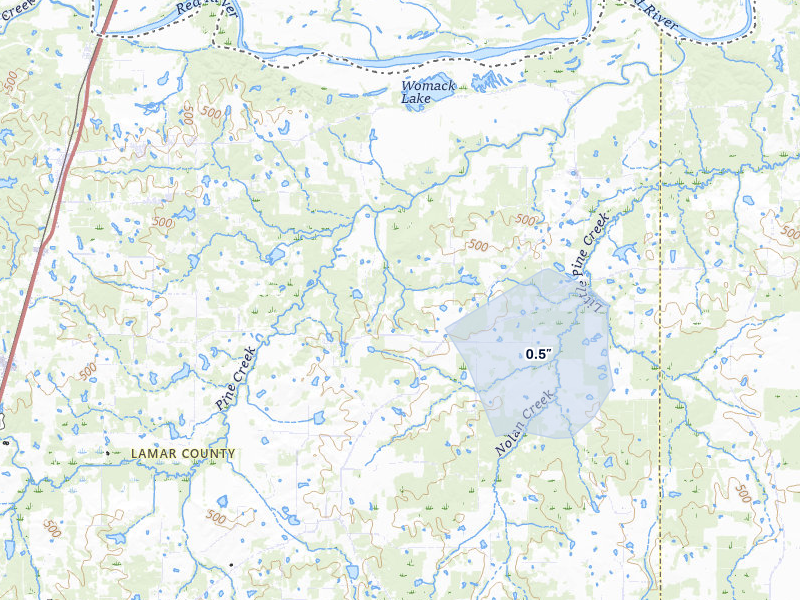
Paris, TX 1.2 /10 severity
0.5" peak signal 6 mapped homes No ground reports
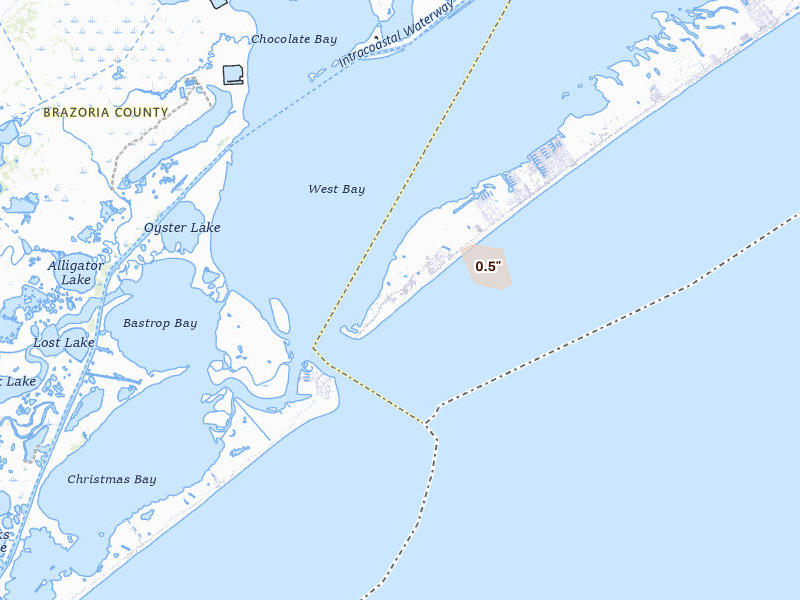
Galveston, TX 0.9 /10 severity
0.5" peak signal 1 mapped homes No ground reports

Georgia

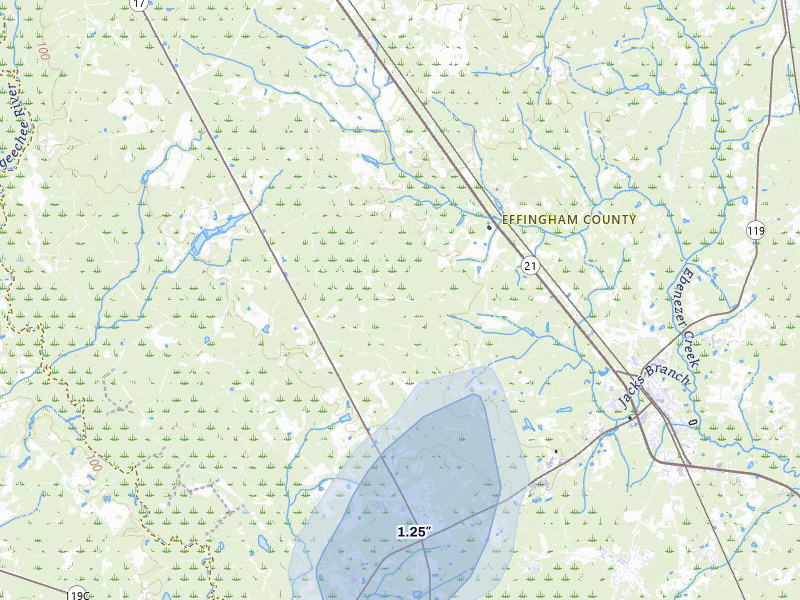
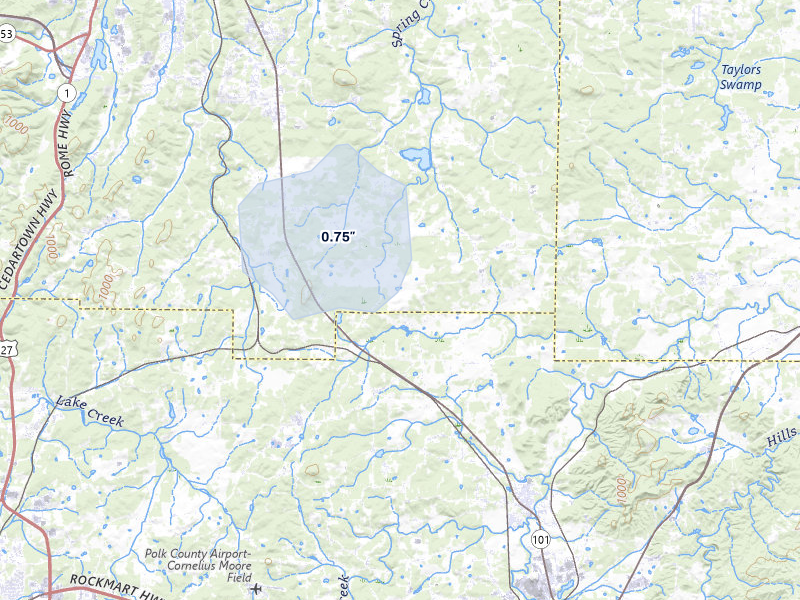
3 cities · up to 1.25" · 1,604 mapped homes
Arizona

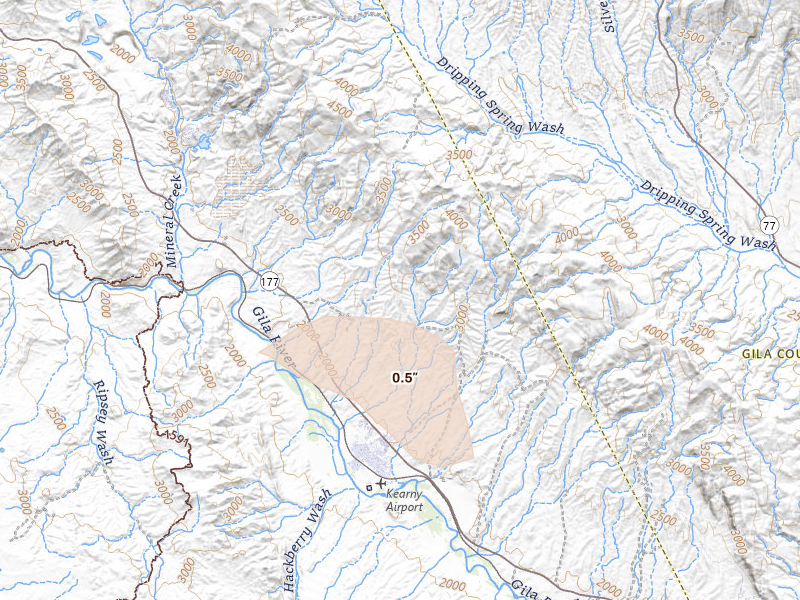
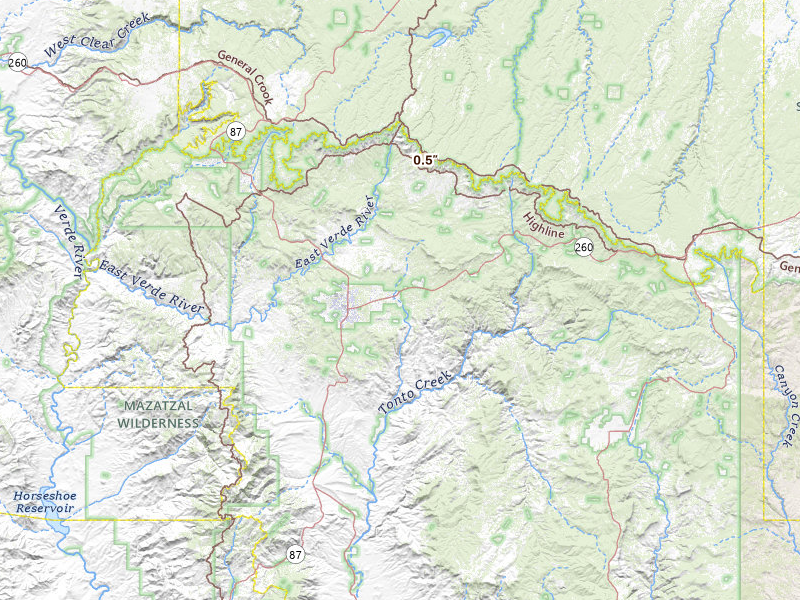
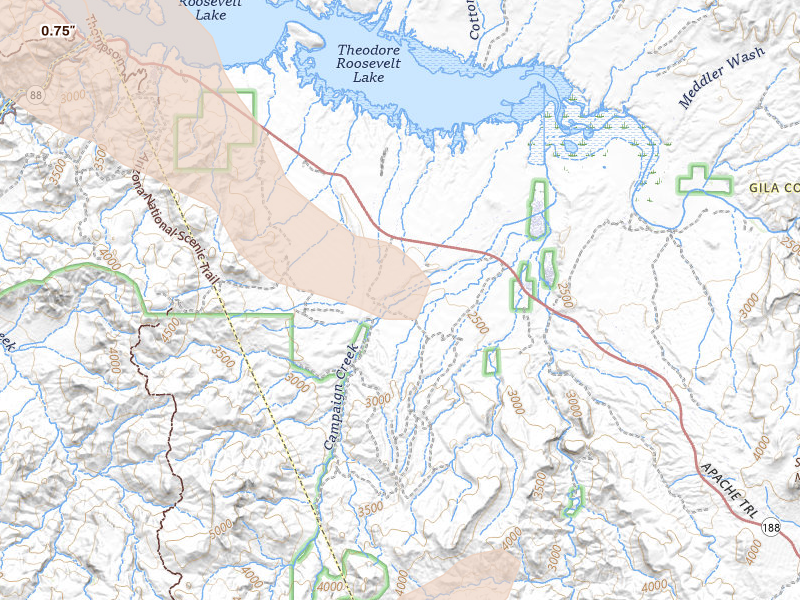
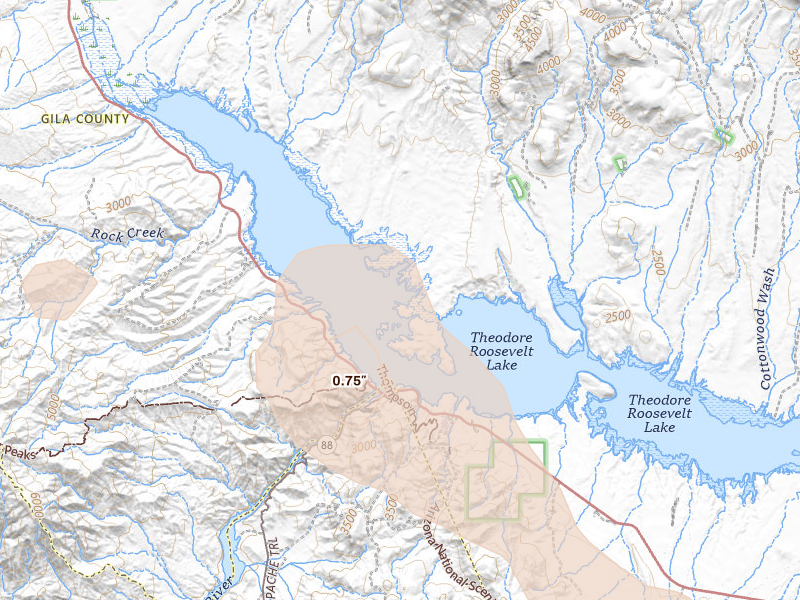
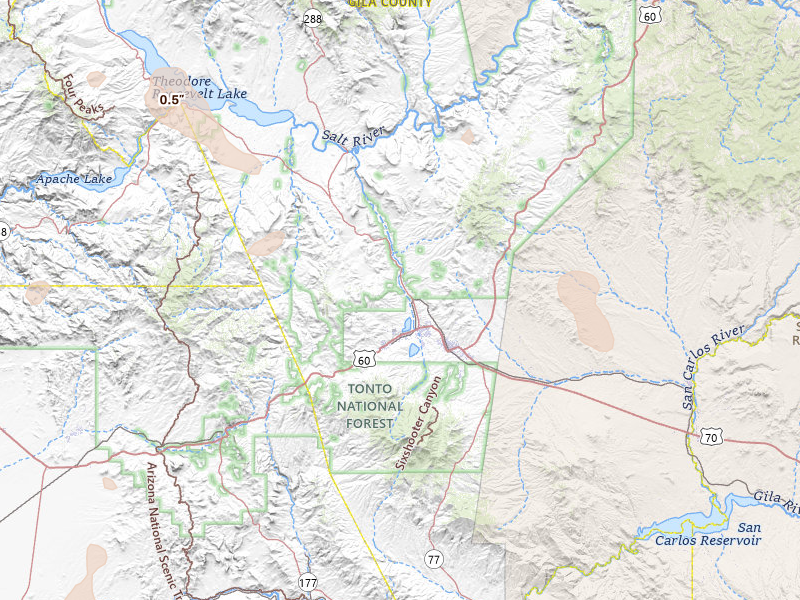
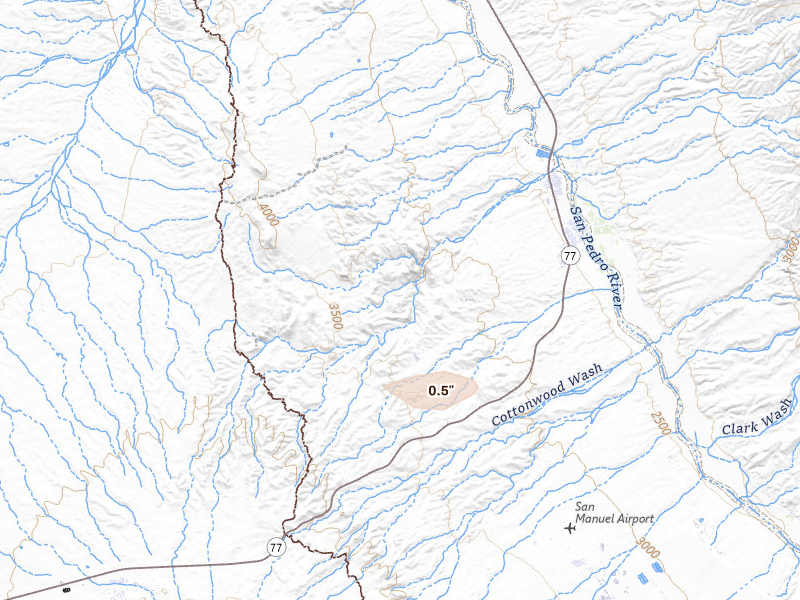
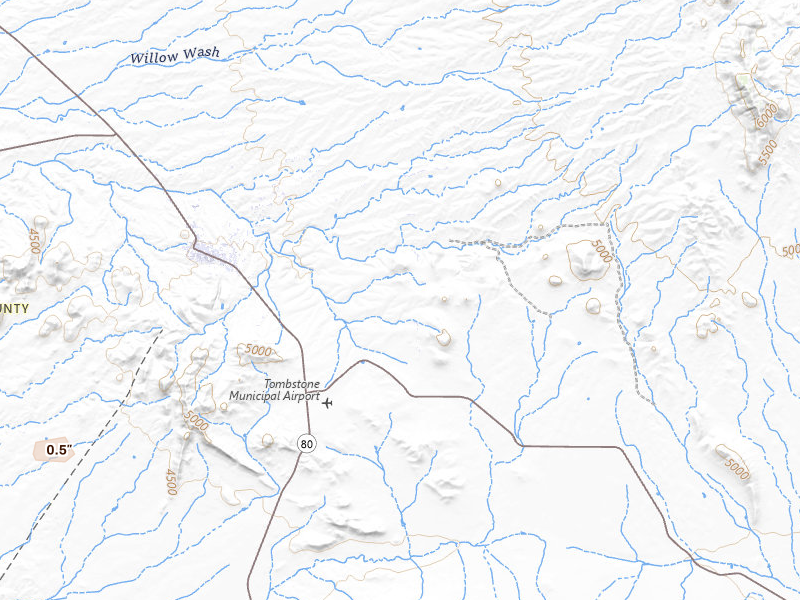
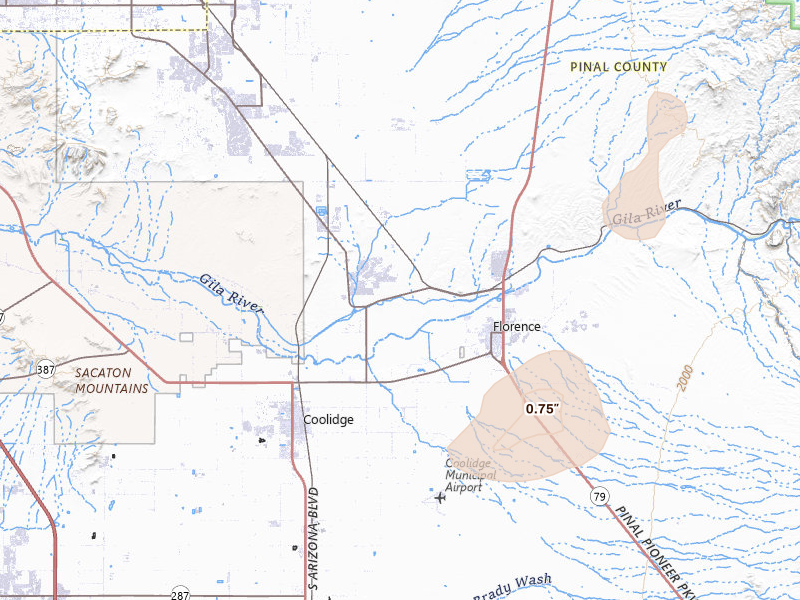
10 cities · up to 1.25" · 1,601 mapped homes
Oklahoma

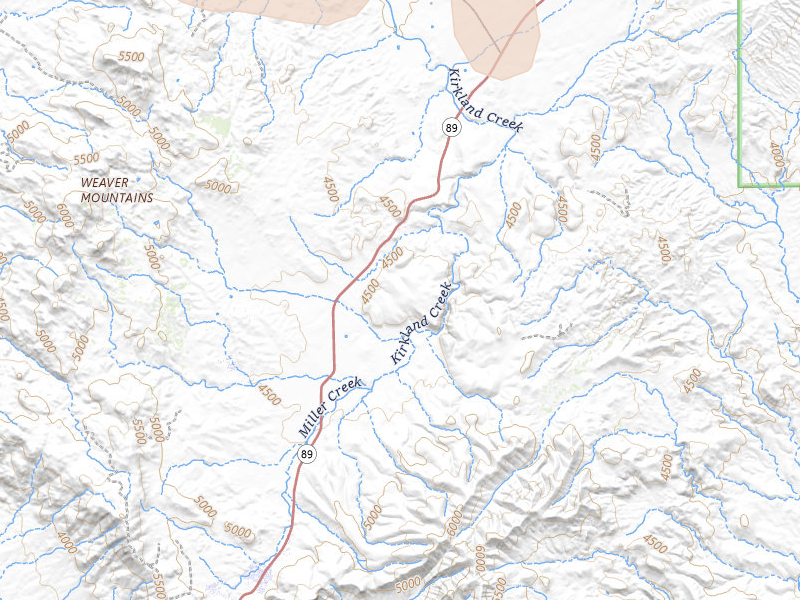
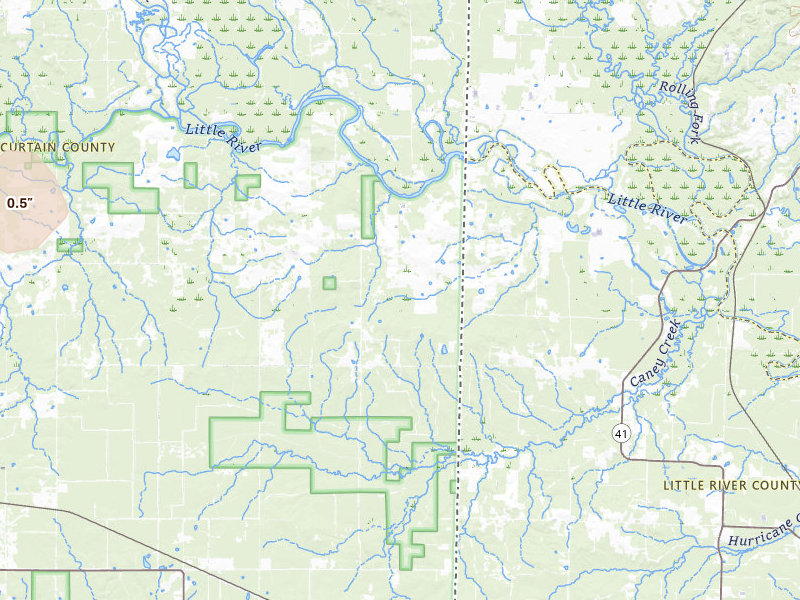
5 cities · up to 1" · 386 mapped homes
Alabama

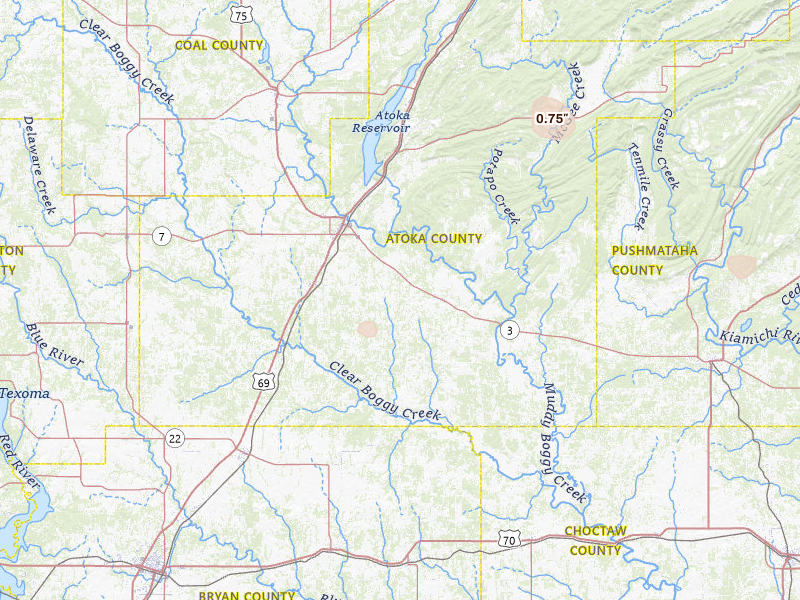
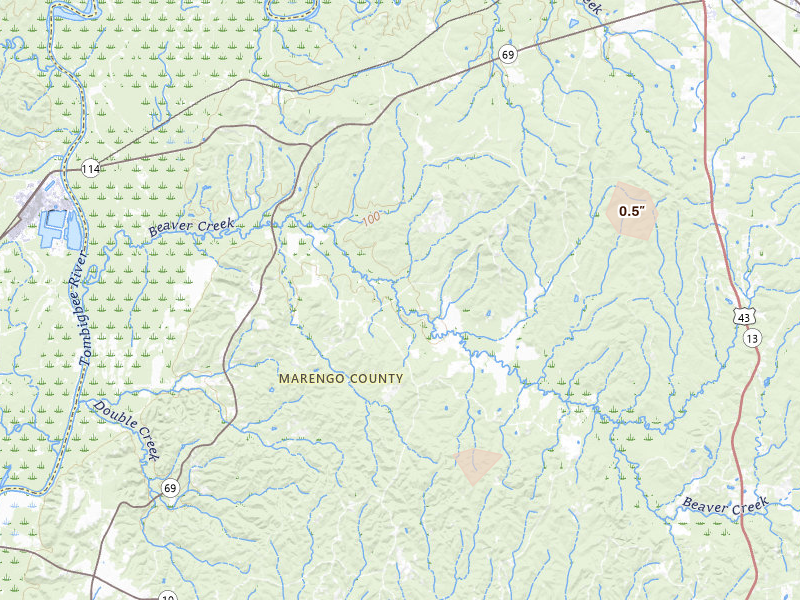
2 cities · up to 1" · 22 mapped homes
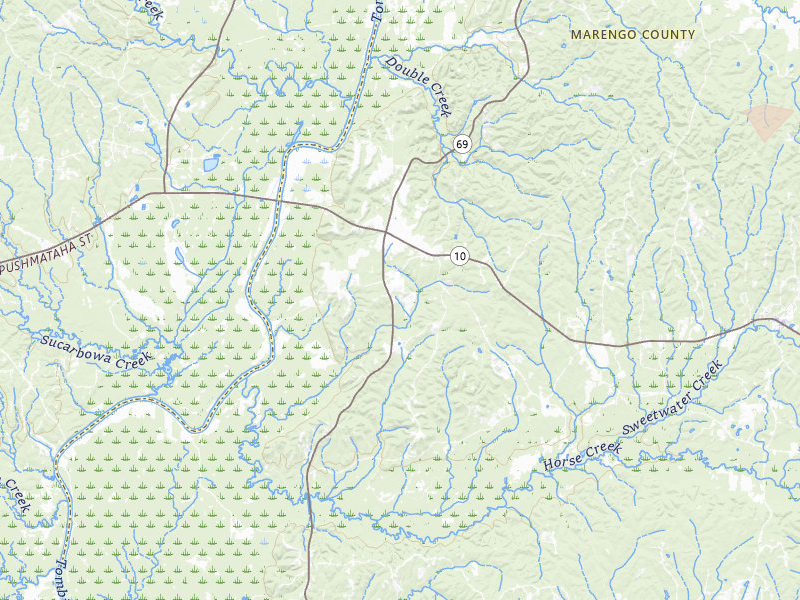
Kentucky

1 city · up to 0.75" · 89 mapped homes
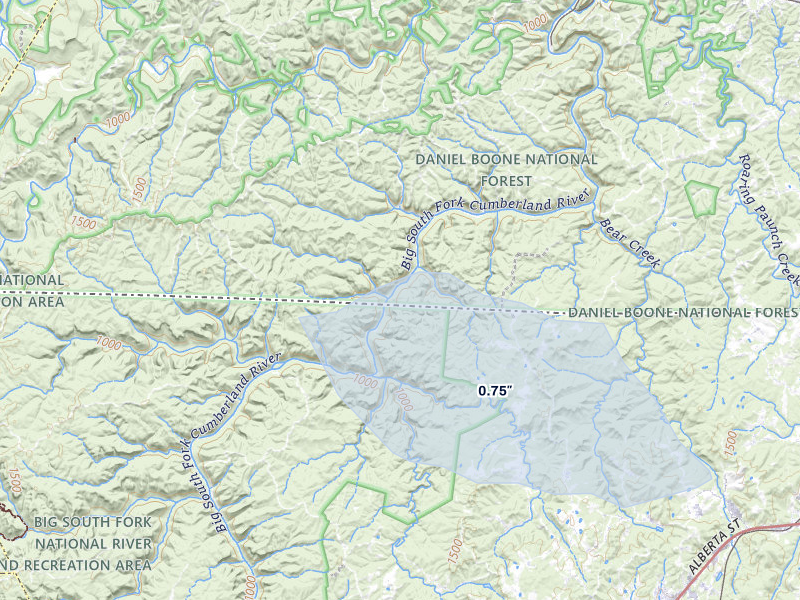
Tennessee

1 city · up to 0.75" · 89 mapped homes

South Carolina

2 cities · up to 0.75" · 75 mapped homes
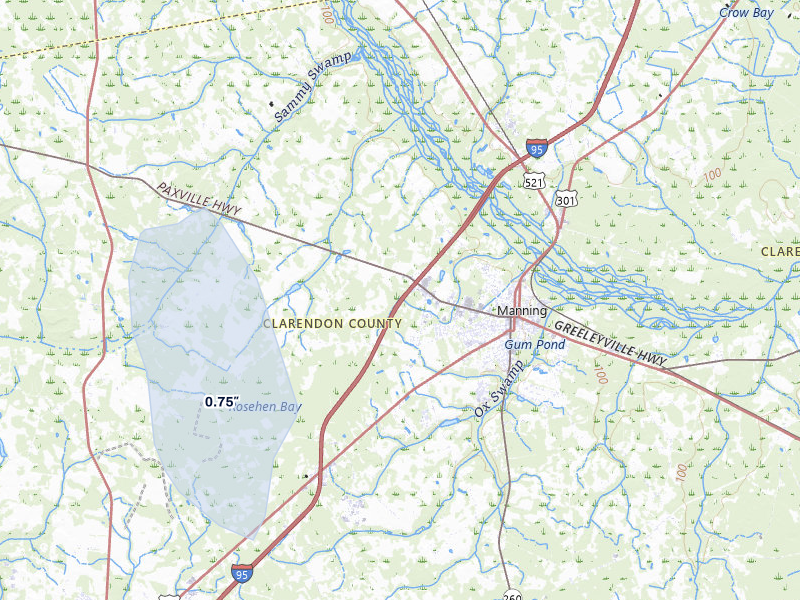
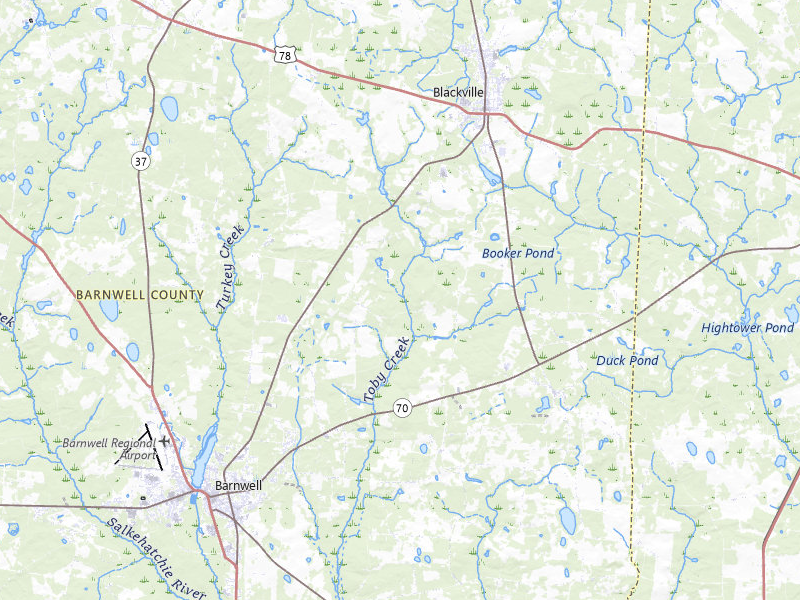
North Dakota

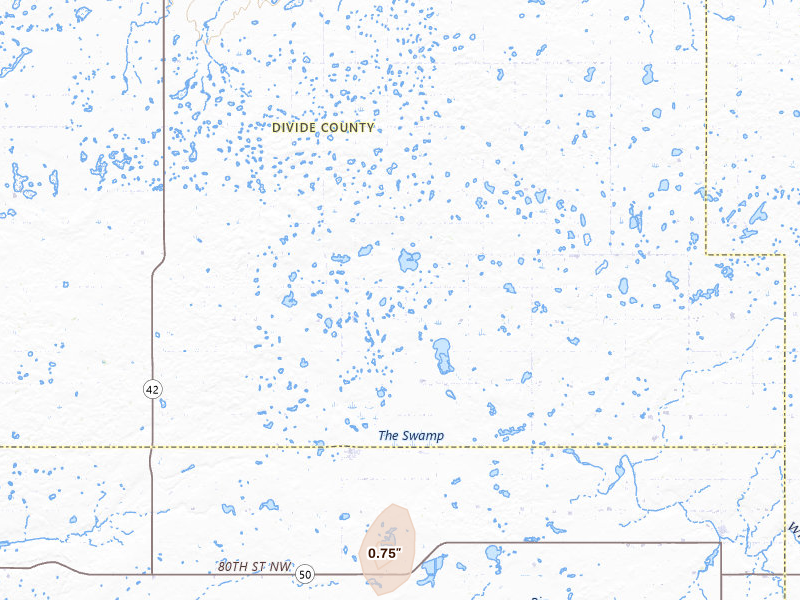
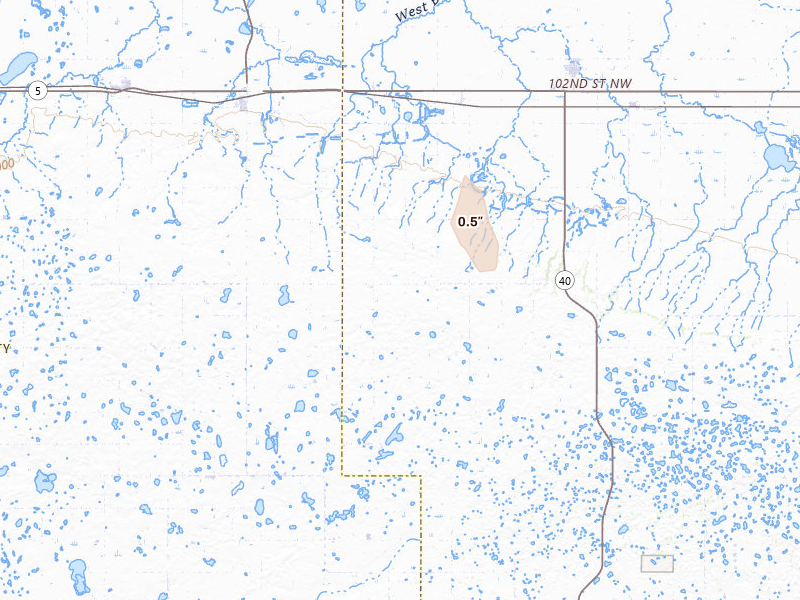
4 cities · up to 0.75" · 33 mapped homes
Louisiana

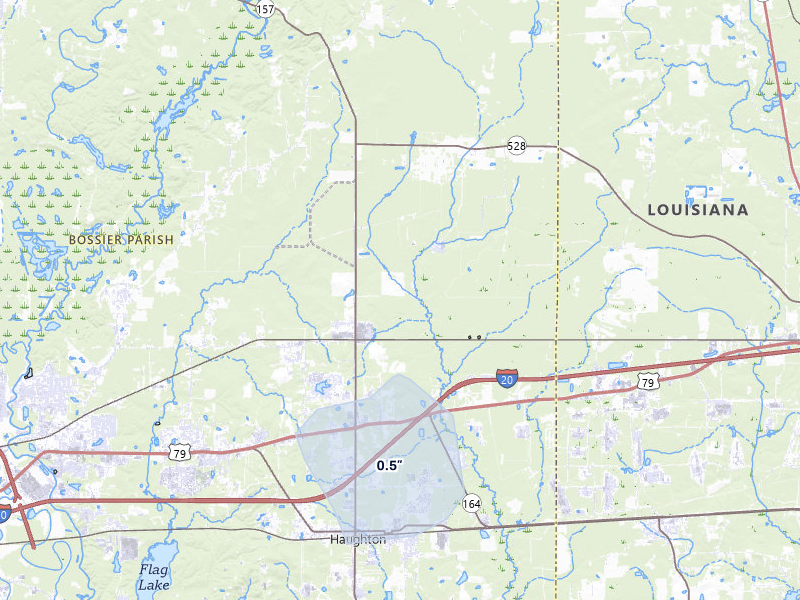
1 city · up to 0.5" · 332 mapped homes
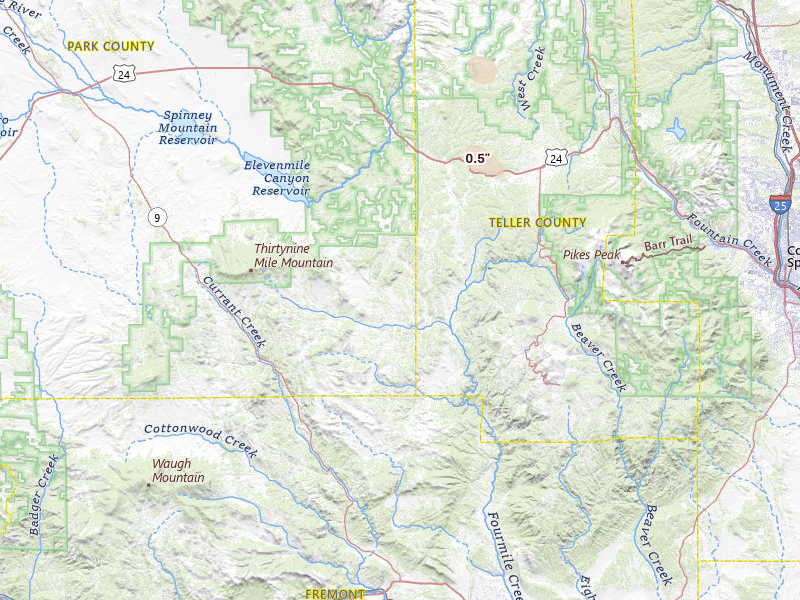
Colorado

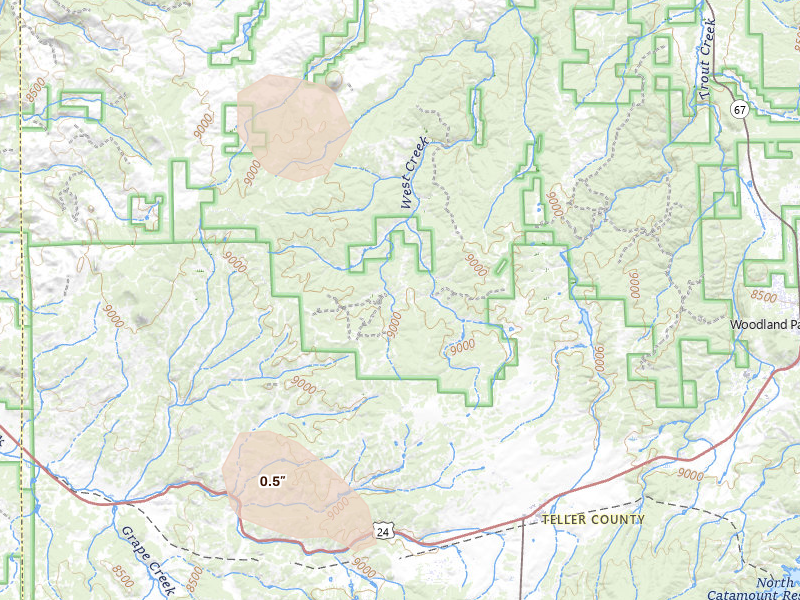
2 cities · up to 0.5" · 276 mapped homes
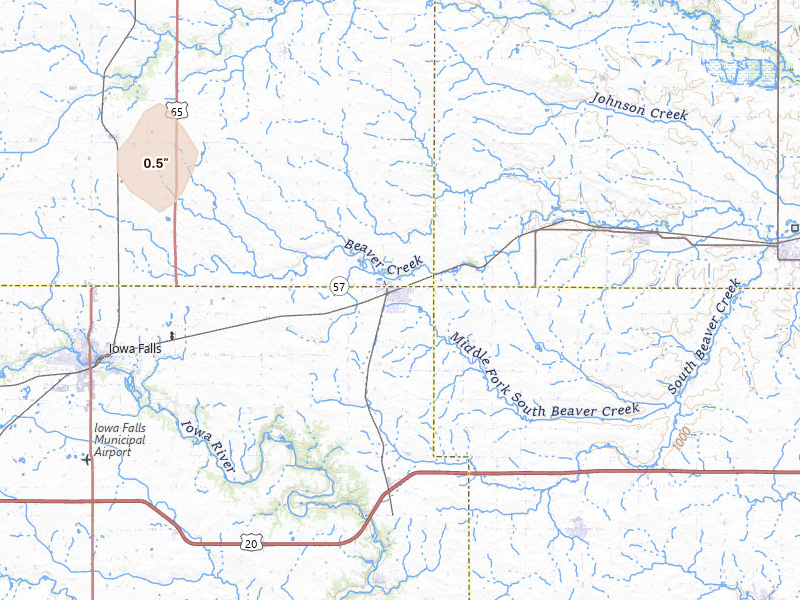
Iowa

1 city · up to 0.5" · 98 mapped homes
← All storm days

Overview Pro · iPhone + web

One app for your prospecting day.

The hail map, your next recommended area, and the tools to work it. Start on your own; the same subscription also includes access for up to 4 team members.

Overview Pro

One plan · iPhone + web

Monthly · US App Store

$149.99 / month

5,000 new addresses per user each month on Pro. Put your 200 trial addresses to work before another week goes to guesswork.

Optional outreach

+ $0.21 per contact returned
Available homeowner names and phone numbers, with freshness and DNC flags.
+ $0.75 per postcard mailed
Print, postage, and delivery tracking included.

What's included

Get recommended places to prospect, or draw your own. The same plan gives you the tools to work either one.

  • Hail maps, storm history, and live radar
  • Curated prospecting recommendations and Quests
  • Canvassing sessions and navigation
  • Door outcomes, notes, and photos
  • Visit history and follow-up Quests
  • Alerts for your saved territories
  • Polygon and hexagon draw tools
  • Saved work areas and address lists
  • CSV exports for your dialer or CRM
  • XP, levels, and the leaderboard
  • Access on iPhone and the web
  • Up to 4 team members

7-day free trial in the iPhone app. No card required to start.

Choose whether to subscribe when your trial ends. Paid subscriptions renew monthly. Manage or cancel in your Apple Account settings.

See all pricing and billing details →
Start free trial

Web trial: 7 days free. Card required. $150/month after the trial unless cancelled.

The next storm won’t wait for you.

Set your territory and alerts today. When hail hits, use Overview to choose your streets and get moving.

Download on the App Store

7-day free trial in the iPhone app. No card required to start.

For iPhone. Android coming soon.

Open Jul 13 on the live map → Start free trial

Web trial: 7 days free. Card required. $150/month after the trial unless cancelled.

Storm days are convective days (noon-to-noon UTC). Cities and counts are the set Overview tracks, not every place hail fell. Ground reports are public-domain observations from the NOAA Storm Prediction Center; radar sizes are detections and estimates, not confirmed damage.