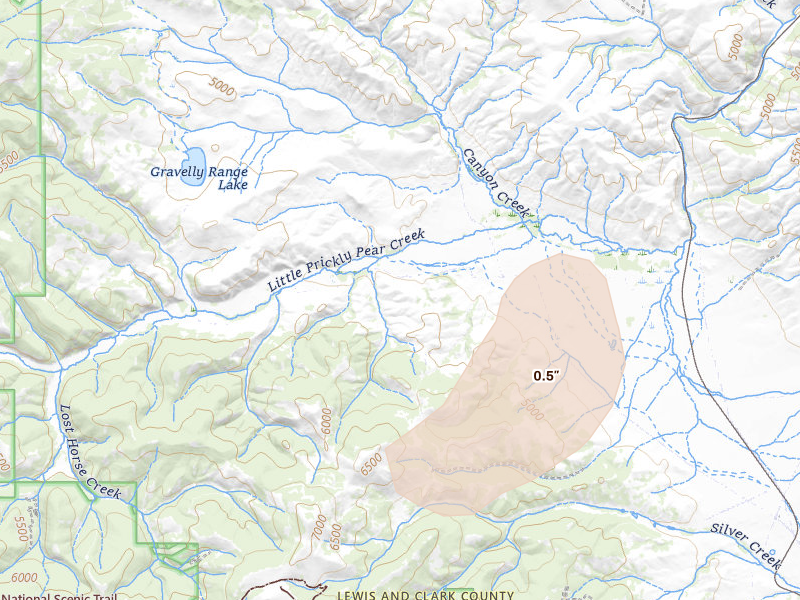
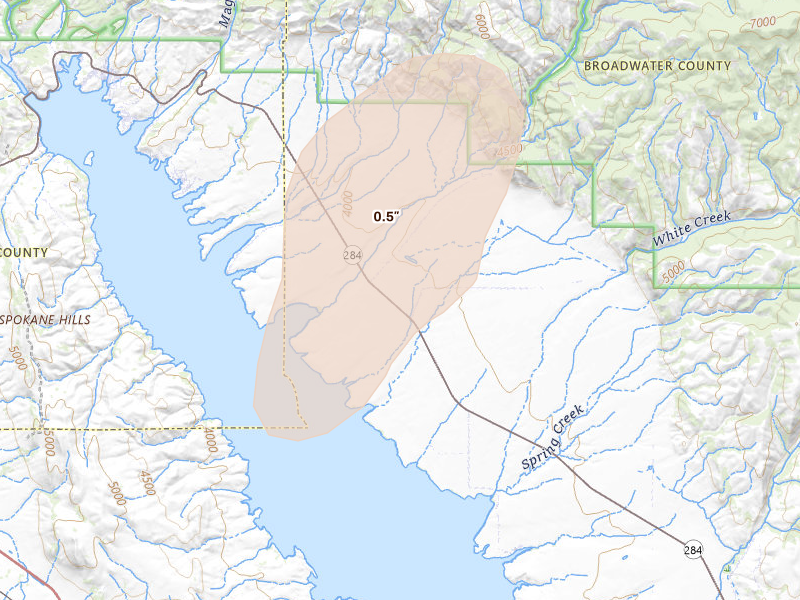
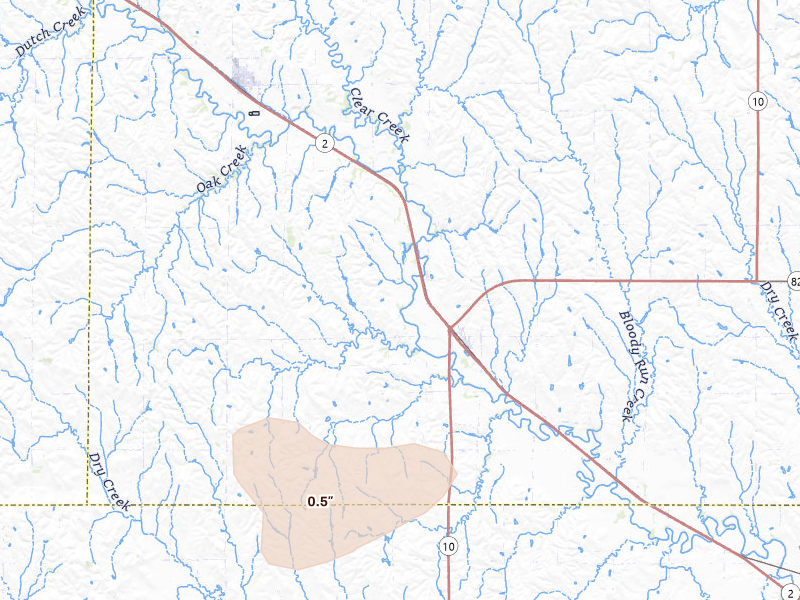
Hail storms on Aug 29, 2026

16 days ago

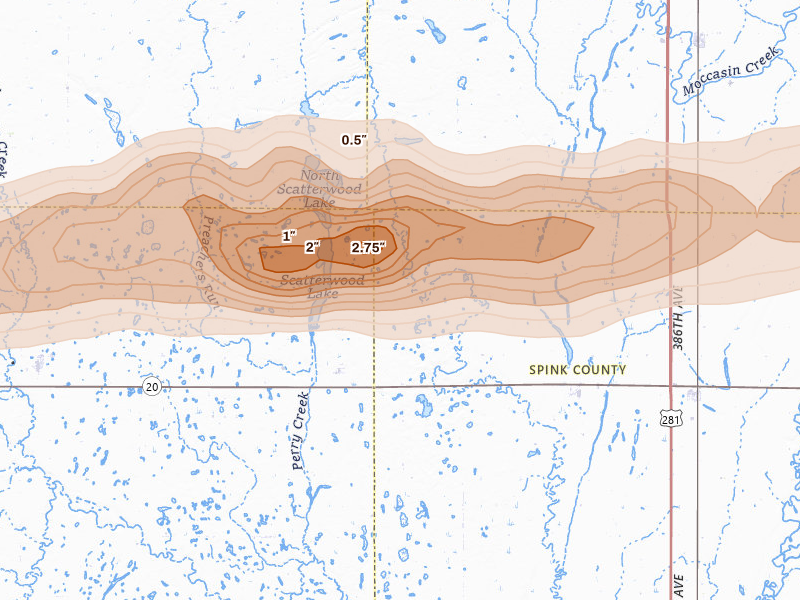
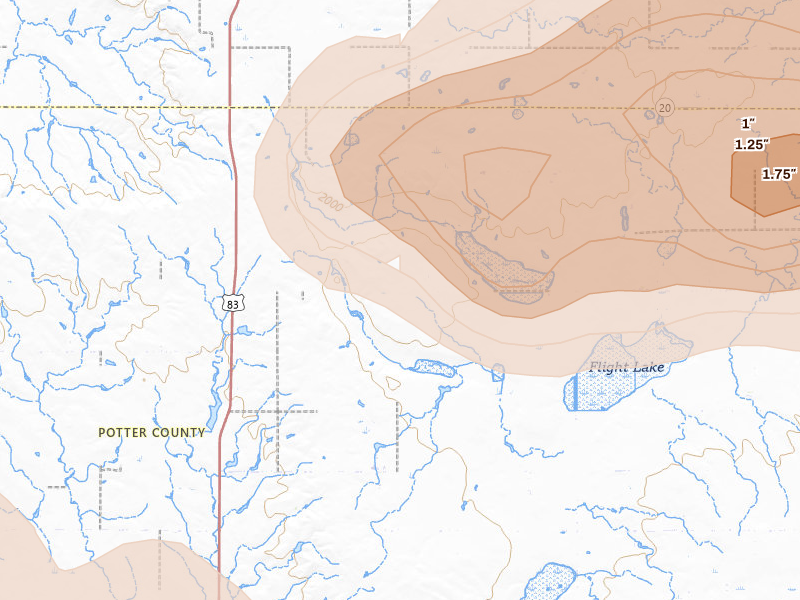
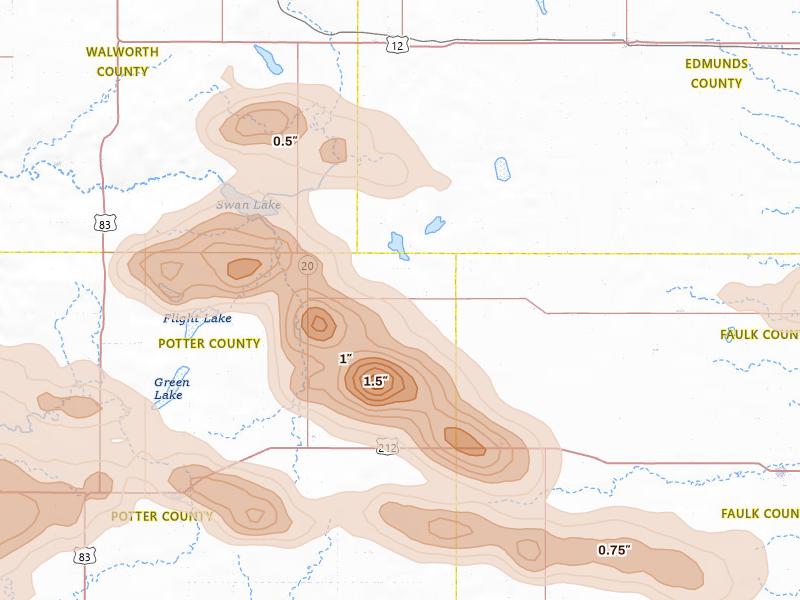
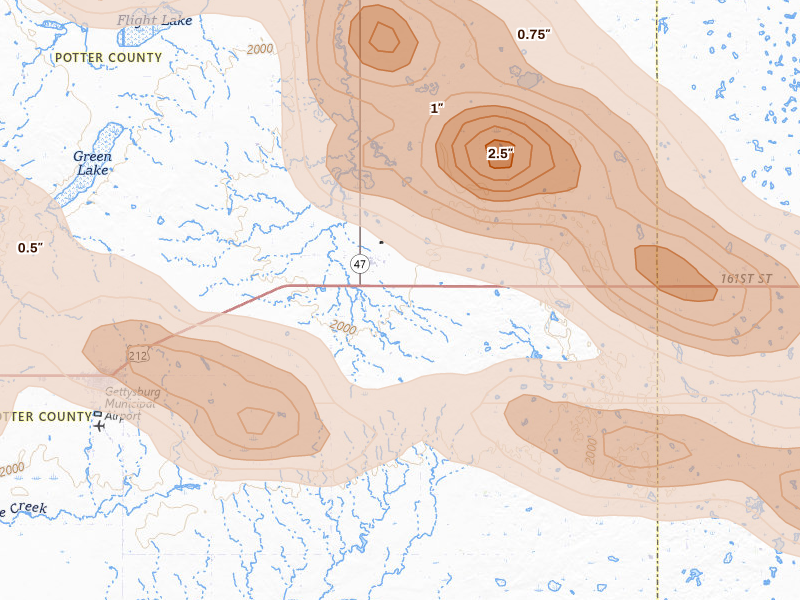
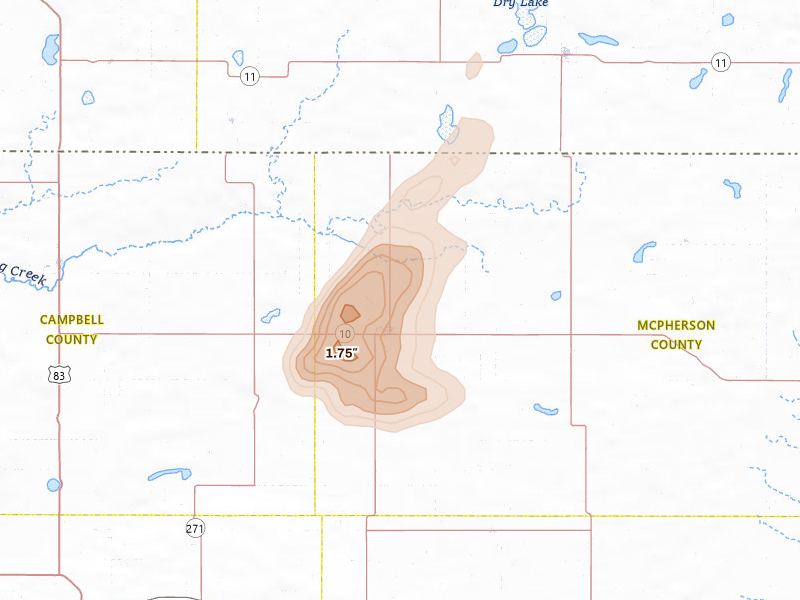
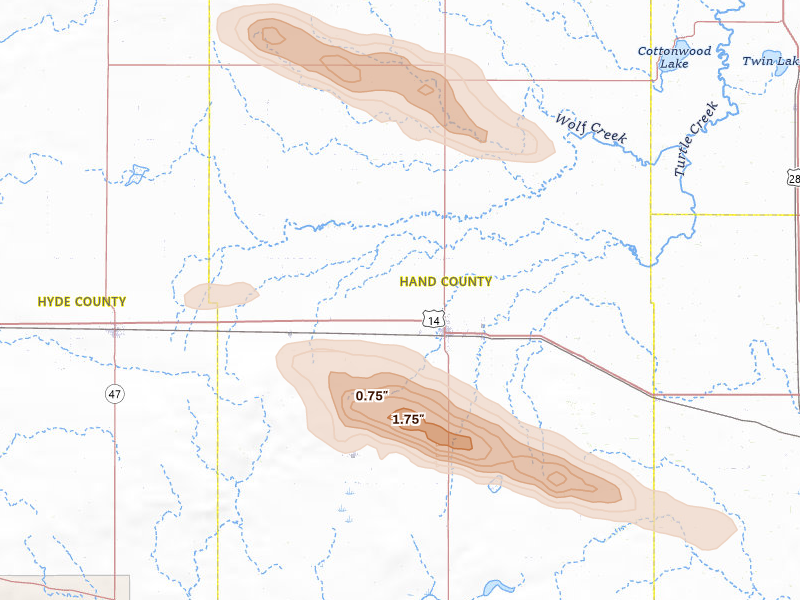
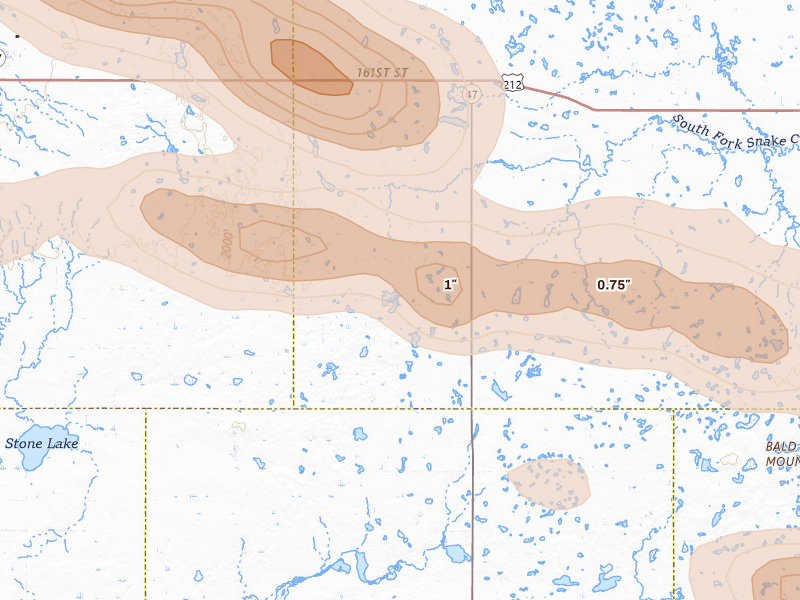
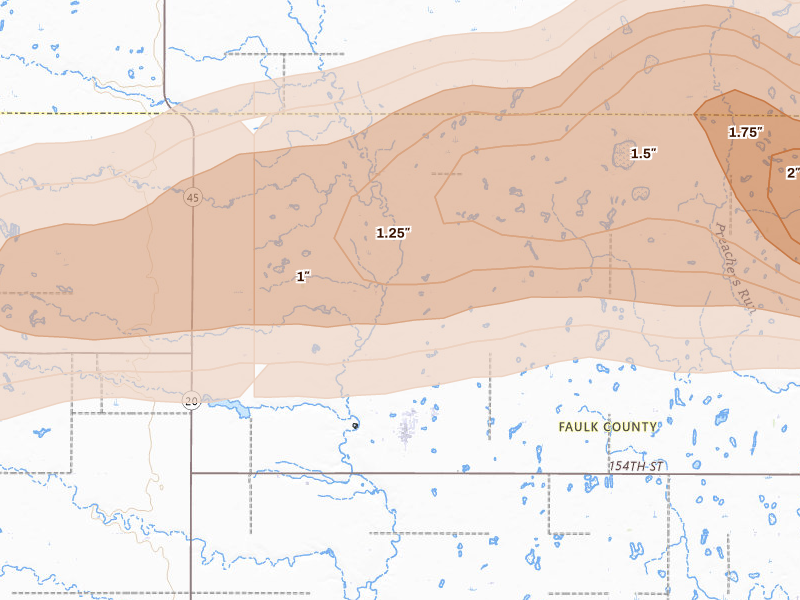
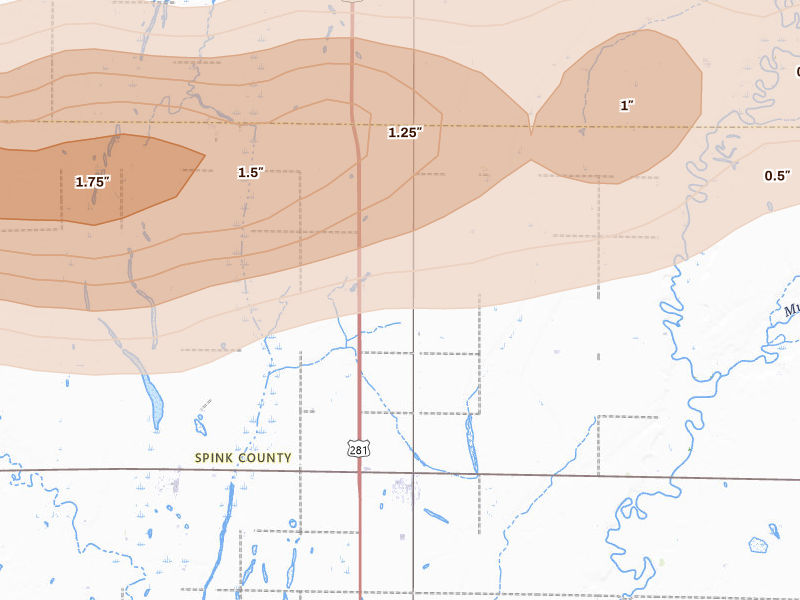
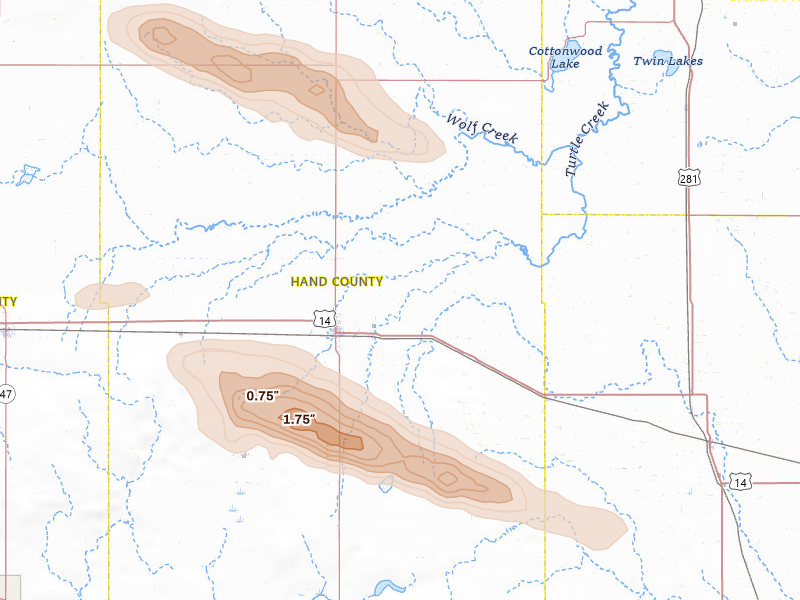
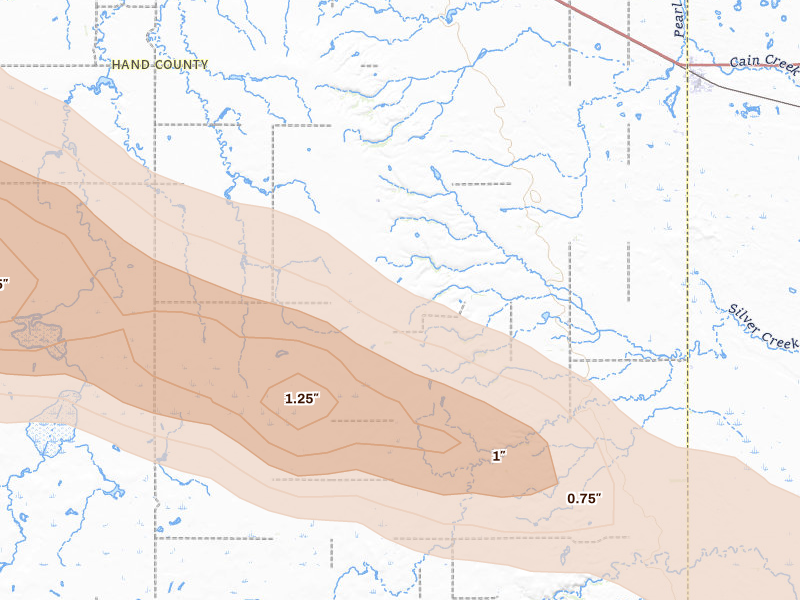
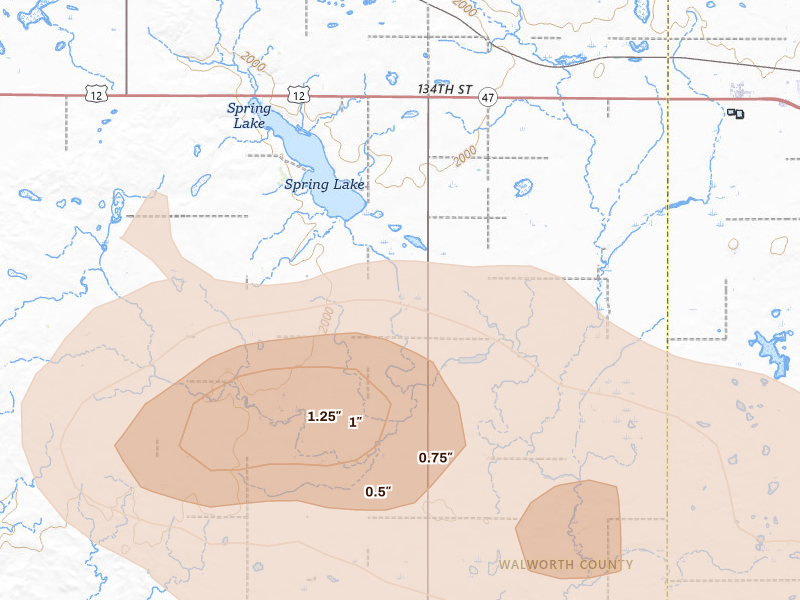
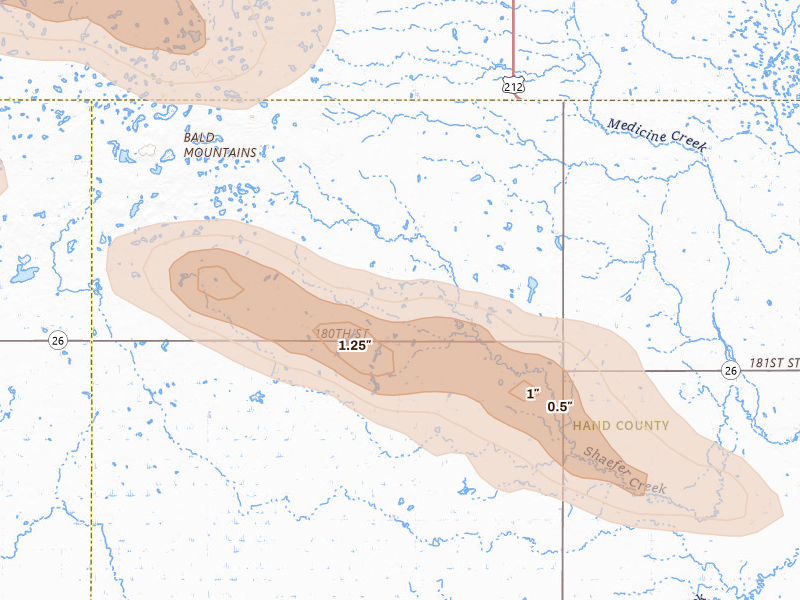
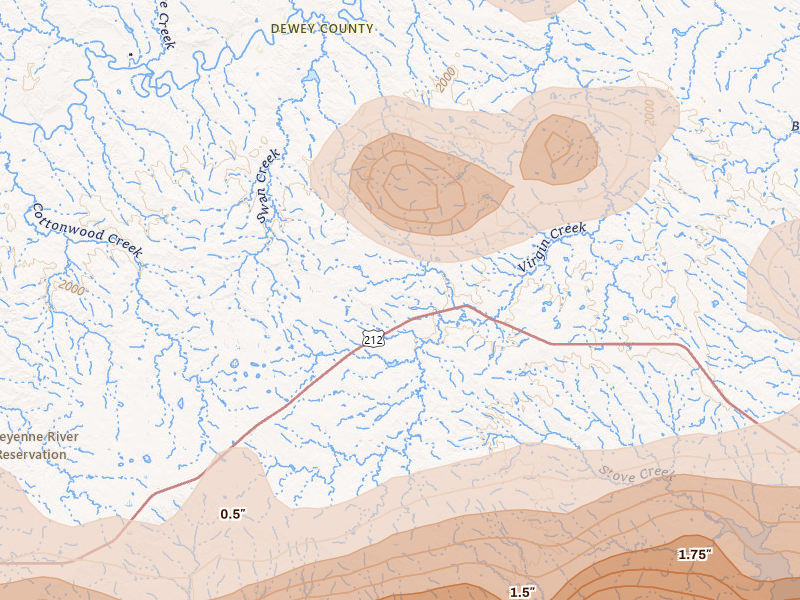
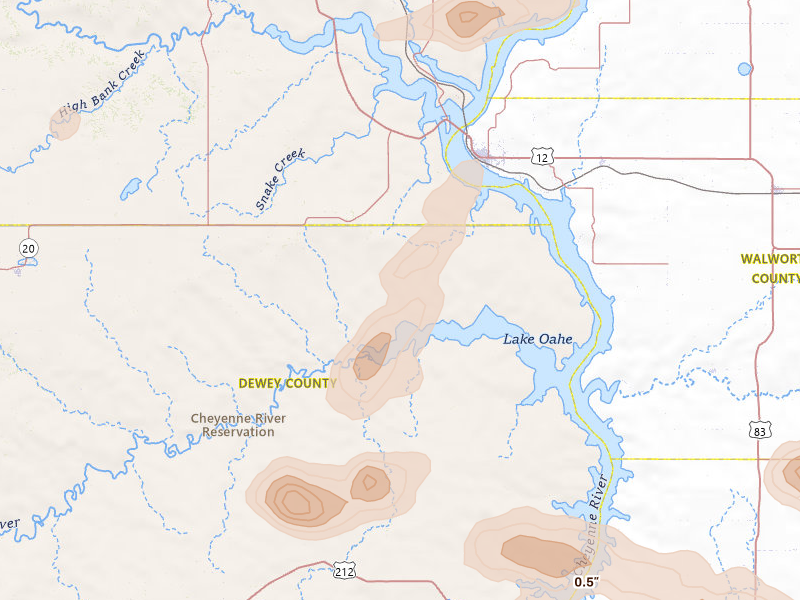
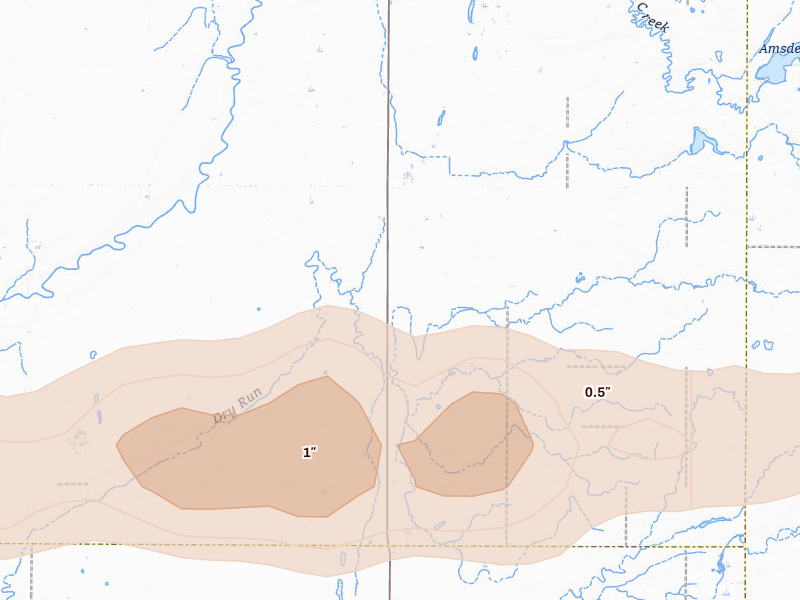
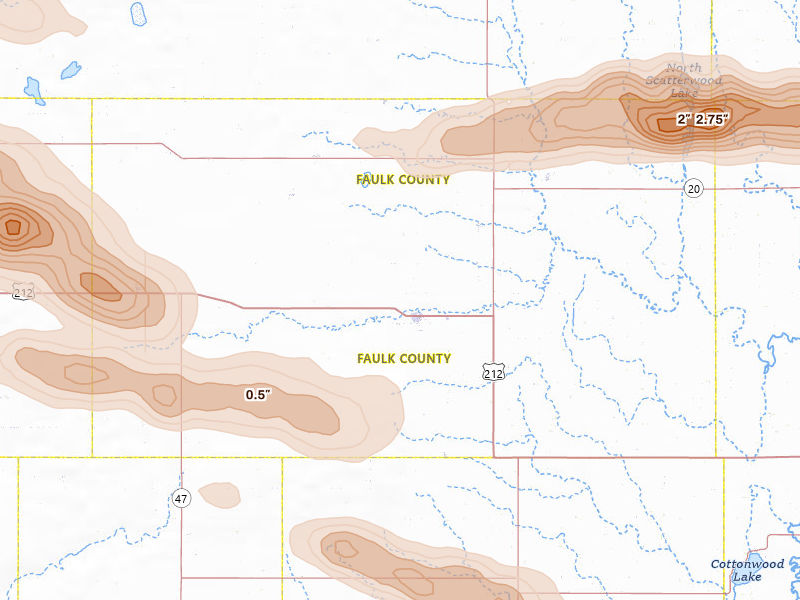
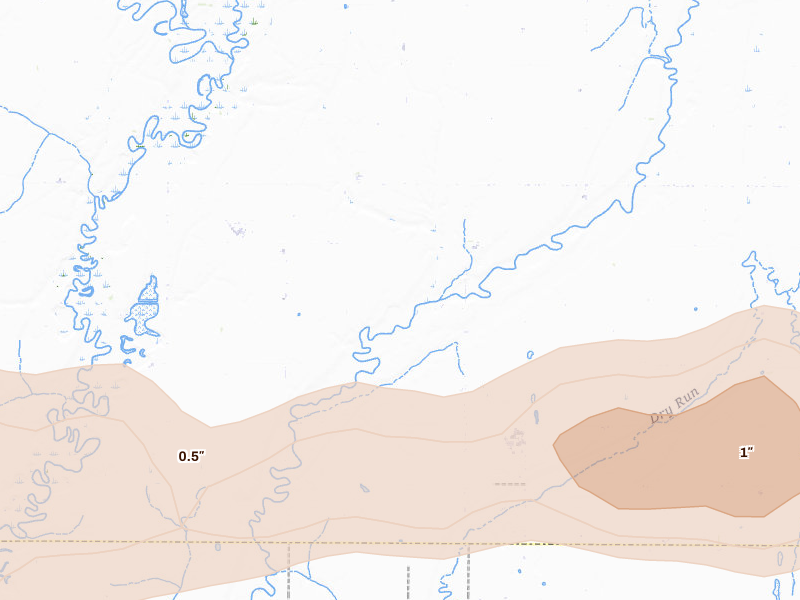
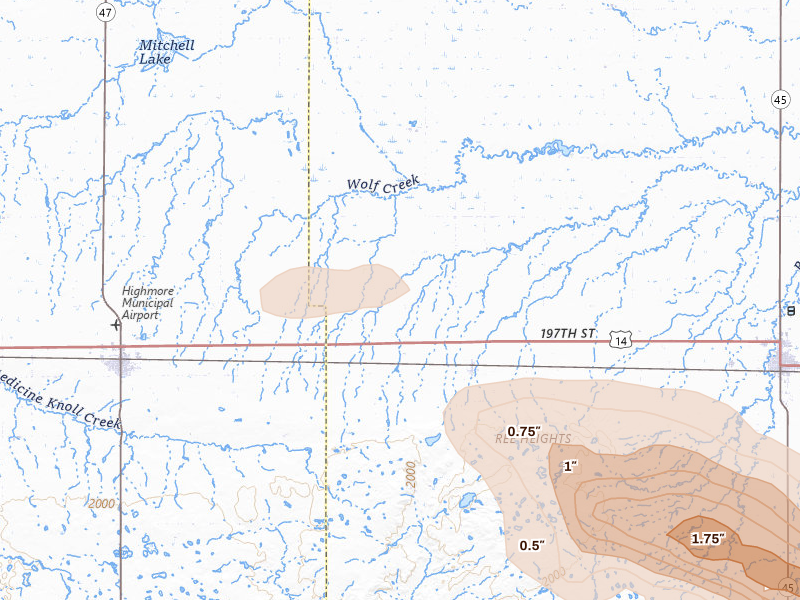
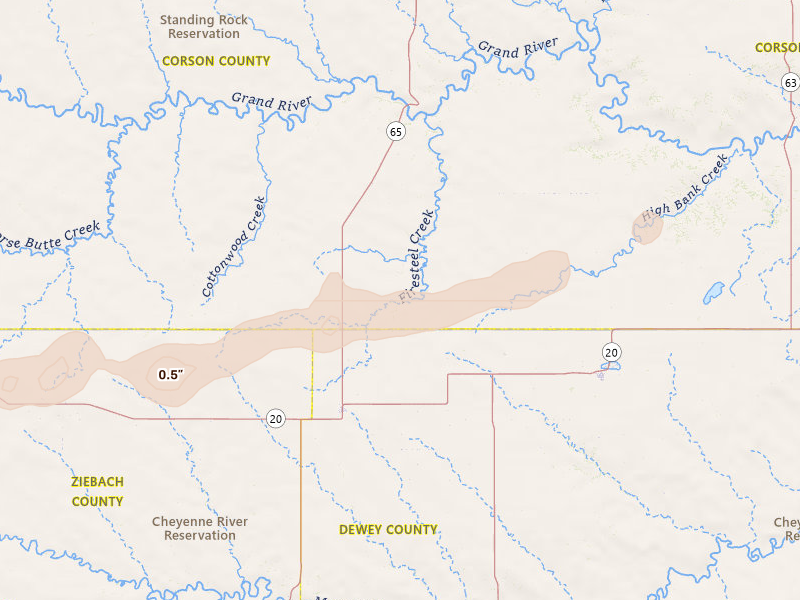
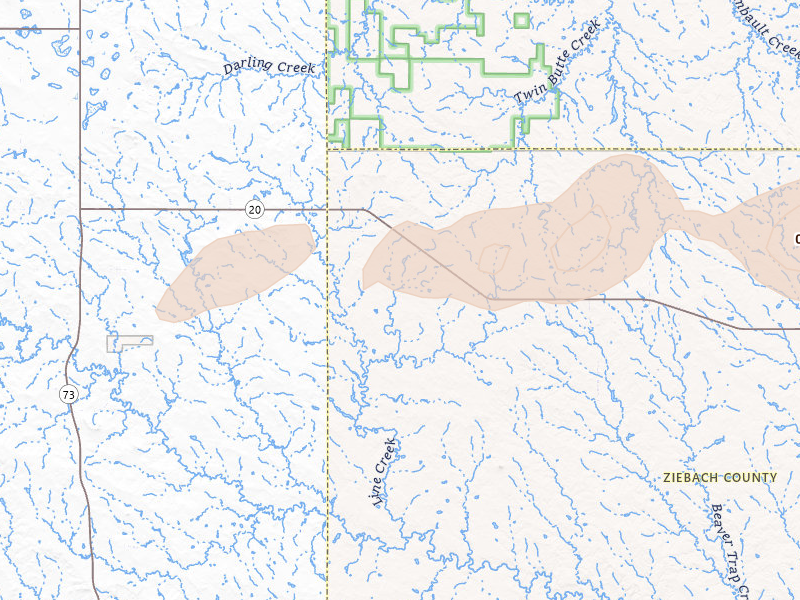
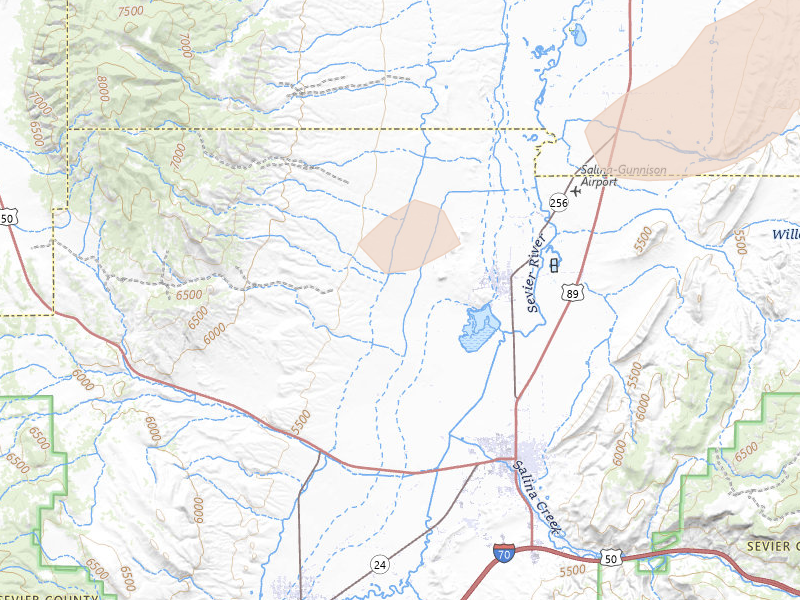
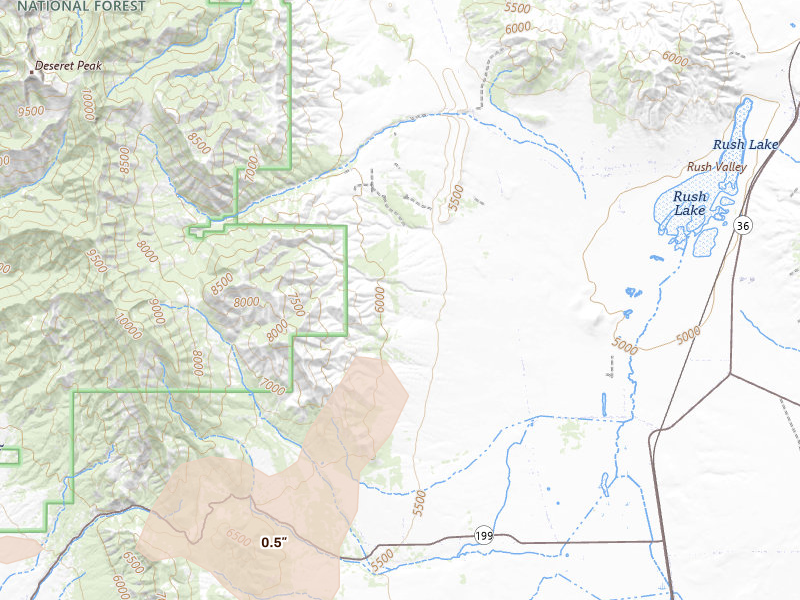
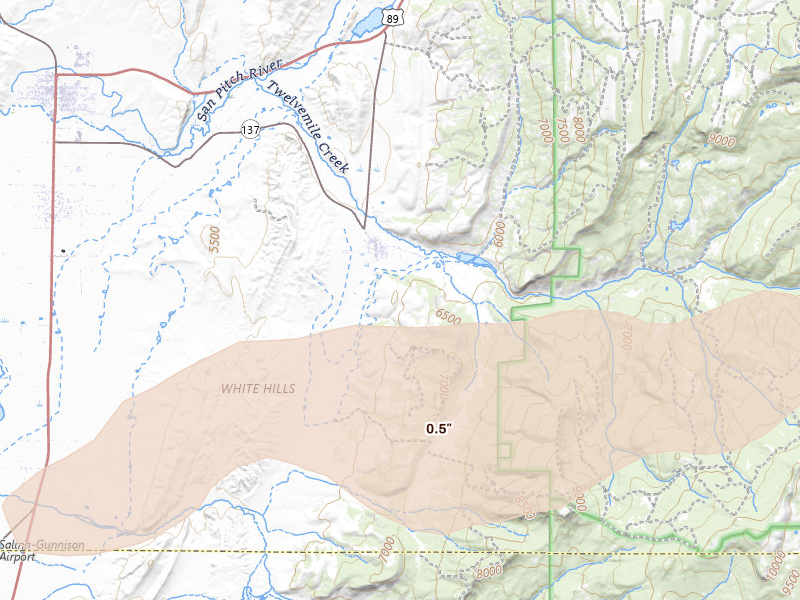
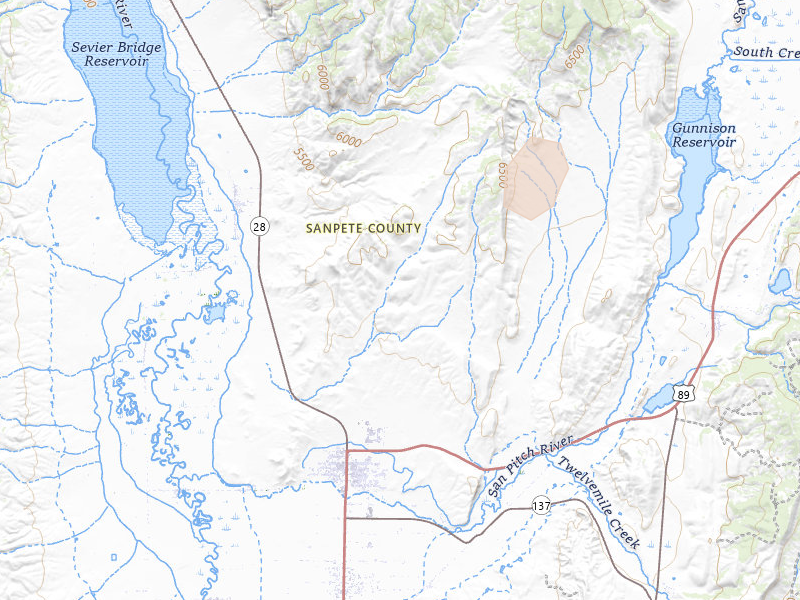
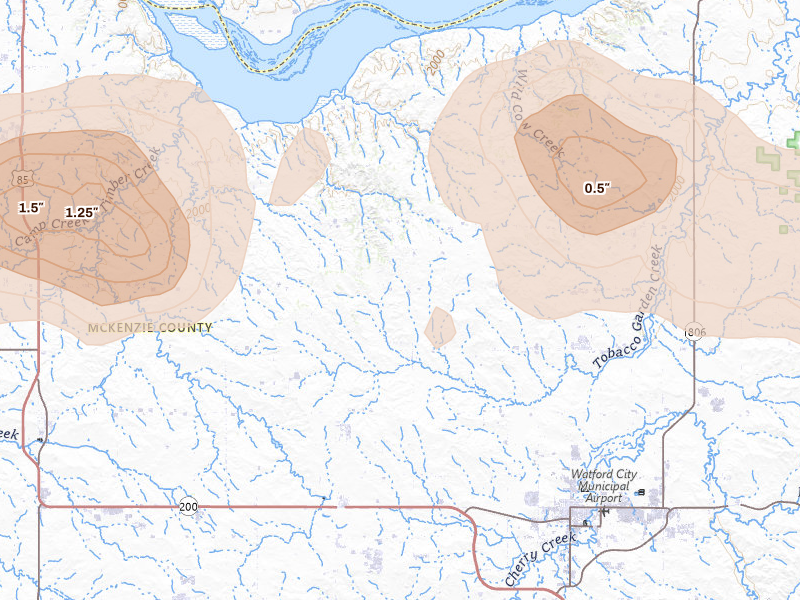
114 cities across 11 states recorded hail on Aug 29, 2026 — a multi-state outbreak. The peak radar-indicated size reached 3.25" over Gettysburg — about the size of a baseball. That is a severe hail signal, not property-level damage confirmation.

Download on the App Store

7-day free trial in the iPhone app. No card required to start.

For iPhone. Android coming soon.

Web trial: 7 days free. Card required. $150/month after the trial unless cancelled.

Cities hit 114 across 11 states
Peak hail signal 3.25" ≈ baseball · Gettysburg
Homes in footprints 103,233
Ground reports 13

Aug 29, 2026 · Gettysburg, SD: 3.25" peak radar signal · NEXRAD + radar-estimated size maps

Mapped cities, by state

Every tracked city with a hail signal on Aug 29, 2026

114 cities · up to 3.25" · 103,233 mapped homes · noon-to-noon UTC

Every tracked city that recorded hail on this convective day, biggest signal first. Each row opens that city's full storm record.

How to read this day

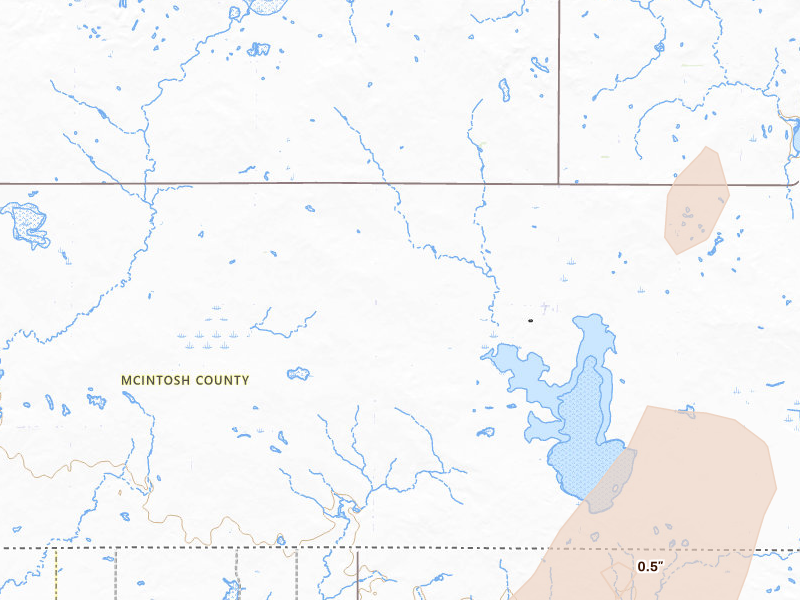
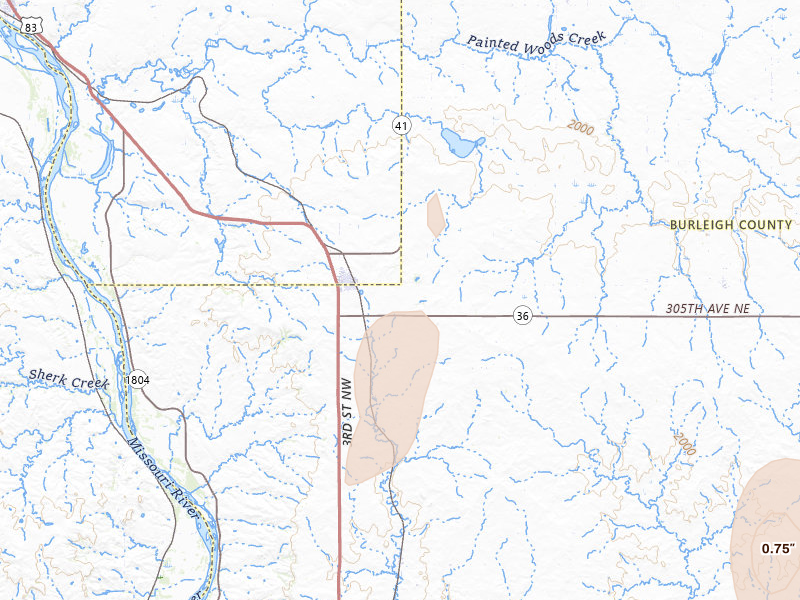
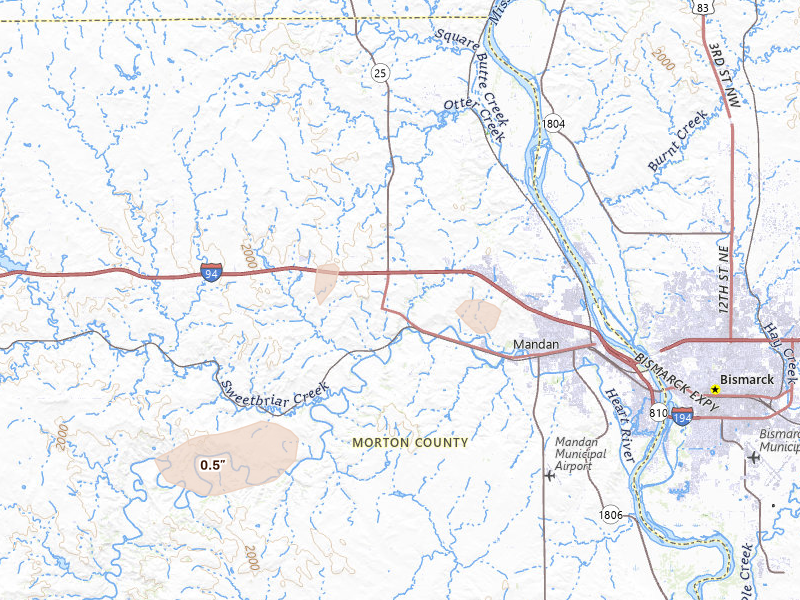
A storm day on Overview is a convective day — it runs from noon to noon UTC, so late-night hail is grouped with the afternoon storm that spawned it rather than split across two calendar dates. Everything below happened inside the Aug 29, 2026 convective day. Across those footprints sit roughly 103,233 homes, and 13 ground reports were filed with the National Weather Service.

The cities are listed with the biggest storm first, measured by Overview's severity score. Each row links through to that city's own storm page, where you'll find the radar surfaces, every ground report filed, and the hail footprint drawn on the map.

The counts here are the size of the set of cities Overview tracks — never "every US city" — so read a quiet day as "quiet among the places we watch," not as proof nothing happened elsewhere.

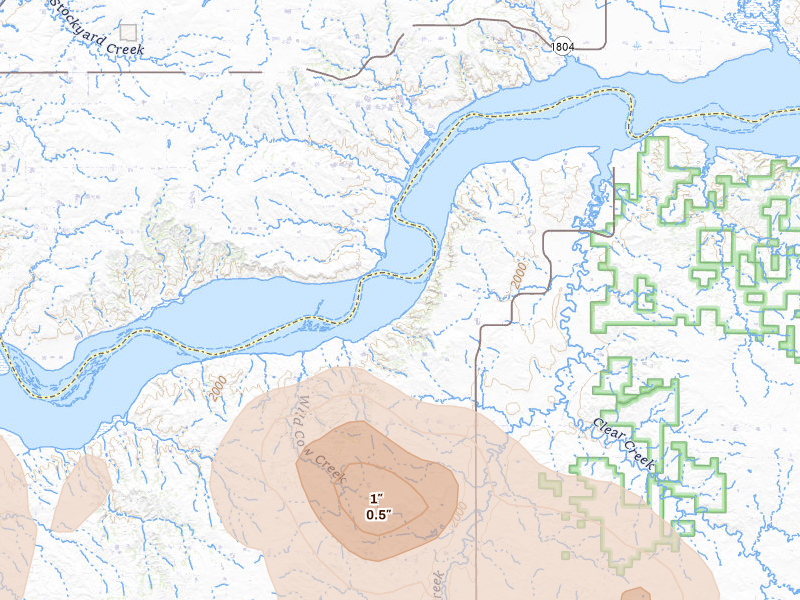
South Dakota

27 cities · up to 3.25" · 12,105 mapped homes
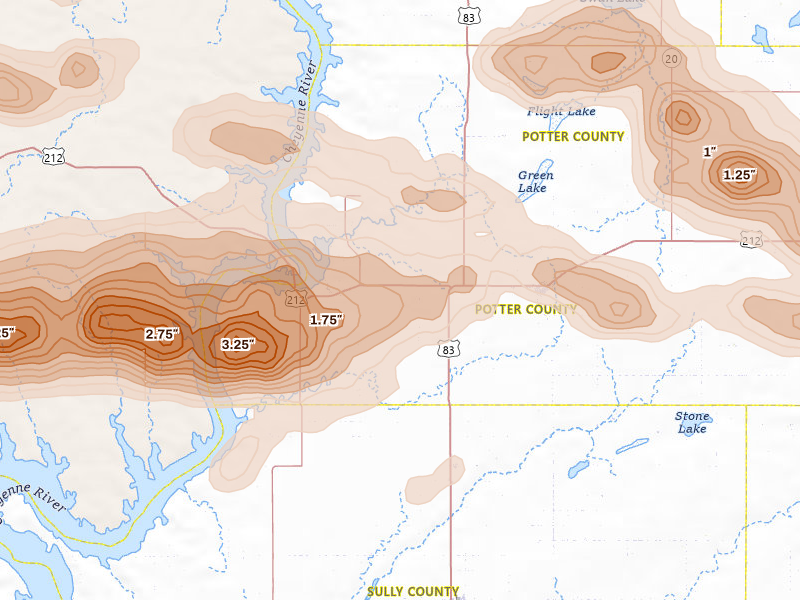
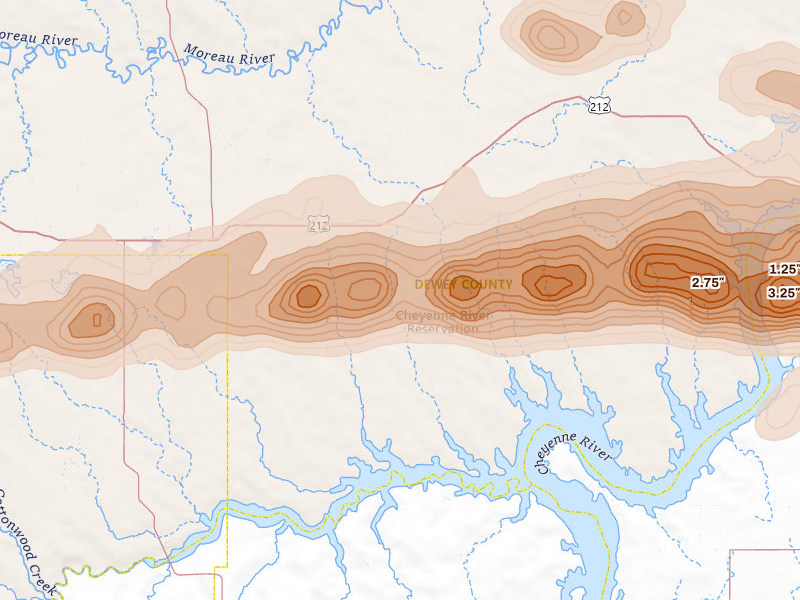
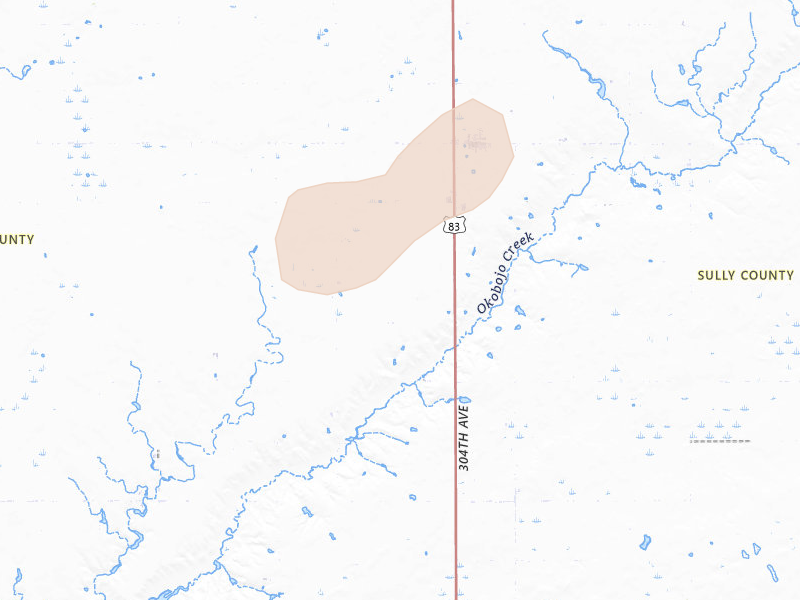
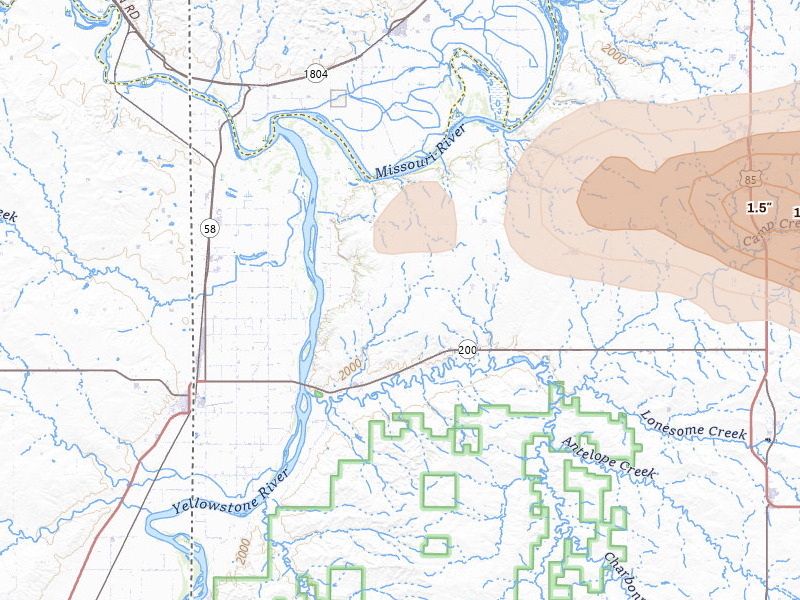
Gettysburg, SD 6.6 /10 severity
3.25" peak signal 2,710 mapped homes No ground reports
Eagle Butte, SD 6.0 /10 severity
3" peak signal 1,137 mapped homes No ground reports
Northville, SD 5.5 /10 severity
2.75" peak signal 535 mapped homes No ground reports
Hoven, SD 5.4 /10 severity
2.5" peak signal 1,827 mapped homes No ground reports
Tolstoy, SD 5.1 /10 severity
2.5" peak signal 583 mapped homes No ground reports
Lebanon, SD 5.0 /10 severity
2.5" peak signal 369 mapped homes No ground reports
Mansfield, SD 4.8 /10 severity
2.5" peak signal 118 mapped homes No ground reports
Eureka, SD 4.5 /10 severity
1.75" peak signal 1,453 mapped homes 1 ground report
Miller, SD 4.2 /10 severity
1.75" peak signal 441 mapped homes 1 ground report
Seneca, SD 3.9 /10 severity
1.75" peak signal 393 mapped homes No ground reports
Cresbard, SD 3.8 /10 severity
1.75" peak signal 190 mapped homes No ground reports
Mellette, SD 3.8 /10 severity
1.75" peak signal 257 mapped homes No ground reports
Saint Lawrence, SD 3.8 /10 severity
1.75" peak signal 227 mapped homes No ground reports
Dupree, SD 3.7 /10 severity
1.75" peak signal 115 mapped homes No ground reports
Wessington, SD 3.6 /10 severity
1.5" peak signal 126 mapped homes 1 ground report
Bowdle, SD 3.2 /10 severity
1.25" peak signal 146 mapped homes 1 ground report
Orient, SD 3.2 /10 severity
1.25" peak signal 355 mapped homes No ground reports
Mc Laughlin, SD 2.9 /10 severity
1.25" peak signal 126 mapped homes No ground reports
Ridgeview, SD 2.9 /10 severity
1.5" peak signal 17 mapped homes No ground reports
Mobridge, SD 2.7 /10 severity
1.25" peak signal 54 mapped homes No ground reports
Conde, SD 2.6 /10 severity
1" peak signal 125 mapped homes No ground reports
Faulkton, SD 2.6 /10 severity
1" peak signal 150 mapped homes No ground reports
Stratford, SD 2.6 /10 severity
1" peak signal 164 mapped homes No ground reports
Ree Heights, SD 2.4 /10 severity
1" peak signal 56 mapped homes No ground reports
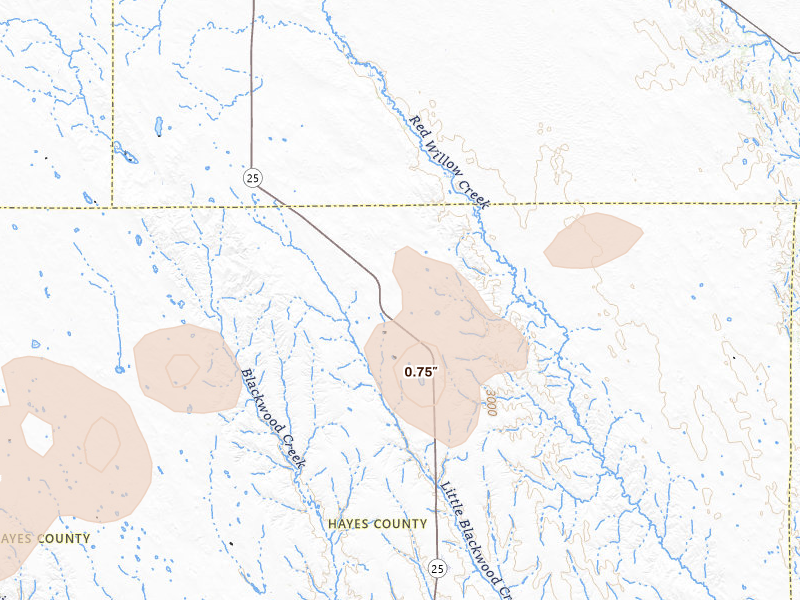
Isabel, SD 2.3 /10 severity
0.75" peak signal 198 mapped homes No ground reports
Meadow, SD 2.0 /10 severity
0.75" peak signal 59 mapped homes No ground reports
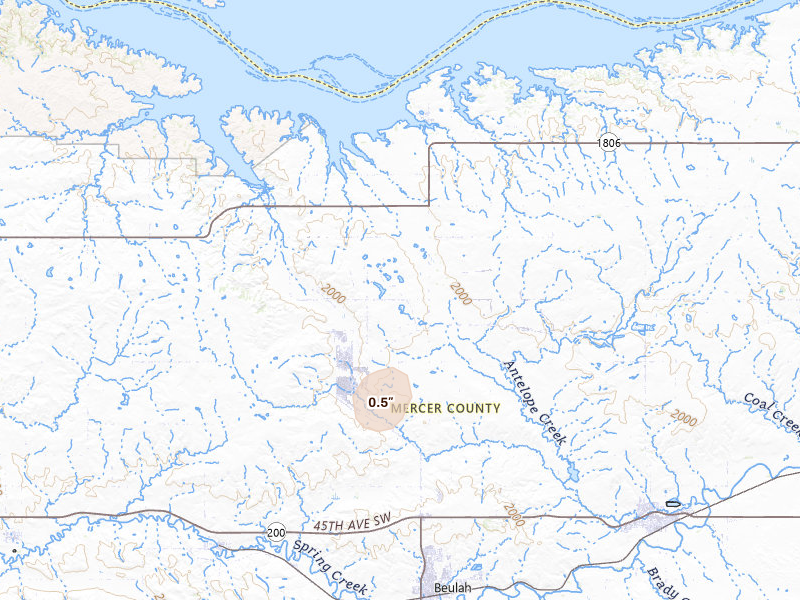
Agar, SD 1.9 /10 severity
0.5" peak signal 174 mapped homes No ground reports

Utah

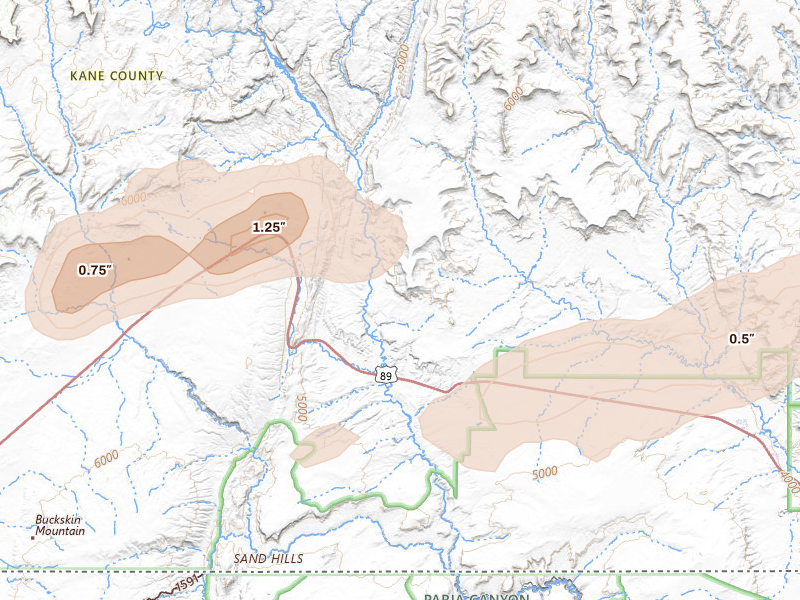
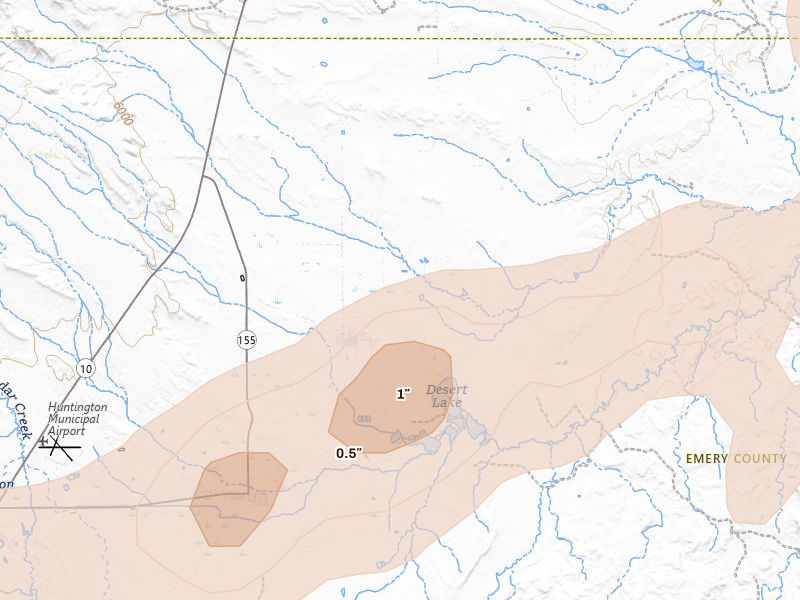
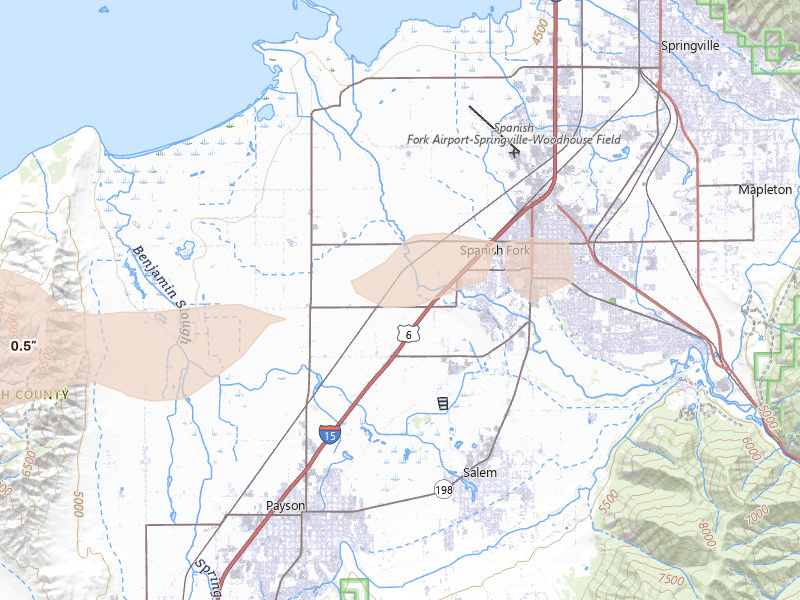
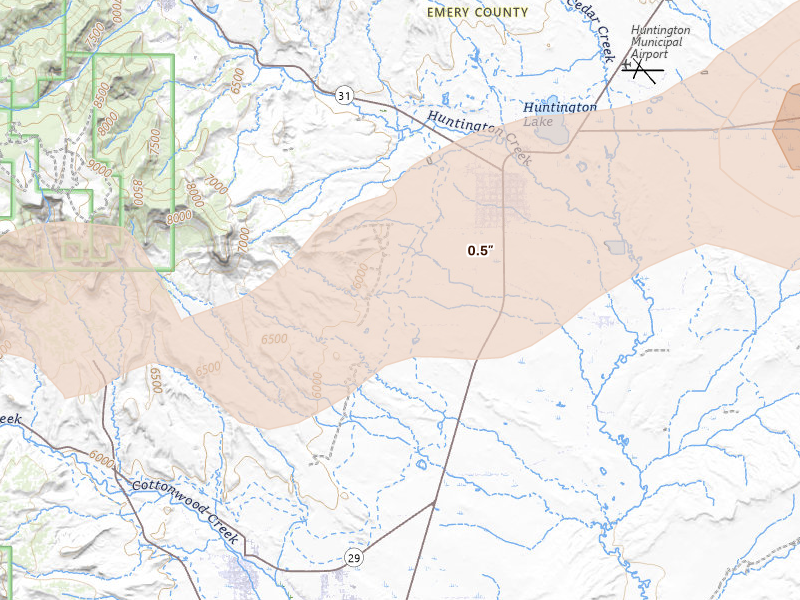
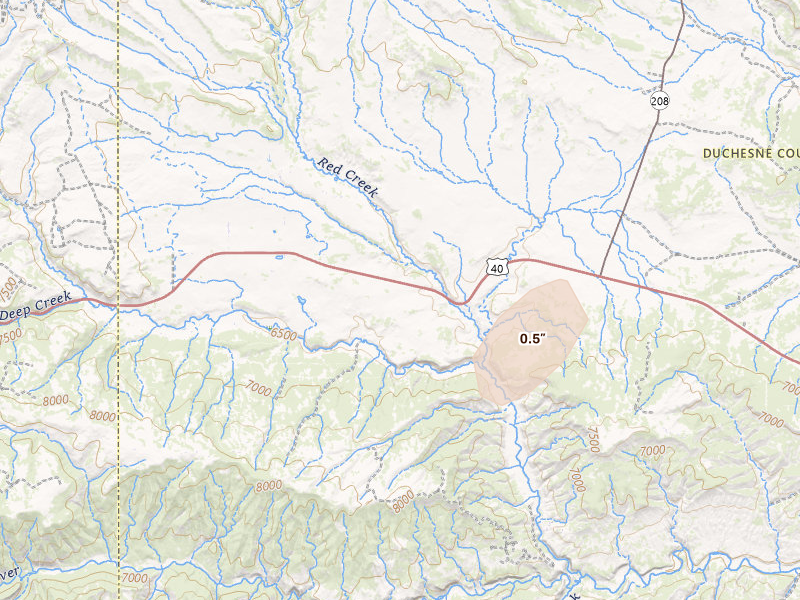
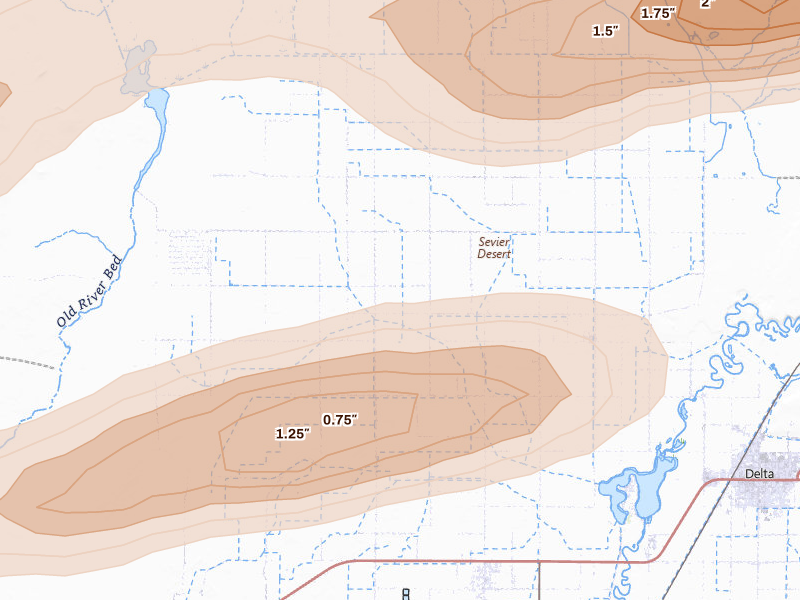
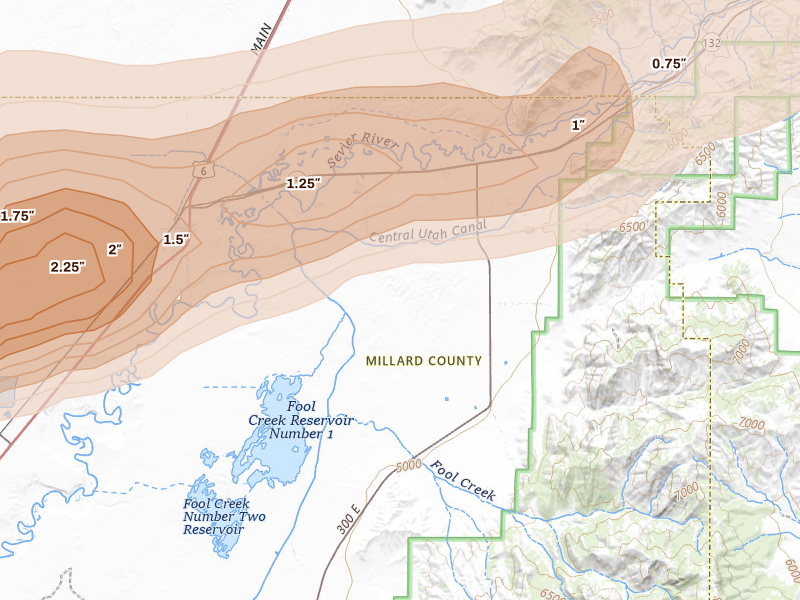
13 cities · up to 2.5" · 5,846 mapped homes
North Dakota

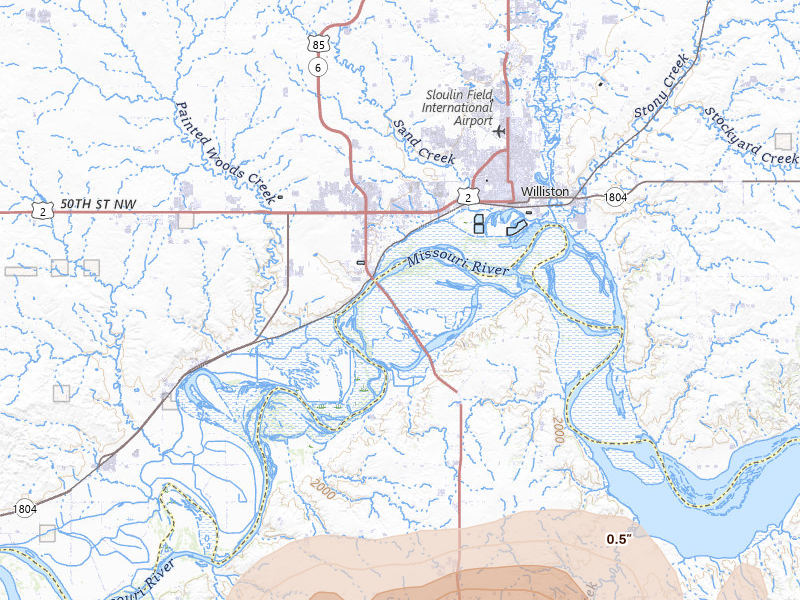
8 cities · up to 1.5" · 868 mapped homes
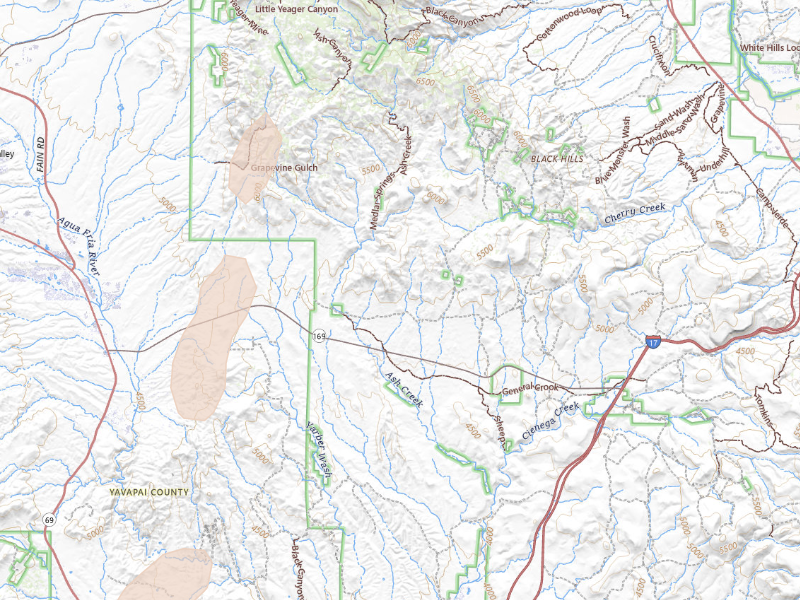
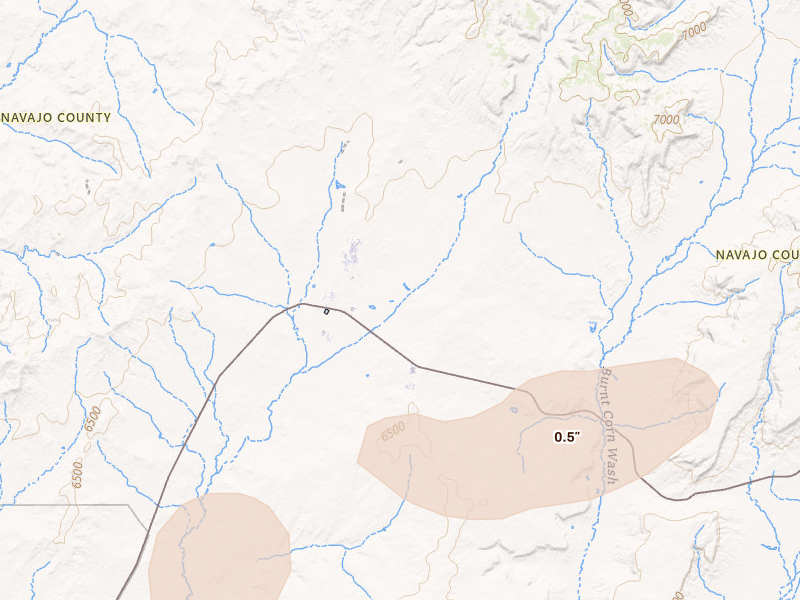
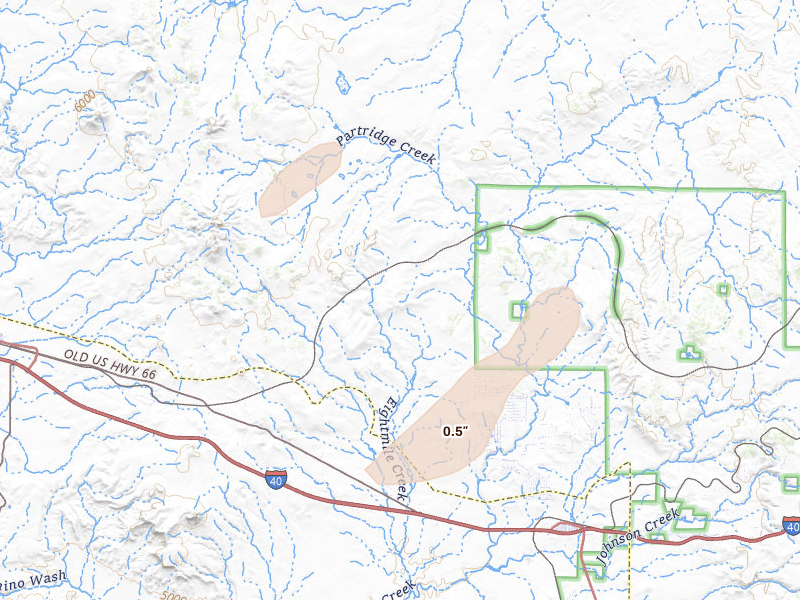
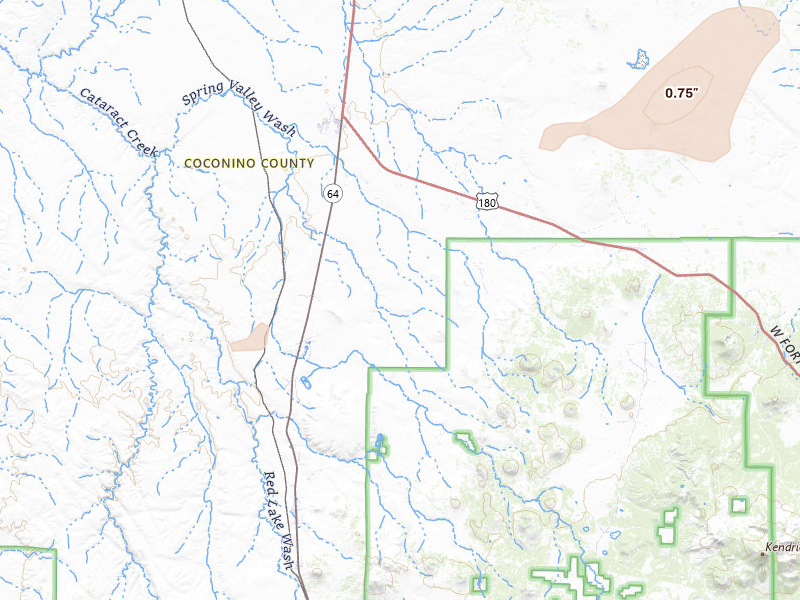
Arizona

16 cities · up to 1.5" · 692 mapped homes
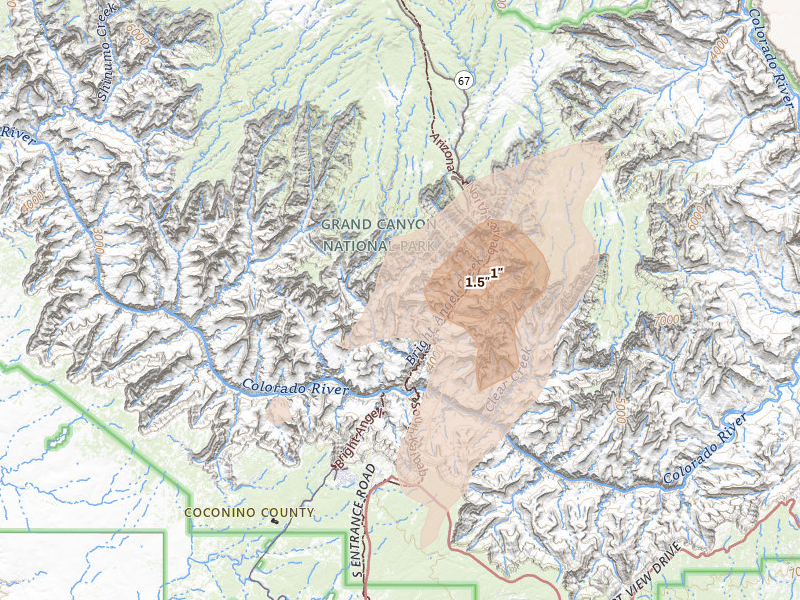
North Rim, AZ 3.0 /10 severity
1.5" peak signal 34 mapped homes No ground reports
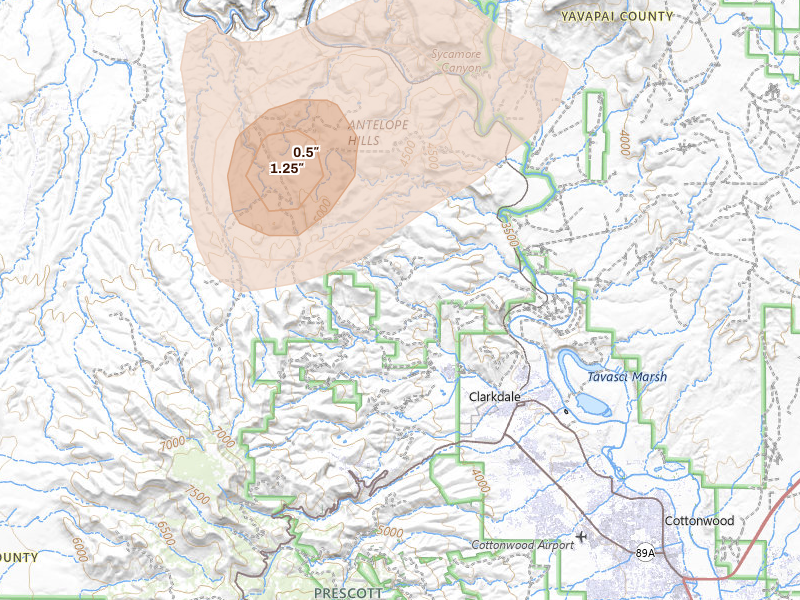
Clarkdale, AZ 2.3 /10 severity
1.25" peak signal 7 mapped homes No ground reports
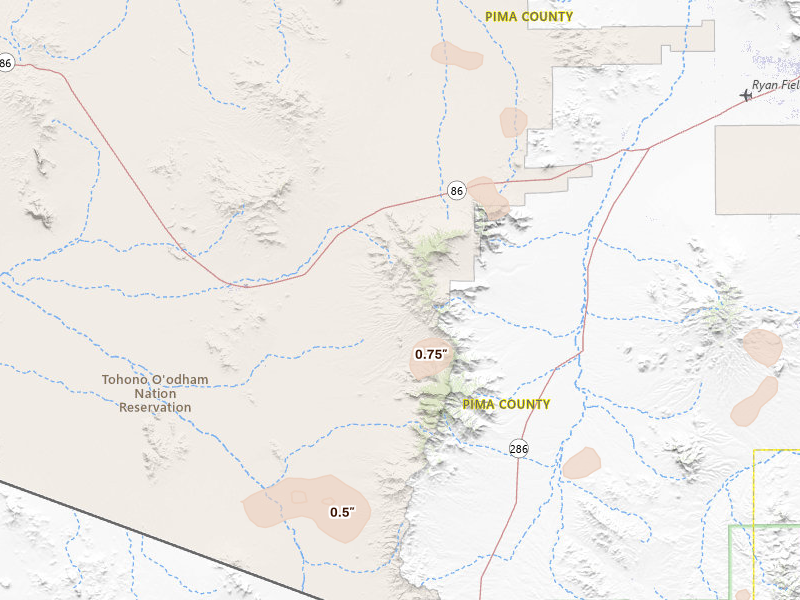
Sells, AZ 2.1 /10 severity
0.75" peak signal 79 mapped homes No ground reports
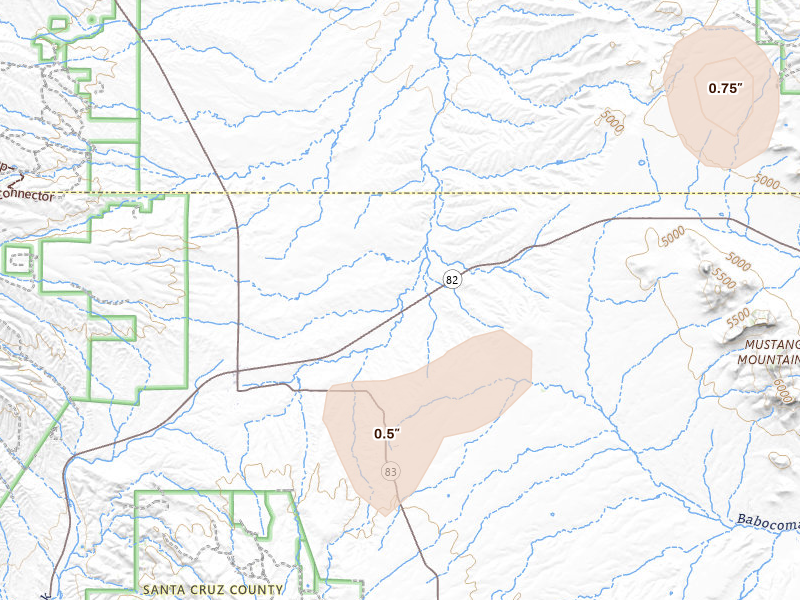
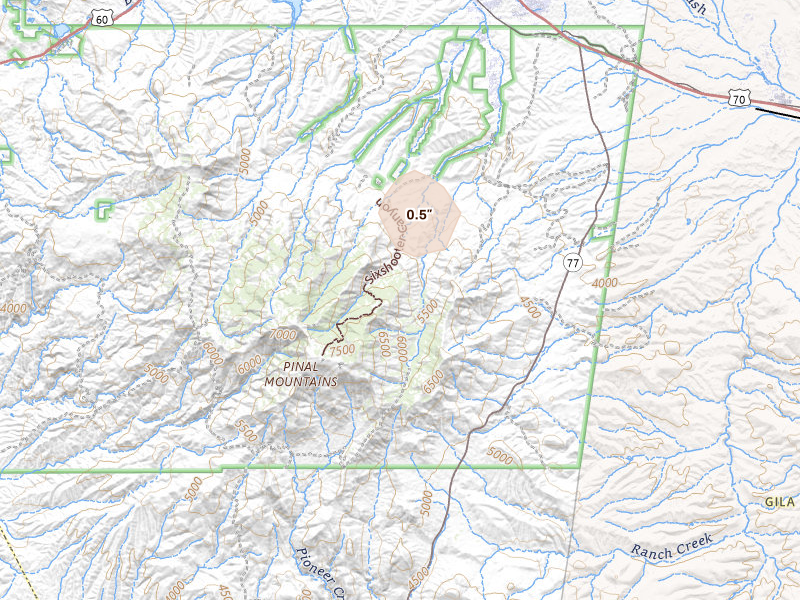
Sonoita, AZ 2.0 /10 severity
0.5" peak signal 261 mapped homes No ground reports
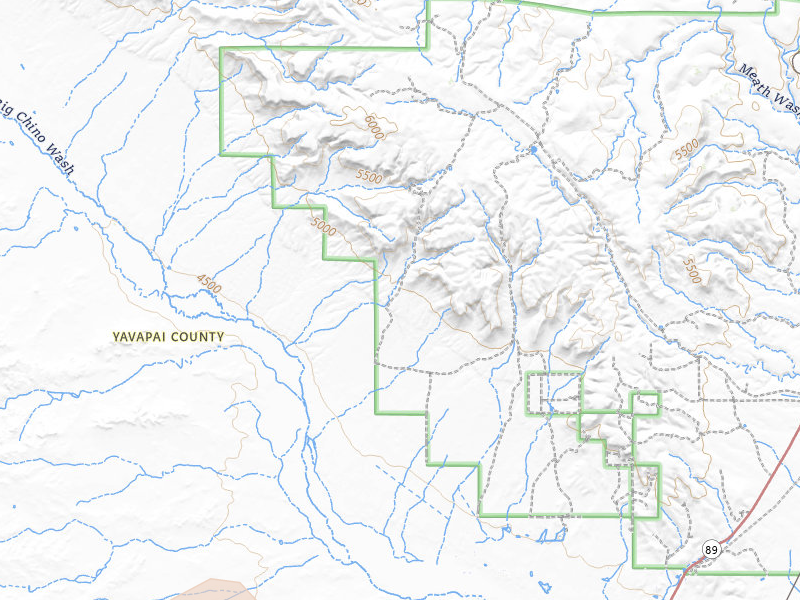
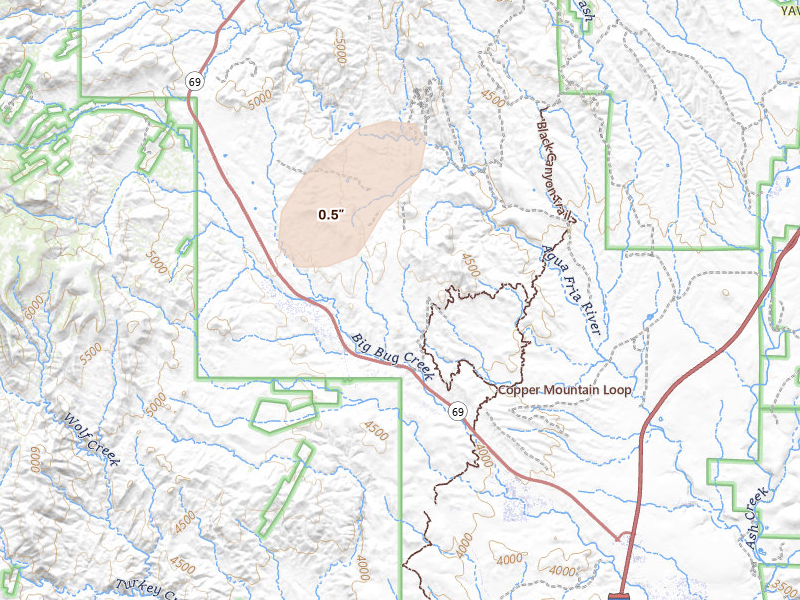
Dewey, AZ 1.9 /10 severity
0.5" peak signal 162 mapped homes No ground reports
Pinon, AZ 1.7 /10 severity
0.5" peak signal 71 mapped homes No ground reports
Ash Fork, AZ 1.6 /10 severity
0.5" peak signal 41 mapped homes No ground reports
Williams, AZ 1.5 /10 severity
0.75" peak signal 4 mapped homes No ground reports
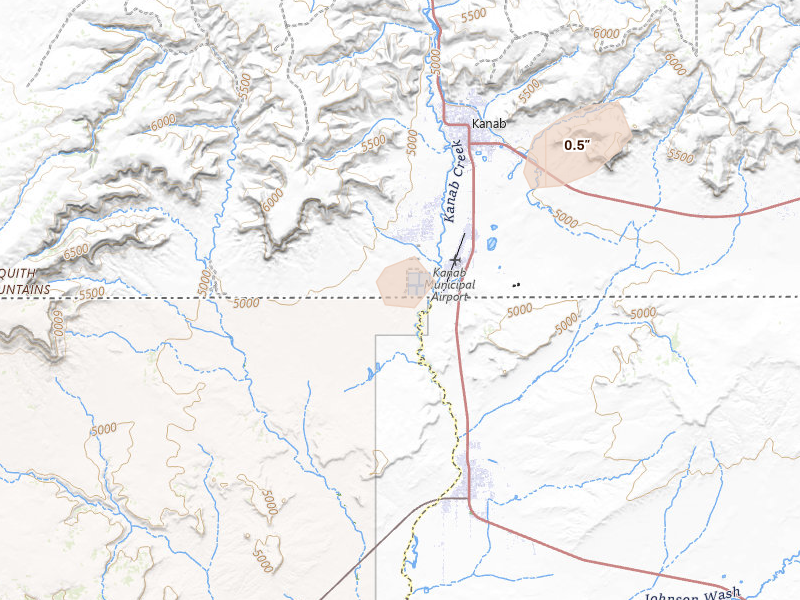
Fredonia, AZ 1.4 /10 severity
0.5" peak signal 21 mapped homes No ground reports
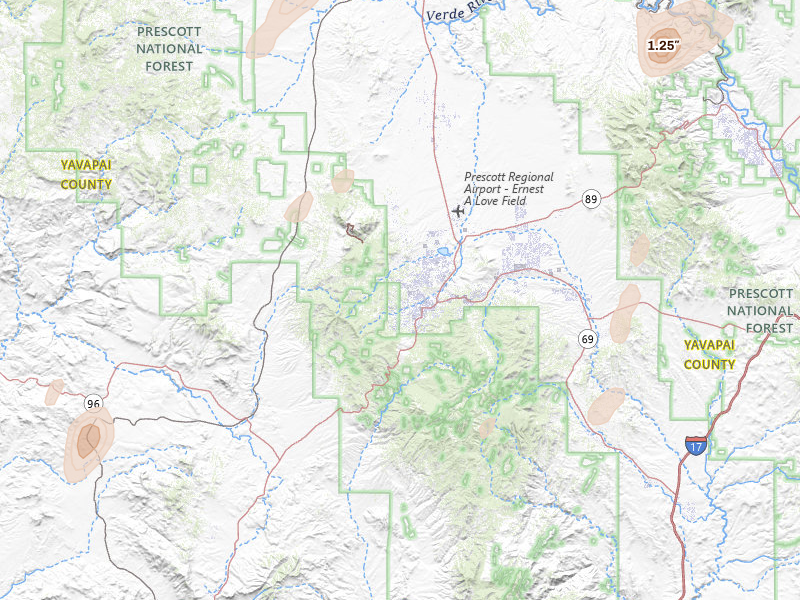
Prescott, AZ 1.3 /10 severity
0.5" peak signal 12 mapped homes No ground reports
Paulden, AZ 1.1 /10 severity
0.75" peak signal 0 mapped homes No ground reports
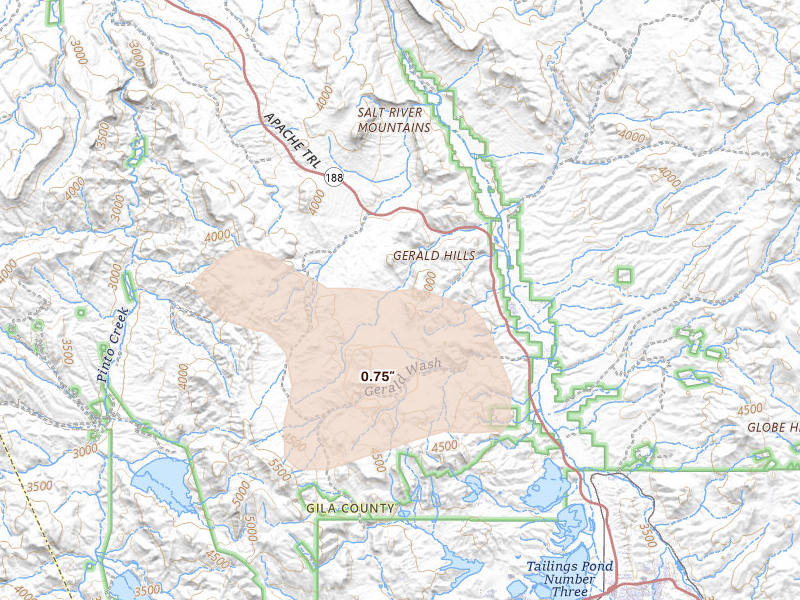
Roosevelt, AZ 1.1 /10 severity
0.75" peak signal 0 mapped homes No ground reports
Globe, AZ 0.8 /10 severity
0.5" peak signal 0 mapped homes No ground reports
Mayer, AZ 0.8 /10 severity
0.5" peak signal 0 mapped homes No ground reports
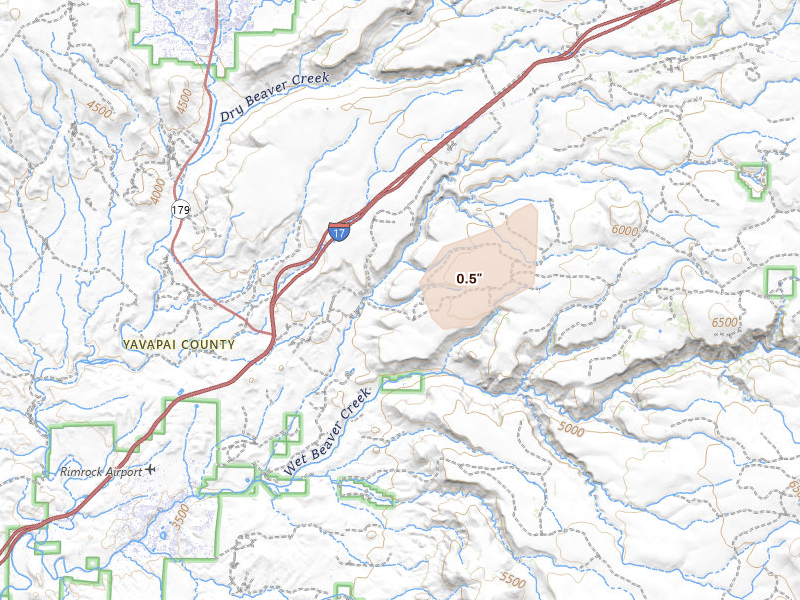
Rimrock, AZ 0.8 /10 severity
0.5" peak signal 0 mapped homes No ground reports
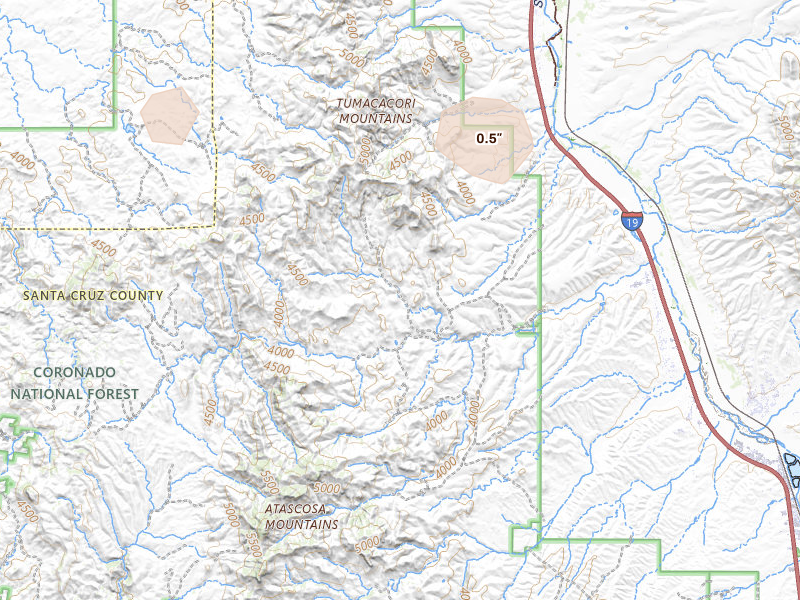
Rio Rico, AZ 0.8 /10 severity
0.5" peak signal 0 mapped homes No ground reports

Florida

35 cities · up to 1.25" · 81,227 mapped homes
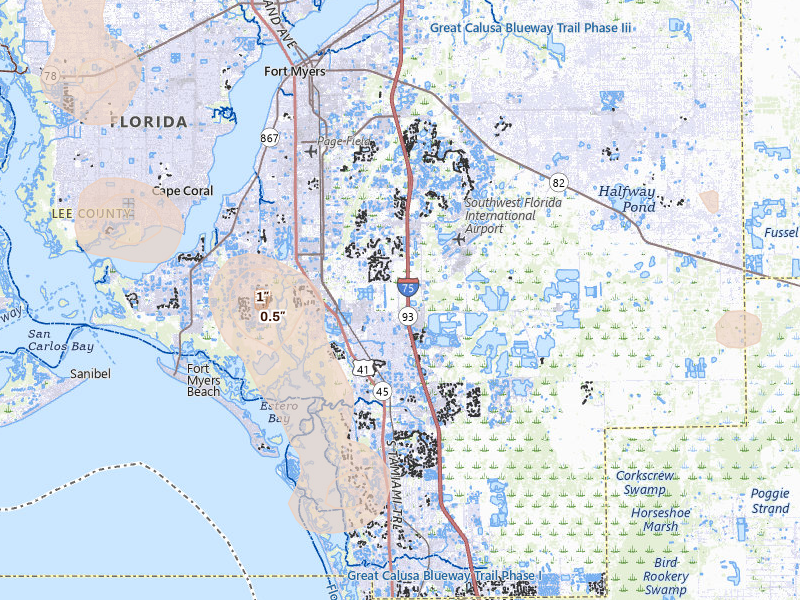
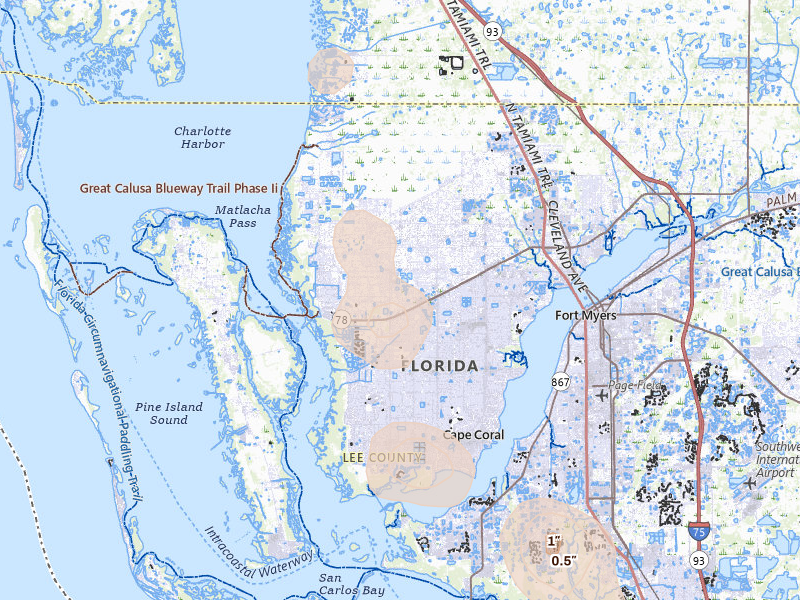
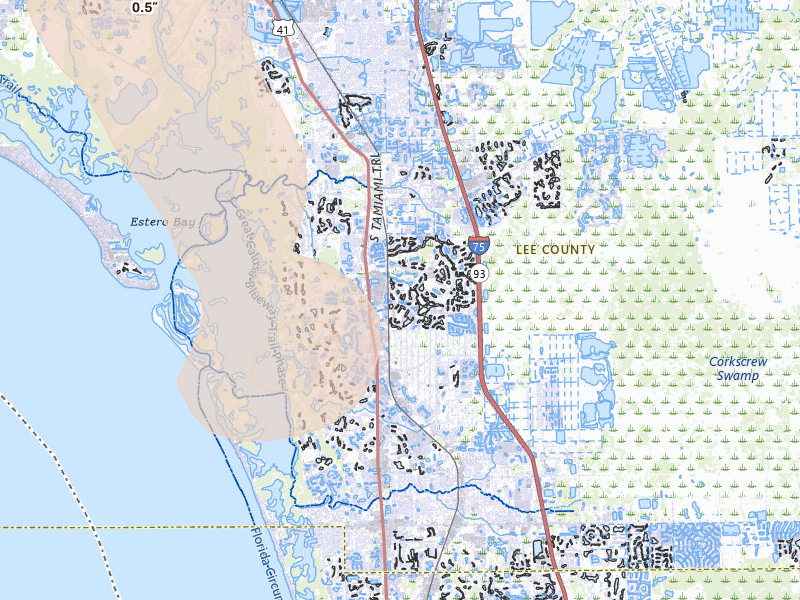
Fort Myers, FL 3.6 /10 severity
1" peak signal 16,892 mapped homes No ground reports
Cape Coral, FL 3.3 /10 severity
0.75" peak signal 21,875 mapped homes No ground reports
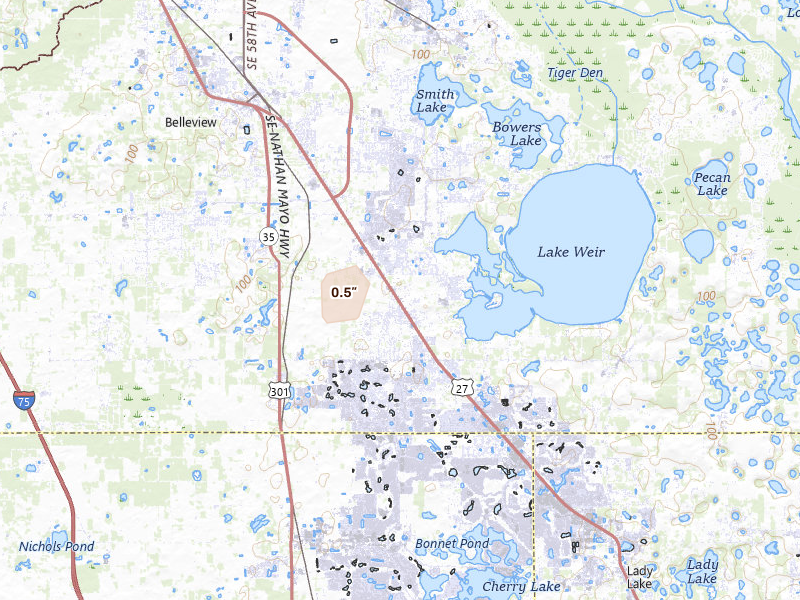
Bradenton, FL 3.1 /10 severity
0.75" peak signal 8,349 mapped homes No ground reports
Bonita Springs, FL 2.9 /10 severity
0.75" peak signal 3,302 mapped homes No ground reports
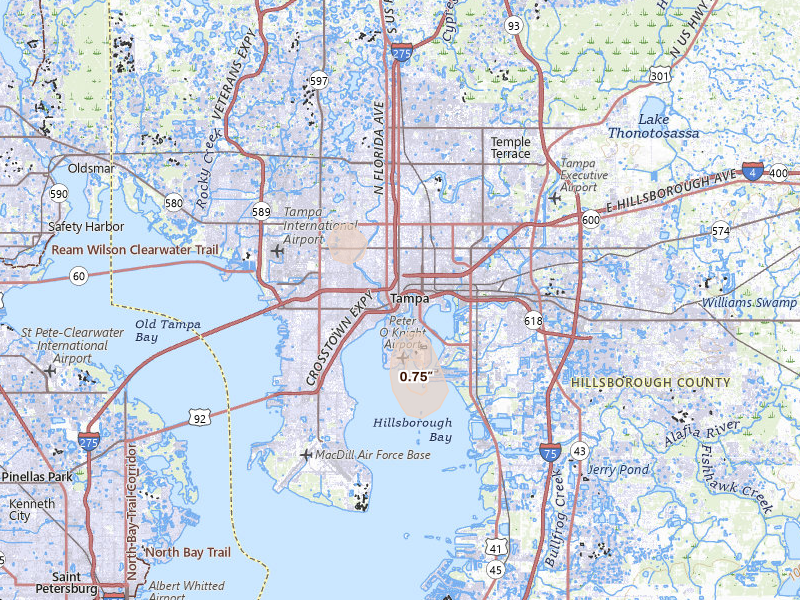
Tampa, FL 2.9 /10 severity
0.75" peak signal 3,202 mapped homes No ground reports
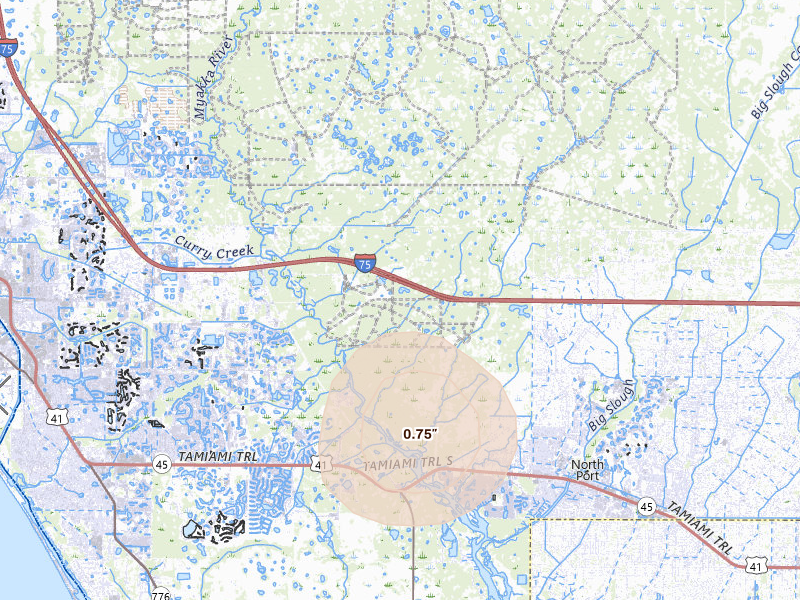
Venice, FL 2.9 /10 severity
0.75" peak signal 3,449 mapped homes No ground reports
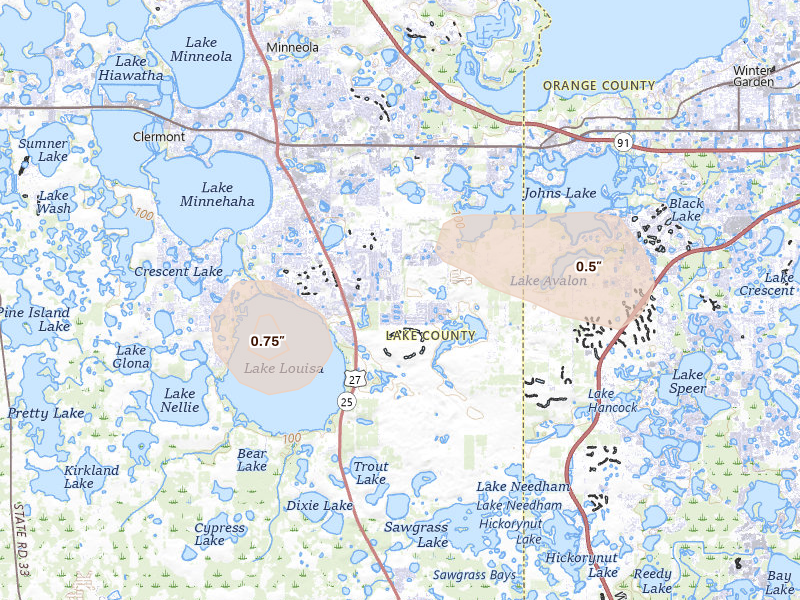
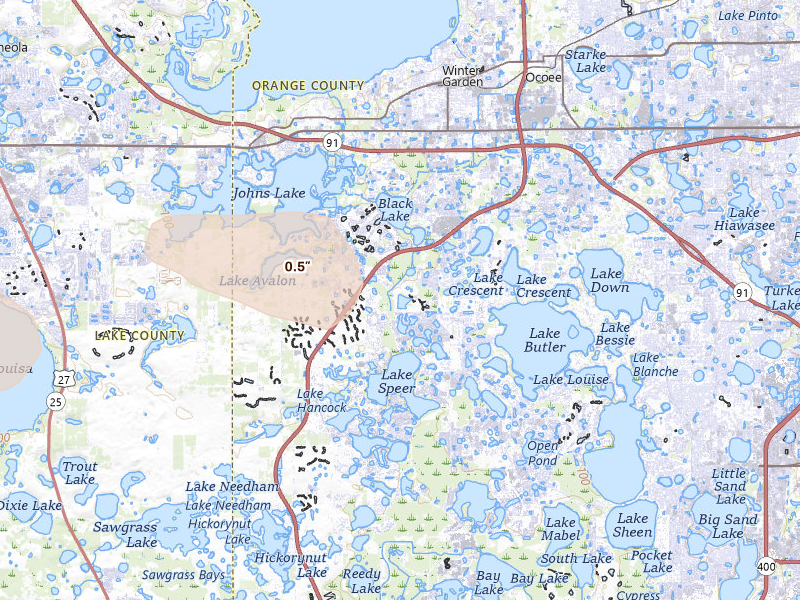
Clermont, FL 2.8 /10 severity
0.75" peak signal 1,895 mapped homes No ground reports
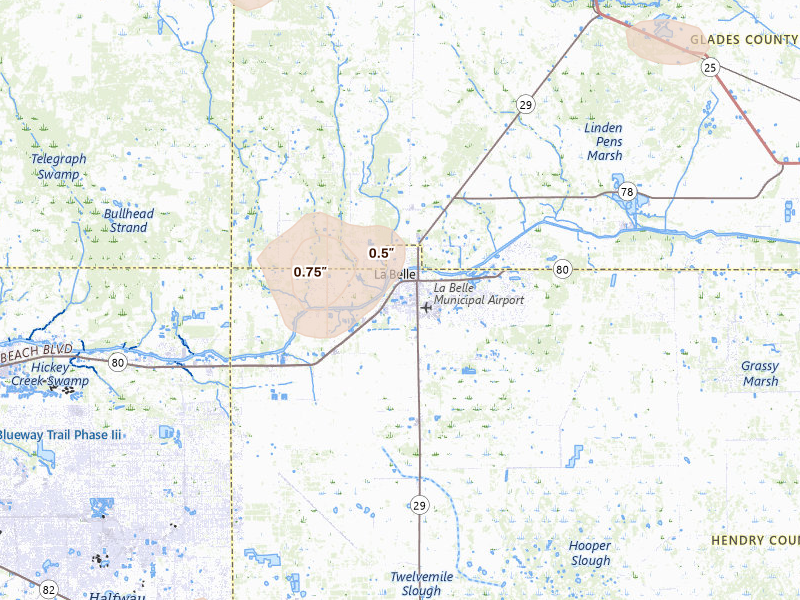
Labelle, FL 2.8 /10 severity
0.75" peak signal 1,958 mapped homes No ground reports
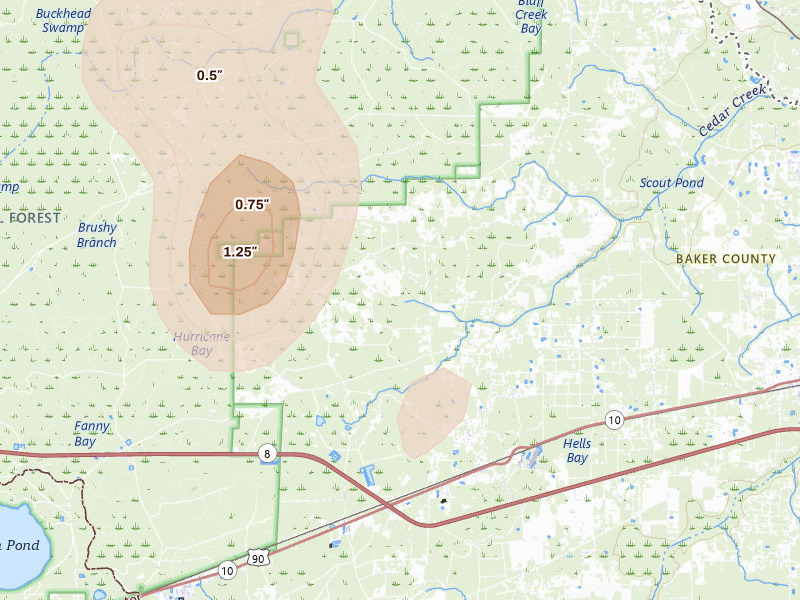
Sanderson, FL 2.8 /10 severity
1.25" peak signal 80 mapped homes No ground reports
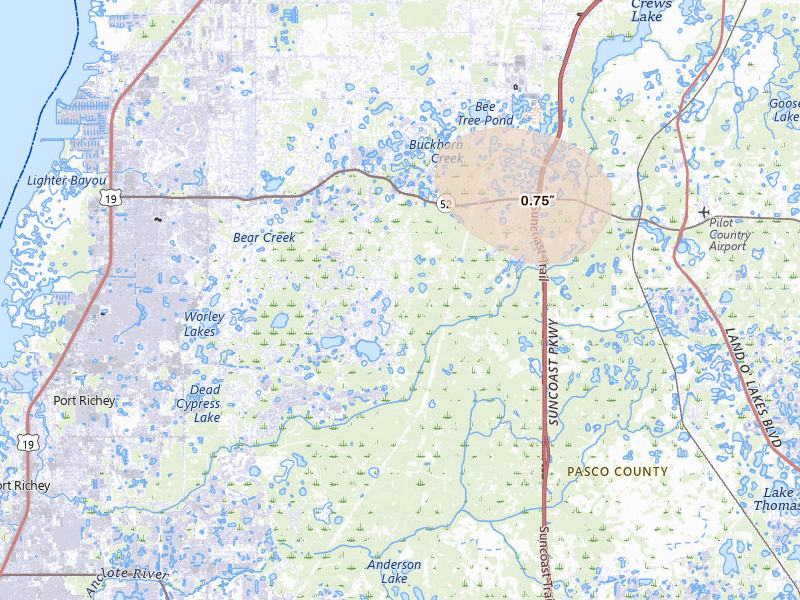
New Port Richey, FL 2.7 /10 severity
0.75" peak signal 1,385 mapped homes No ground reports
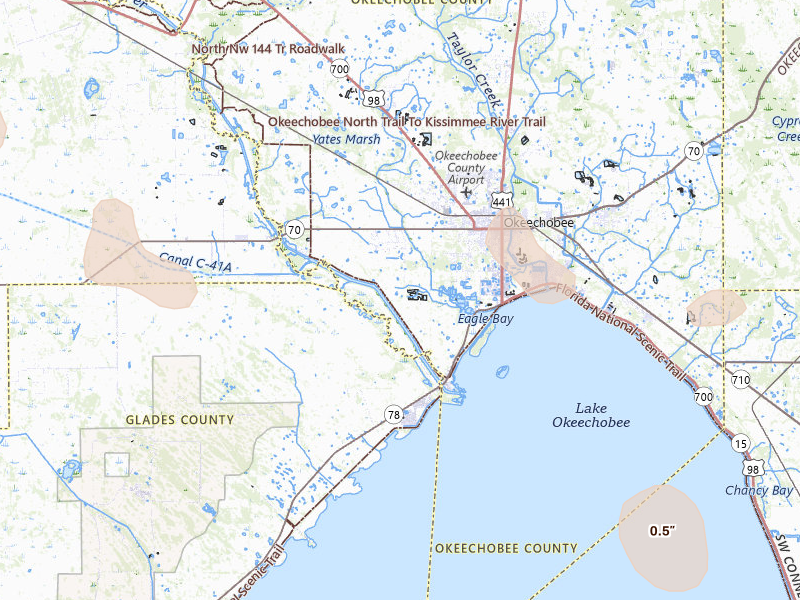
Okeechobee, FL 2.6 /10 severity
0.5" peak signal 5,075 mapped homes No ground reports
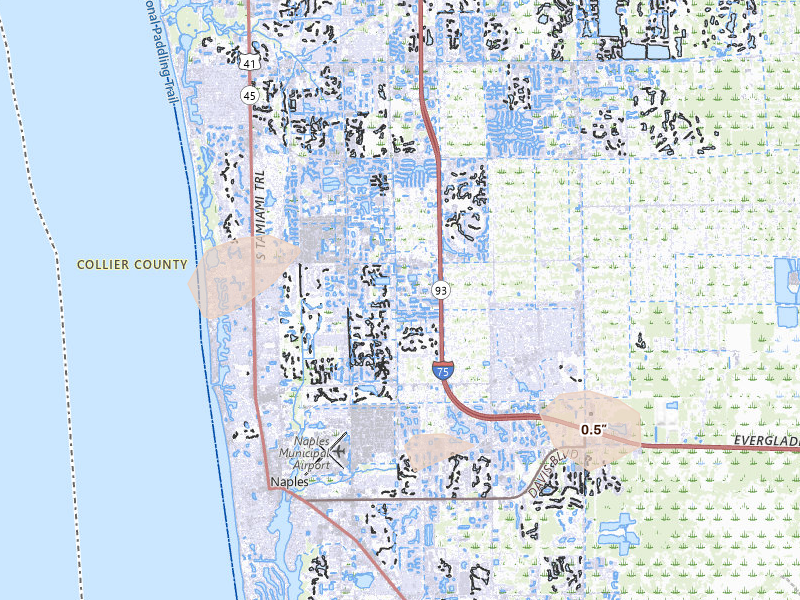
Naples, FL 2.5 /10 severity
0.5" peak signal 3,670 mapped homes No ground reports
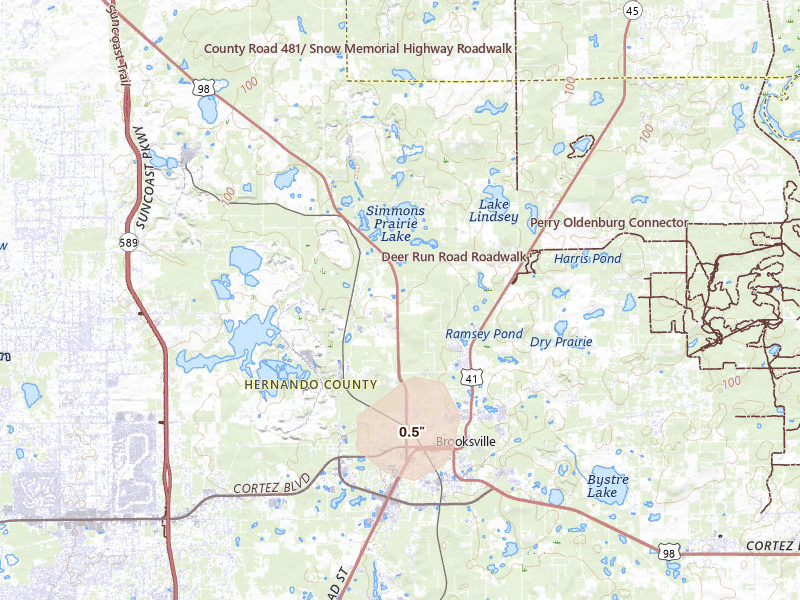
Brooksville, FL 2.4 /10 severity
0.5" peak signal 1,850 mapped homes No ground reports
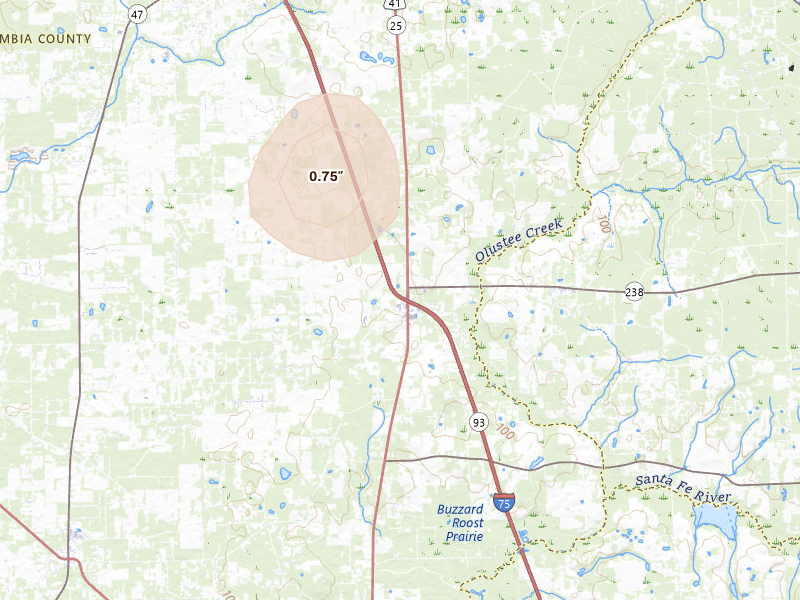
Lake City, FL 2.4 /10 severity
0.75" peak signal 306 mapped homes No ground reports
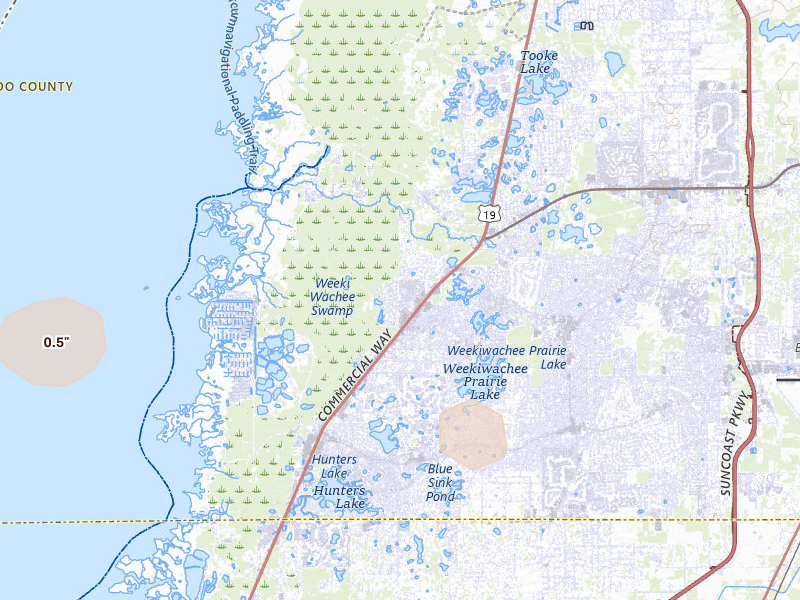
Spring Hill, FL 2.4 /10 severity
0.5" peak signal 2,020 mapped homes No ground reports
Winter Garden, FL 2.4 /10 severity
0.5" peak signal 2,057 mapped homes No ground reports
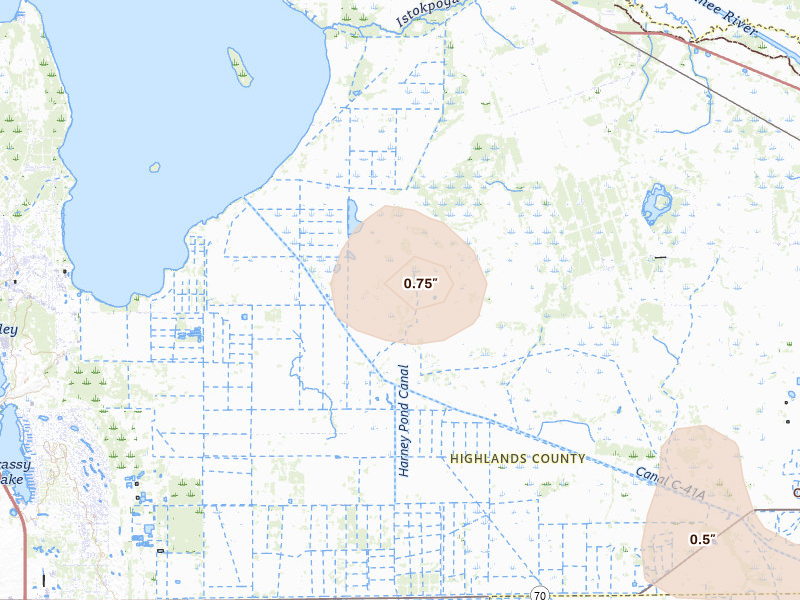
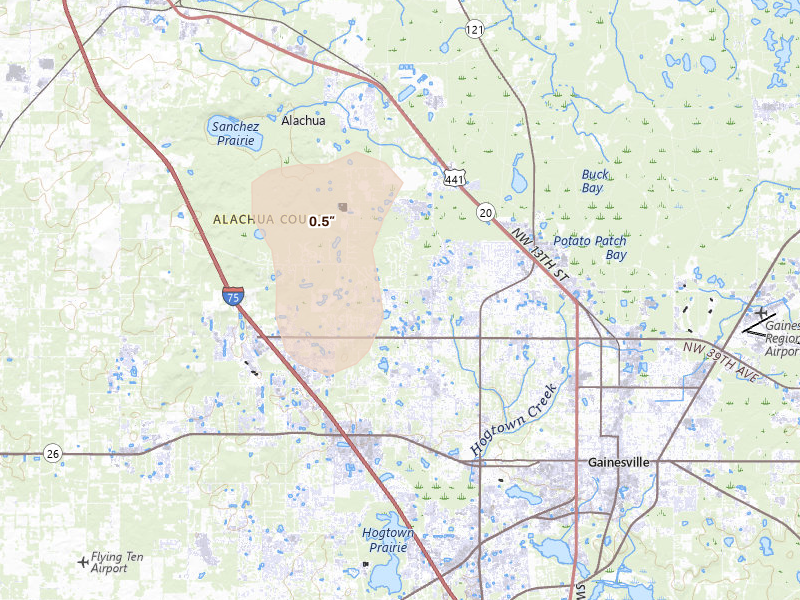
Gainesville, FL 2.3 /10 severity
0.5" peak signal 1,444 mapped homes No ground reports
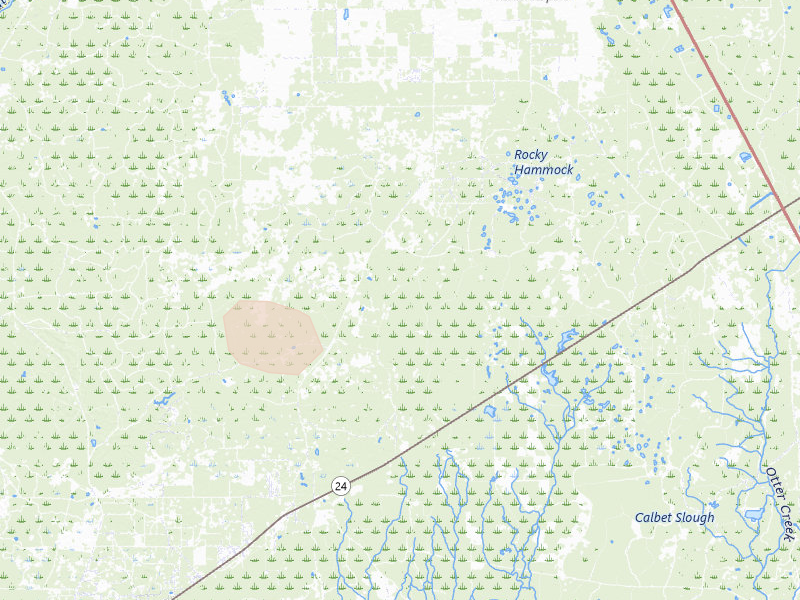
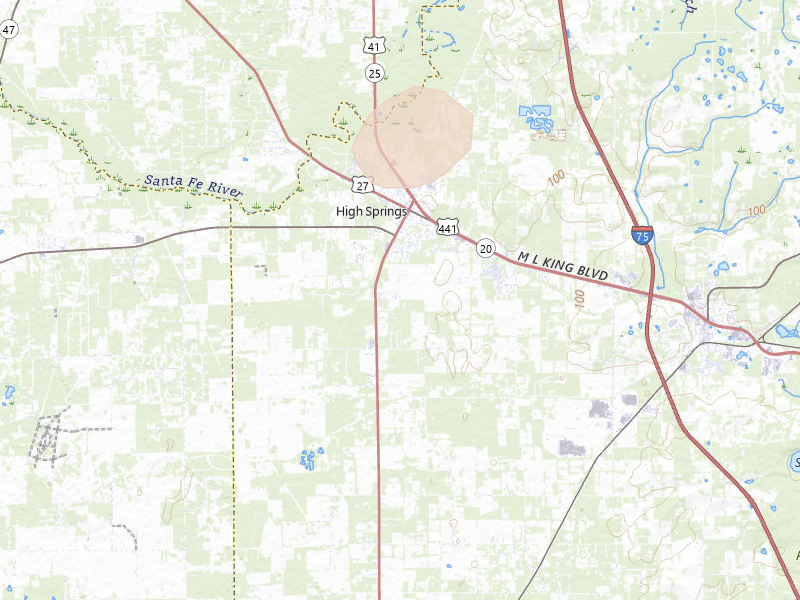
High Springs, FL 2.1 /10 severity
0.5" peak signal 408 mapped homes No ground reports
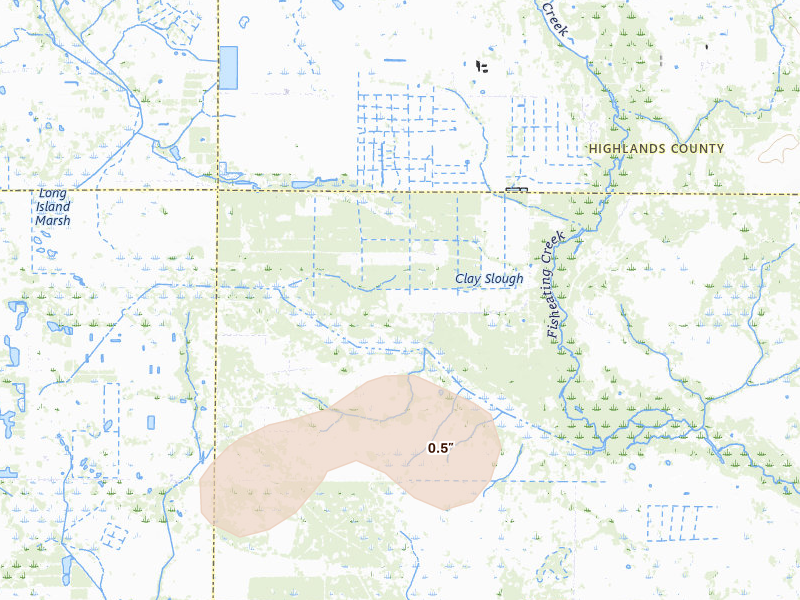
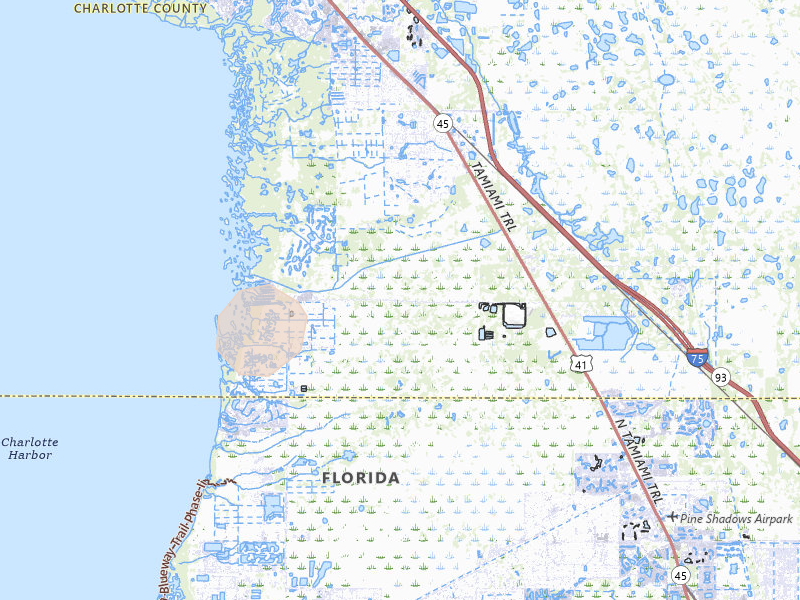
Punta Gorda, FL 2.1 /10 severity
0.5" peak signal 504 mapped homes No ground reports
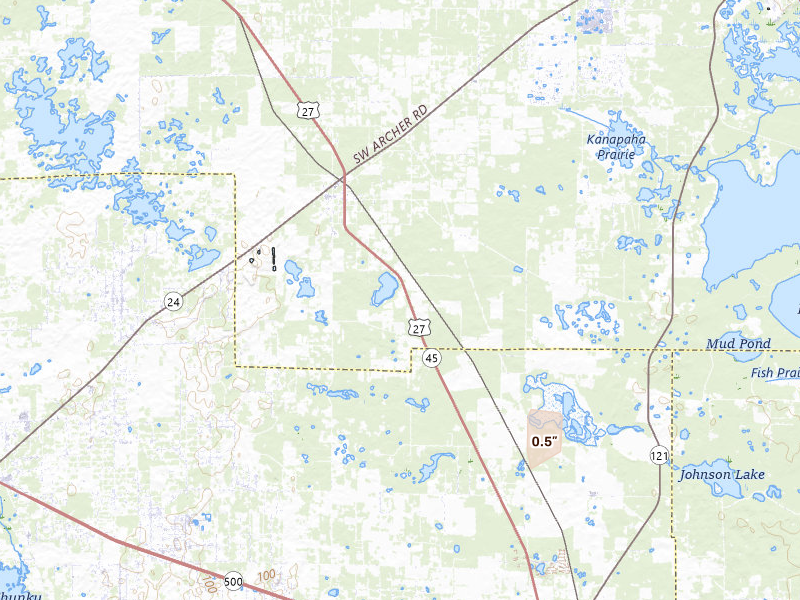
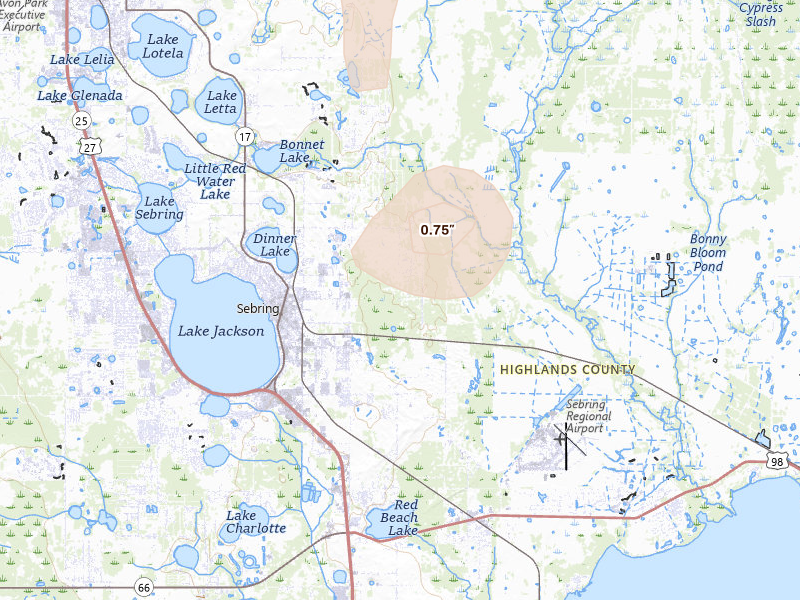
Sebring, FL 2.1 /10 severity
0.75" peak signal 97 mapped homes No ground reports
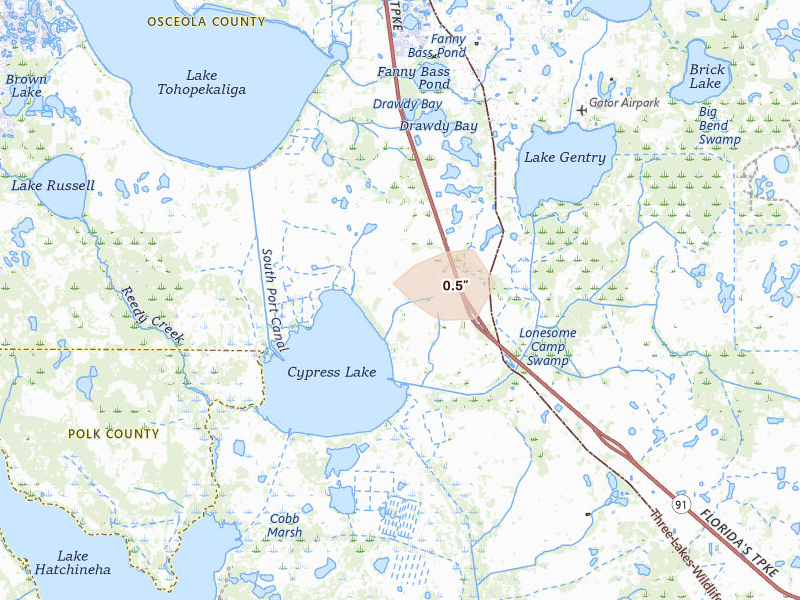
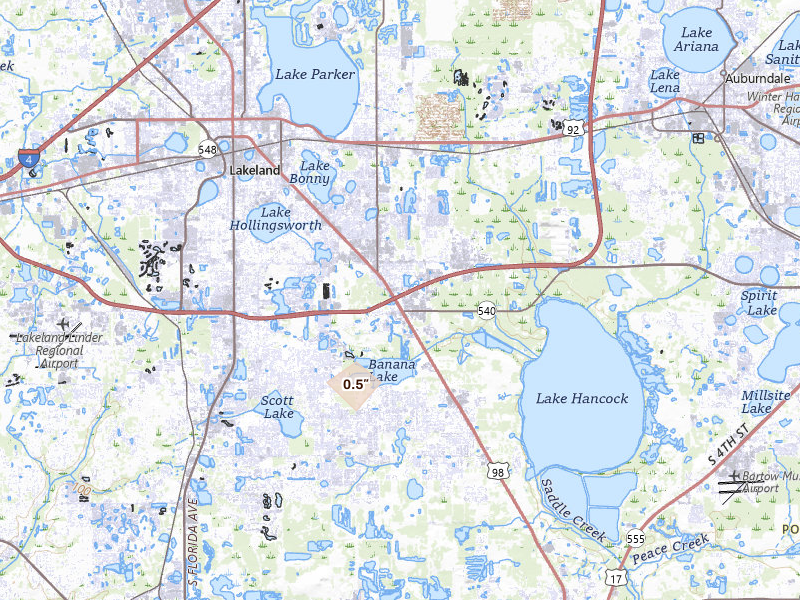
Lakeland, FL 2.0 /10 severity
0.5" peak signal 288 mapped homes No ground reports
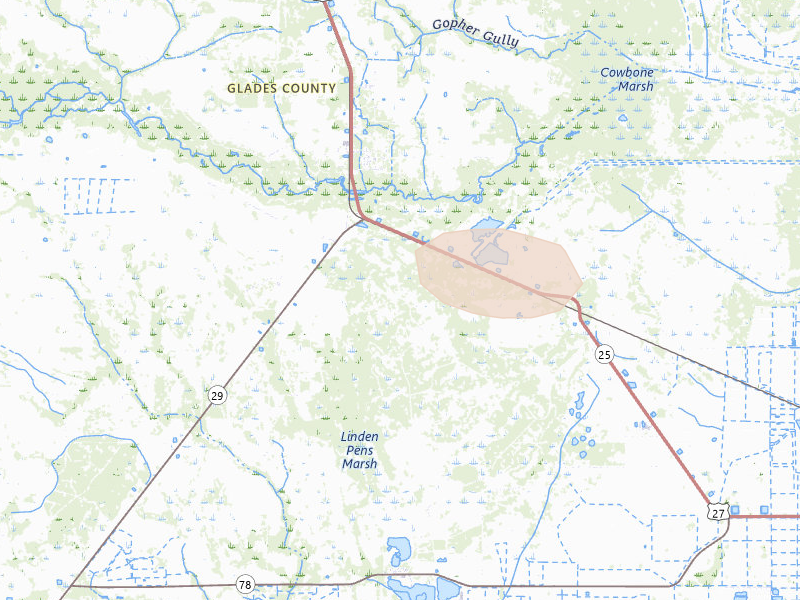
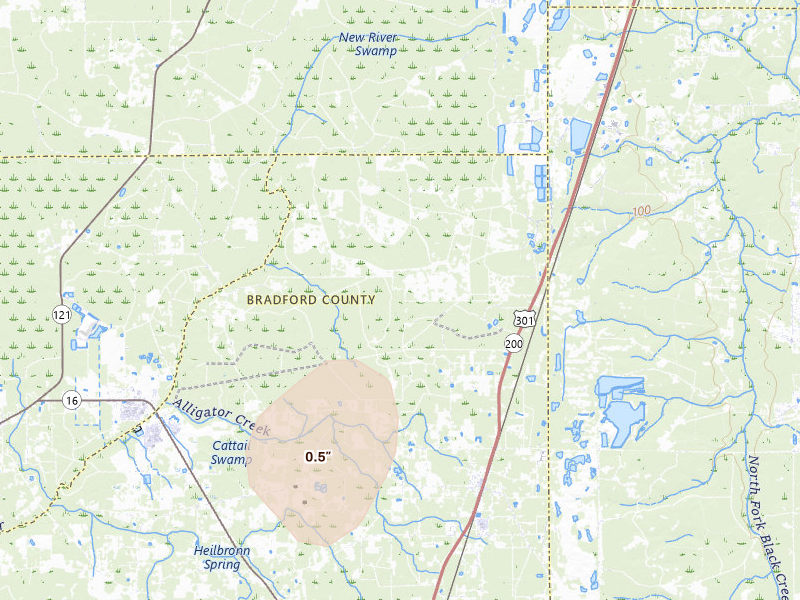
Lawtey, FL 2.0 /10 severity
0.5" peak signal 386 mapped homes No ground reports
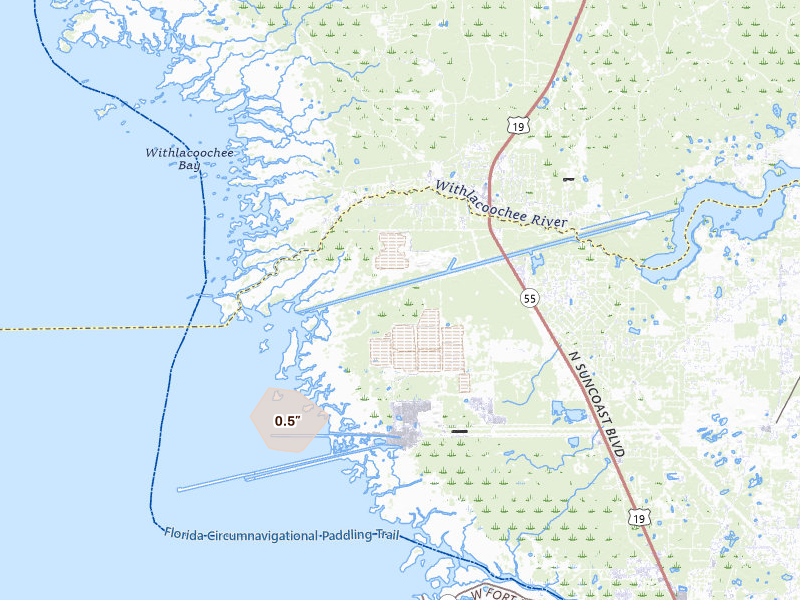
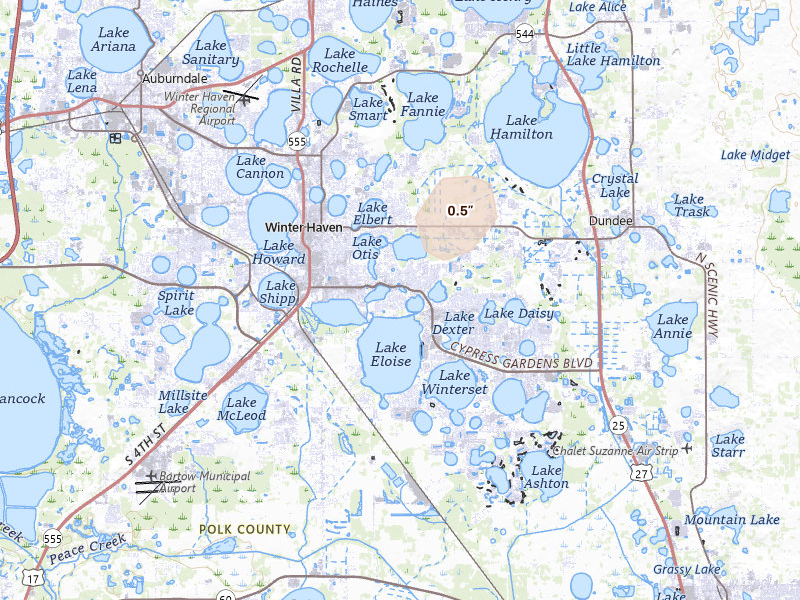
Winter Haven, FL 2.0 /10 severity
0.5" peak signal 352 mapped homes No ground reports
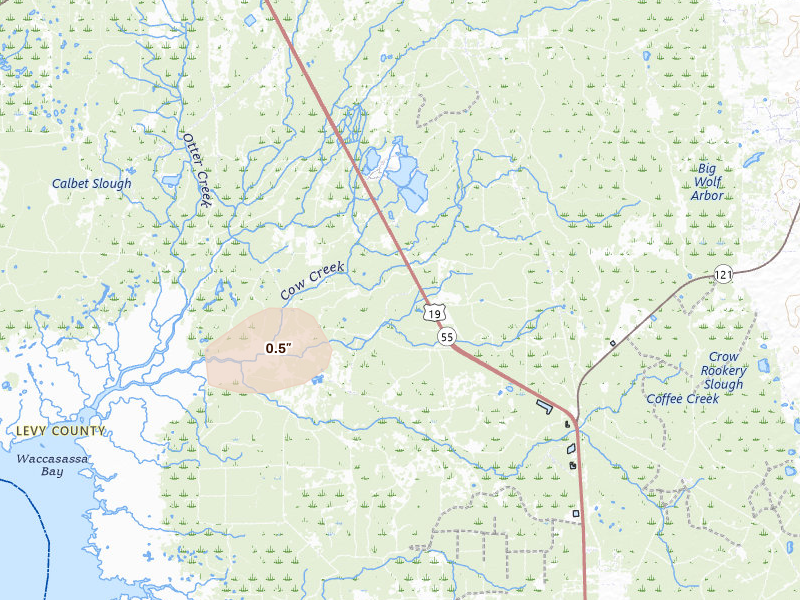
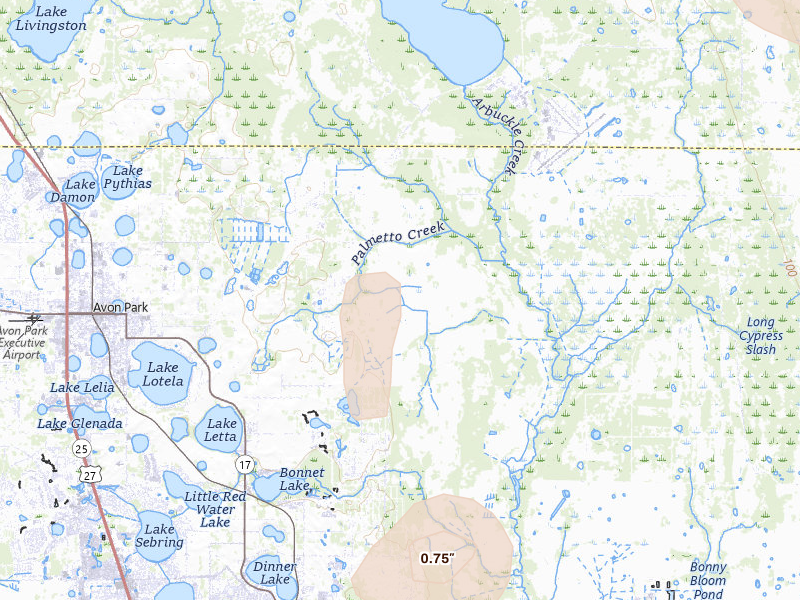
Avon Park, FL 1.8 /10 severity
0.5" peak signal 116 mapped homes No ground reports
Summerfield, FL 1.8 /10 severity
0.5" peak signal 108 mapped homes No ground reports
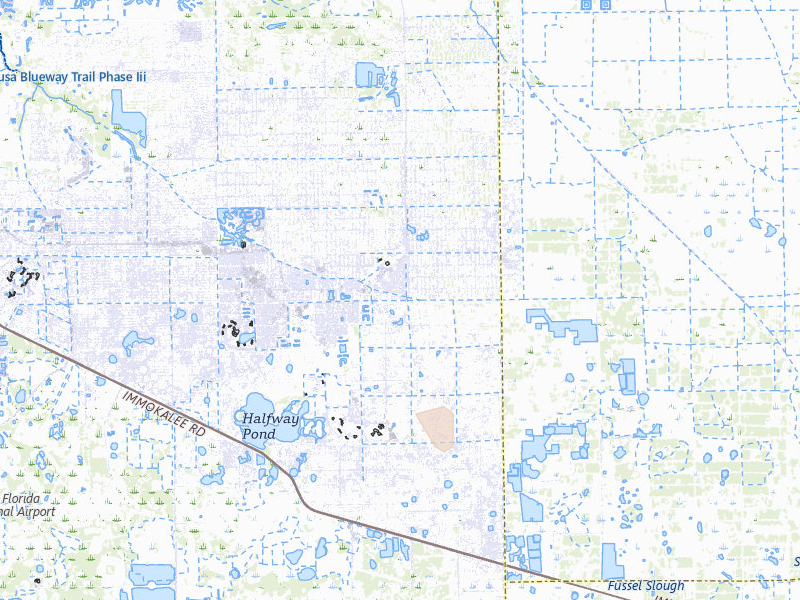
Lehigh Acres, FL 1.7 /10 severity
0.5" peak signal 99 mapped homes No ground reports
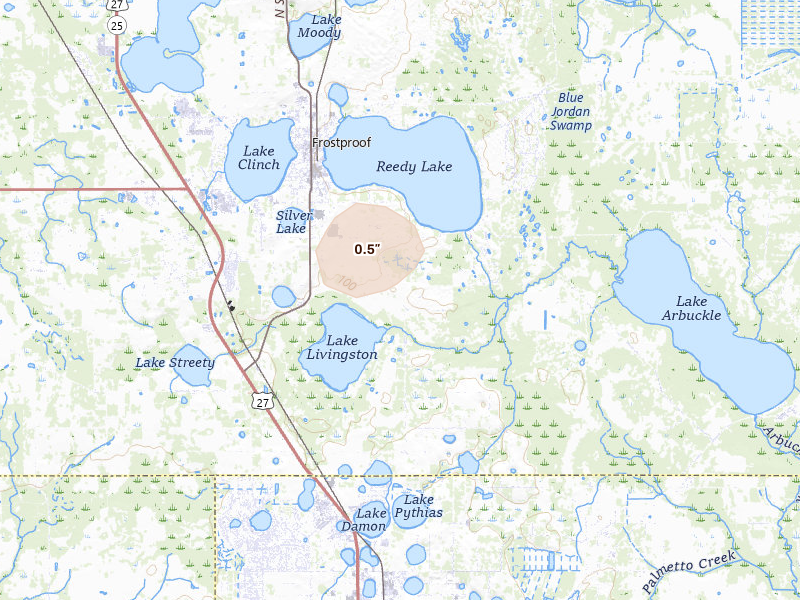
Frostproof, FL 1.5 /10 severity
0.5" peak signal 30 mapped homes No ground reports
Lorida, FL 1.5 /10 severity
0.75" peak signal 5 mapped homes No ground reports
Cedar Key, FL 1.2 /10 severity
0.5" peak signal 7 mapped homes No ground reports
Venus, FL 1.2 /10 severity
0.5" peak signal 9 mapped homes No ground reports
Archer, FL 1.1 /10 severity
0.5" peak signal 3 mapped homes No ground reports
Kenansville, FL 1.1 /10 severity
0.5" peak signal 3 mapped homes No ground reports
Moore Haven, FL 1.1 /10 severity
0.5" peak signal 3 mapped homes No ground reports
Crystal River, FL 0.8 /10 severity
0.5" peak signal 0 mapped homes No ground reports
Inglis, FL 0.8 /10 severity
0.5" peak signal 0 mapped homes No ground reports

Montana

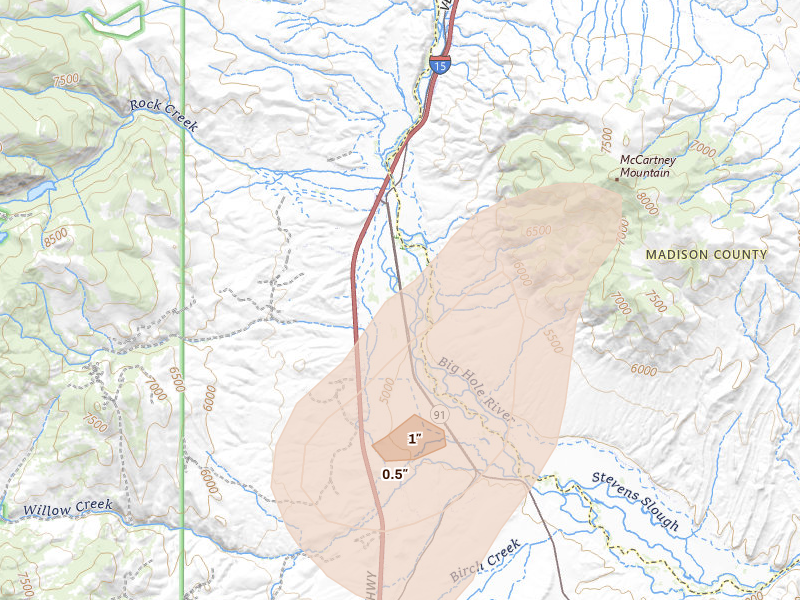
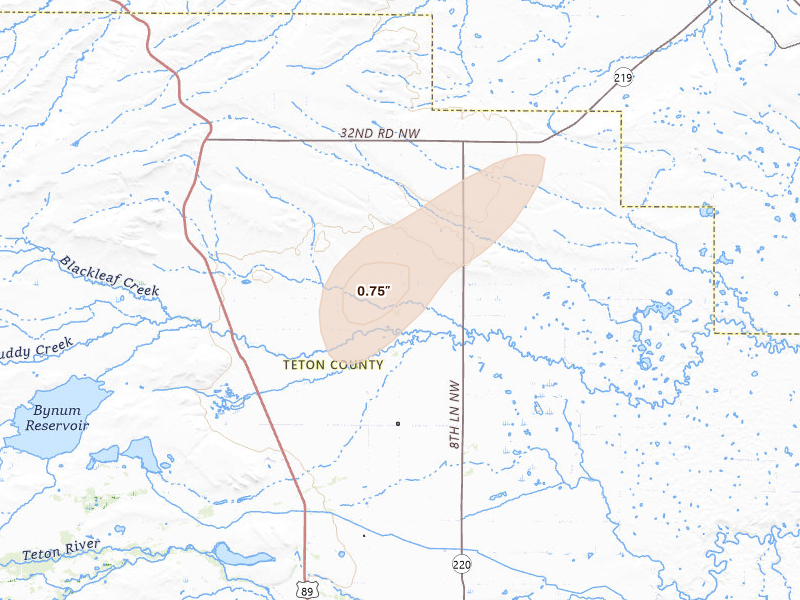
4 cities · up to 1" · 289 mapped homes
Nebraska

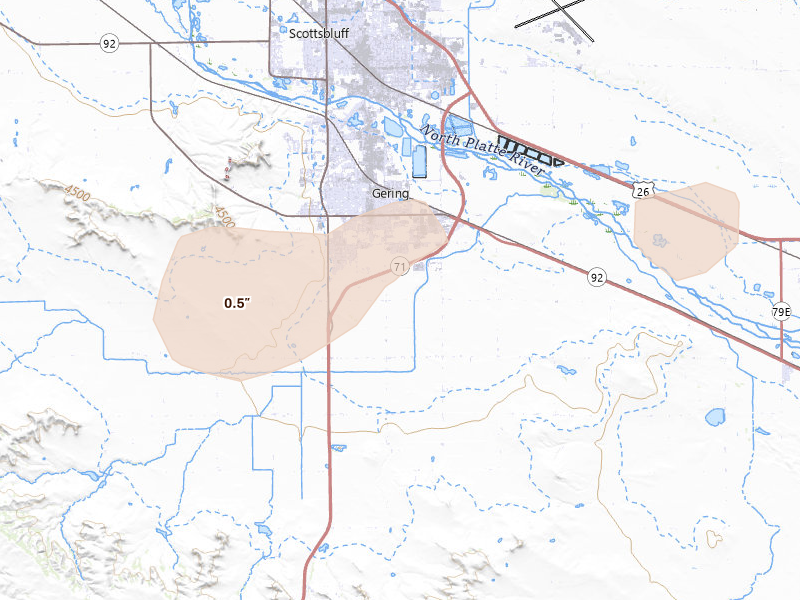
6 cities · up to 0.75" · 2,103 mapped homes
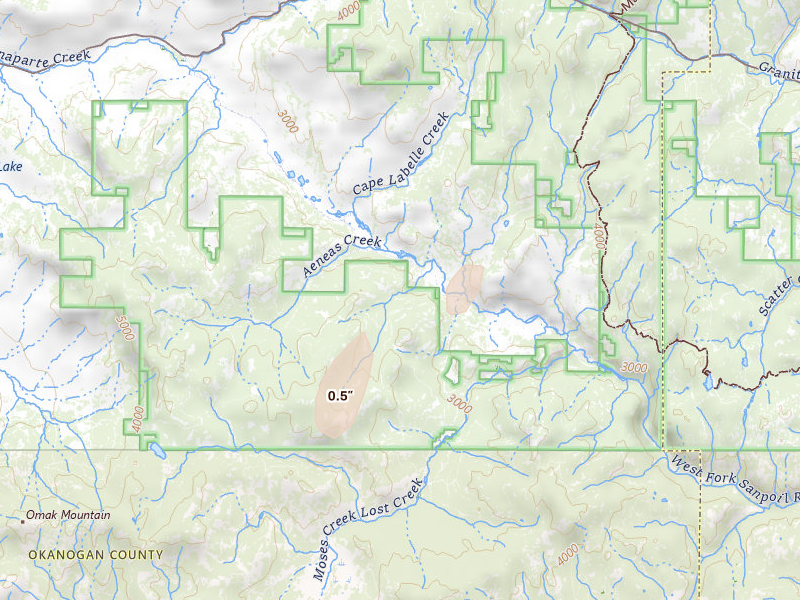
Washington

1 city · up to 0.5" · 39 mapped homes
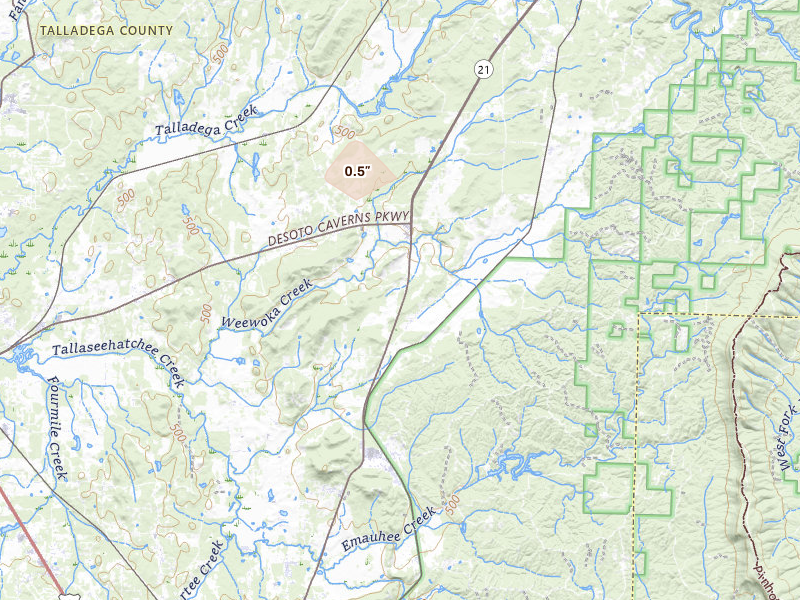
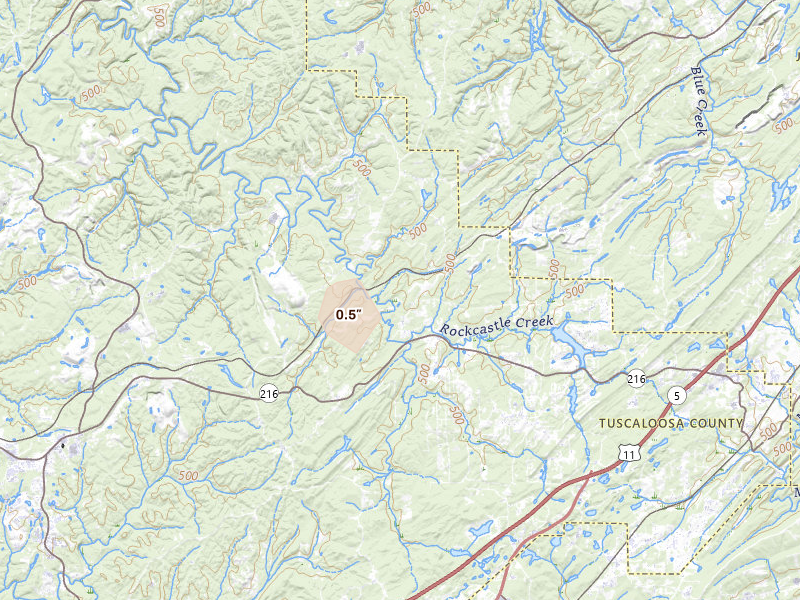
Alabama

2 cities · up to 0.5" · 26 mapped homes
Georgia

1 city · up to 0.5" · 23 mapped homes
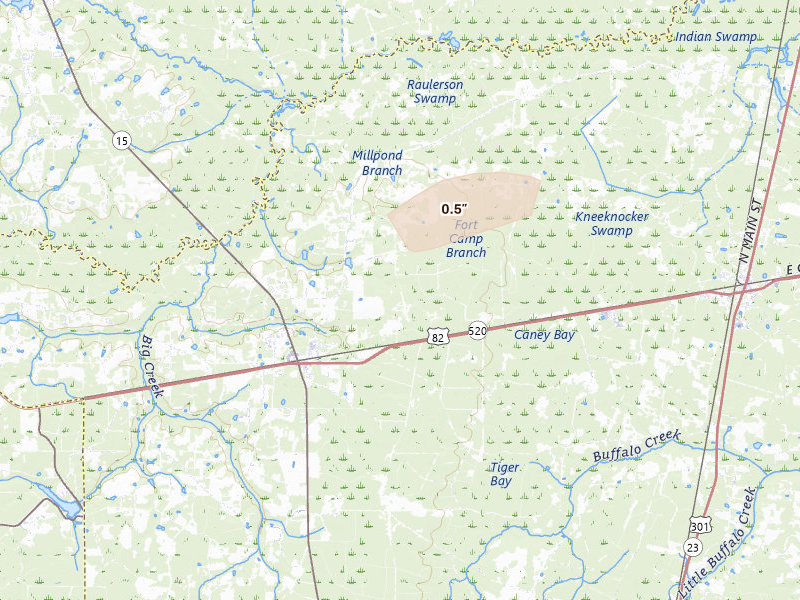
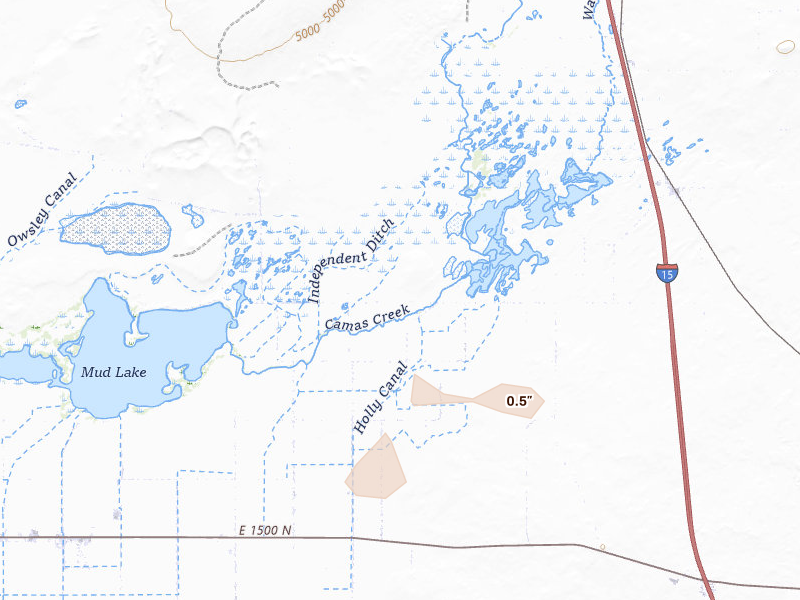
Idaho

1 city · up to 0.5" · 15 mapped homes
← All storm days

Overview Pro · iPhone + web

One app for your prospecting day.

The hail map, your next recommended area, and the tools to work it. Start on your own; the same subscription also includes access for up to 4 team members.

Overview Pro

One plan · iPhone + web

Monthly · US App Store

$149.99 / month

5,000 new addresses per user each month on Pro. Try the app with 200 addresses during your free trial.

Optional outreach

+ $0.21 per contact returned
Available homeowner names and phone numbers, with freshness and DNC flags.
+ $0.75 per postcard mailed
Print, postage, and delivery tracking included.

What's included

Get recommended places to prospect, or draw your own. The same plan gives you the tools to work either one.

  • Hail maps, storm history, and live radar
  • Curated prospecting recommendations and Quests
  • Canvassing sessions and navigation
  • Door outcomes, notes, and photos
  • Visit history and follow-up Quests
  • Alerts for your saved territories
  • Polygon and hexagon draw tools
  • Saved work areas and address lists
  • CSV exports for your dialer or CRM
  • XP, levels, and the leaderboard
  • Access on iPhone and the web
  • Up to 4 team members

7-day free trial in the iPhone app. No card required to start.

Choose whether to subscribe when your trial ends. Paid subscriptions renew monthly. Manage or cancel in your Apple Account settings.

See all pricing and billing details →
Start free trial

Web trial: 7 days free. Card required. $150/month after the trial unless cancelled.

Take your next area into the field.

See the hail, review your recommendations, and canvass with Overview on iPhone.

Download on the App Store

7-day free trial in the iPhone app. No card required to start.

For iPhone. Android coming soon.

Open Aug 29 on the live map → Start free trial

Web trial: 7 days free. Card required. $150/month after the trial unless cancelled.

Storm days are convective days (noon-to-noon UTC). Cities and counts are the set Overview tracks, not every place hail fell. Ground reports are public-domain observations from the NOAA Storm Prediction Center; radar sizes are detections and estimates, not confirmed damage.